Infrared Thermography Characterization of Defects in Seamless Pipes Using an Infrared Reflector
Heesang Park*, Manyong Choi* Jeonghak Park*, Jeajung Lee*, Wontae Kim** and Boyoung Lee***
Abstract Infrared thermography uses infrared energy radiated from any objects above absolute zero temperature, and the range of its application has been constantly broadened. As one of the active test techniques detecting radiant energy generated when energy is applied to an object, ultrasound infrared thermography is a method of detecting defects through hot spots occurring at a defect area when 15~100 kHz of ultrasound is excited to an object. This technique is effective in detecting a wide range affected by ultrasound and vibration in real time.
Especially, it is really effective when a defect area is minute. Therefore, this study conducted thermography through lock-in signal processing when an actual defect exists inside the austenite STS304 seamless pipe, which simulates thermal fatigue cracks in a nuclear power plant pipe. With ultrasound excited, this study could detect defects on the rear of a pipe by using an aluminium reflector. Besides, by regulating the angle of the aluminium reflector, this study could detect both front and rear defects as a single infrared thermography image.
Keywords: Infrared, Thermogarphy, Ultrasound, Lock-in, Aluminium Reflector [Original paper]
Journal of the Korean Society for Nondestructive Testing Vol. 32, No. 3 (2012. 6)
[Received: May 4, 2012. Revised: June 14, 2012. Accepted: June 15, 2012] *Safety Measurement Center, Korea Research Institute of Standards and Science, Daejeon 305-353, Korea, **Division of Mechanical and Automotive Engineering Kongju National University, Cheonan 331-717, Korea, ***School of Aerospace & Mechanical Engineering, Korea Aerospace University, Goyang-city 412-791, Gyeongggi-do, Korea Corresponding Author: [email protected]
1. Introduction
Out of all the non-destructive test techniques widely used at present, thermoraphy using infrared rays is more on the rise in the range of its application. Especially, since this ultrasound infrared thermography is able to inspect large domains affected by ultrasound energy at the same time, its application fields are being broadened [1,2]. As a result, some research are constantly conducted on the detection of SCC(stress corrosion cracking) minute defects generated inside a pipe, through ultrasound infrared thermography. However, this technique has a weakness due to the characteristics of thermography. Since images measured by the infrared camera are detected as two-dimensional ones, the previous research used a method of detecting defects by rotating the camera around a
pipe or rotating the pipe when a pipe was inspected. This method also has other problems when being applied to an actual site, so it is needed to carry out research on a new method.
Thus, this study conducted an experiment to find out whether crack defects inside the austenite STS 304 pipe, used for pipes of a nuclear power plant, can be detected from one direction through ultrasound infrared thermography and infrared reflection method.
2. Measurement Theory
2.1 Ultrasound Infrared Thermography Technique
Fig. 1 shows the thermography test technique using high energy ultrasound excitement causes heat locally in the defected part by impressing
Fig. 1 Configurations of ultrasound excited thermo- graphy system
short ultrasound pulse to the test specimen (pulse width: 50~200 ms, frequency: 15~100 kHz).
The infrared thermography camera records and stored the process of heat-generation phenomenon in the defected part according to the time progress, before and after the impression of ultrasound pulse, while converting it into images to detect the defects of test specimen [3]. In other words, after impressing the vibration energy to the structure in the case of the ultrasound excited, hot spots within several dozens of ms are observed by the thermography camera.
Ultrasound with frequency ranging 19.8 kHz has several dozens of cm in the wavelength constituent. In addition, in the case that it is carried out to go much farther distance than the wavelength, ultrasound can spread, having sufficient amplitude energy, which means that when there is no loss in the material, ultrasound can spread to the distance of several wavelengths. The sonic speed of solid matter is up to several km/s. Those traits of ultrasound indicate that the sound field completely contains the test domain of materials used for this experiment. The decrease of sound amplitude in solid matter is proportion to the square of the frequency of sound wave [4]. The higher the
frequency is, the vibration wavelength gets lower due to the ultrasound vibration.
Accordingly, in order for heat-generation to be effectively excited in the defected part of structure, frequency ranging 19.8 kHz is widely used by using frequency ranging 15.0 kHz to 40.0 kHz.
2.2 Infrared Reflection Rate
The infrared reflection rate can be measured with the ratio of quantum obtained by measuring the infrared reflected light of both a standard sample and a measurement sample, whose reflection rates are already known, in the same conditions. When radiant energy enters an object, it can be calculated as shown in eqn. (1) according to law of conservation of energy.
(1) Where, ρ is the reflection rate, α is emissivity and τ is transmittance. Since the transmittance is τ=0 for the thermal radiation on the surface of an opaque object,
(2) the equation will be as above. That is, the rest of the energy after reflection is absorbed into the object. According to Kirchhoff, the relation between the spectral emissivity and spectral absorptivity of an object can be shown as follows;
(3) Accordingly, with the infrared reflection rate on the surface of a material, it is possible to calculate the emissivity through eqns. (2) and (3). The infrared reflection rate is calculated through eqn. (4) by measuring , the reflection energy intensity of a standard sample and , the reflection energy intensity of a measurement sample.
(4) The reflection energy of a reflection standard material is calculated through Plank's law in eqn. (5)[5].
exp
(5) Where,
× ∙ and
× ∙.
2.3 Theory of Applying Lock-in Phase Ultrasound-Infrared Thermography
Lock-in infrared thermography techniques can be largely divided into two kinds of algorithms. One method uses DFT(discrete fourier transform) and the other one is harmonic approximation-based algorithm. DFT is defined through a discrete fourier transform equation that converts discrete complex number (n=6) values,
, into complex number values, . eqn. (6)
∙
∙ ∙
∙
(6)
At this point, j value of DFT can be expressed into Re (real part) and Im (imaginary part) in addition to an increase of frequency, and it is possible to calculate (amplitude value) and ∅ (phase value) by using Re and Im, as shown in eqns. (7) and (8).
(7)
∅
(8)Through the equations above, amplitude images and phase images can be obtained as
frequency is selected [1]. HA(harmonic approxi- mation) is a way of calculating changes in phase and amplitude by taking a certain stimulus as harmonic function and injecting in into the target object and then processing response signals from the target object. Gloss, ultrasound and vibration, etc. are used as an outer stimulus by the kinds of defects and the materials of objects since they are easy to regulate with harmonic function. This study applied ultrasound thermography that takes ultrasound as a stimulus in order to detect defects, and by applying sine wave signals including the harmonic function algorithm to ultrasound and synchronizing the infrared-ray sensing element, it was possible to obtain response signals from the target object. Through the in-sold first dimensional heat equation expressed as eqn. (9), defects can be detected by applying vibration to the target object with the harmonic function cos through ultrasound as an outer stimulus and then by observing the change of heat source occurring at the connecting piece of the target object[6].
(9)
Here, represents temperature, time, thermal conduction coefficient, density, specific heat and distance toward the direction of thermal flow. The solution of eqn. (9) heated up by sine waves including harmonic function can be expressed as eqn. (10).
cos (10) Here, when ultrasound is applied, thermal diffusion length is , and thermal diffusivity is . In the lock-in phase technique, by extracting phases from the measurement results in eqn. (10), it is possible to improve the detection sensitivity while minimizing the number of defect detection errors
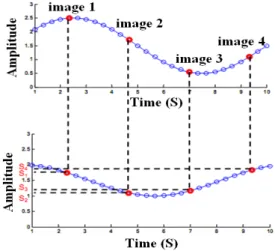
Fig. 2 Images selection during harmonic approximation processing algorithm
Fig. 3 Detection of direction
caused by the heterogeneity of surface emissivity. As shown in eqns. (11) and (12), harmonic approximation is the approximate value of fourier transform based on a concept that 4 data points every modulation cycle provide exact phases and amplitudes of sine wave signs through this method. When much more data points are used, noise can be reduced more, but when focusing on 4 data points between the equal intervals, S1~S4, it is possible to calculate amplitude (A) and phase-shift (Φ) value related to the standard modulation.
(11)
tan
(12)Fig. 2 shows the not only the fourier transform-based processing method but the sine wave approximation-based algorithm is provided phase images and amplitude images from the thermographic sequence.
The aluminium plate emissivity used for this experiment was measured through the emissivity measurement method of KS B 5361:2008 industrial solid materials [8]. As a result, the
reflection rate was found to be 91%. As the criteria, amplitude signals are provided by the sign period through a simulation or a vibration source for lock-in thermographic experiments, and each pixel from S1 to S4 is the emission value of 4 images selected.
3. Experiments
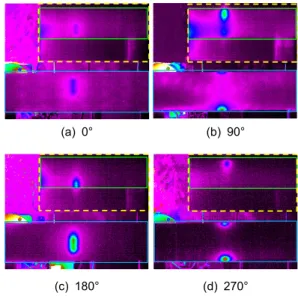
In Fig. 3, in order to make the same form of cracks as natural ones, chemical notches with 0.2 mm in depth were provided inside the specimen toward the circumference, and the specimen made by giving heat fatigue repetitively was placed horizontally and excited with ultrasound. According to the approximate location of specimen. the experimental condition varied. For instance, the angle of 0° up to 270°
was rotated by 90° respectively to detect defect forms appearing during the experiment. The test direction was in the order of 0°, 90°, 180° and 270° for photographing [7].
At the moment when ultrasound vibration pulse is impressed, the ultrasound infrared thermography equipment consists of ultrasound excitement equipment and an infrared thermo- graphy camera, and in order to minimize the heat exchange between test specimen and outer heat source during the test, experimental equipment is installed inside the insulation chamber as shown in Fig. 4. The infrared excitement equipment has 400 Watt of output and 20 kHz of frequency, while Silver 480
Fig. 4 Configuration of ultrasound excitement equipment and infrared reflector
(a) 0° (b) 90°
(c) 180° (d) 270°
Fig. 5 Using lock in thermography images of piping hot spot
Model (NEDT: 25 mK) made in French Cedip was used for the infrared camera. As for the material of specimen, seamless pipes of STS 304 in the austenite category was used, and pipes with 89 mm in outside diameter (OD), 11 mm in thickness and 500 mm in length were repetitively given heat impact for fatigue test to produce defect specimen similar to natural cracks. For the sensitiveness of thermography images, the surface of pipes was applied with black flat paint so that such a complete condition might be satisfied as black body with 1 of emissivity. Besides, the ultrasound exciting horn and the exciting area of pipes are excited in a state of being properly pressed with the power of 294 N. The distance between the camera and a pipe was 1,700 mm, and the reflector was located 270 mm far from the rear of the pipe.
Besides, the reflector was installed in the slope of 15 ° at a point 10 mm higher than the top of the pipe. Made of aluminium Al 5052 and 300 mm in width, the reflector was 200 mm in height and 1 mm in thickness.
4. Result
Fig. 5 shows lock-in images obtained when the sinusoidal wave was excited at intervals of 30 mHz at each angle. As shown in Fig. 5, dotted borders located in every picture indicate the reflector domain. The rectangle located in
the dotted border is a reflected image of the rear of the pipe, and the quadrangle located below it shows an thermography image detected in the front of the pipe. Image (a) shows hot spots detected as defects at the angle of 0°. Hot spots occurring in vertical direction in the center of the pipe were detected in the front of the pipe, and hot spots in a vertical direction were detected in the rear of the pipe as well.
In other words, when the infrared camera detected defects in the frontal direction, it will be easy to detect defects in real time through the infrared reflector. At present, out of all the non-destructive tests used for pipes through infrared thermography, most of them are halogen lamp-applied tests. When a pipe is inspected with a light source used as an energy source, the frontal part to which the light source is applied becomes heated, further leading to thermal behaviors, so it is difficult to detect defects in the rear of a pipe.
As for a method of detecting defects existing in the rear of a pipe through a light source and an infrared reflector, when the light source is applied to the frontal part, the energy of the light source applied is also applied to the rear of
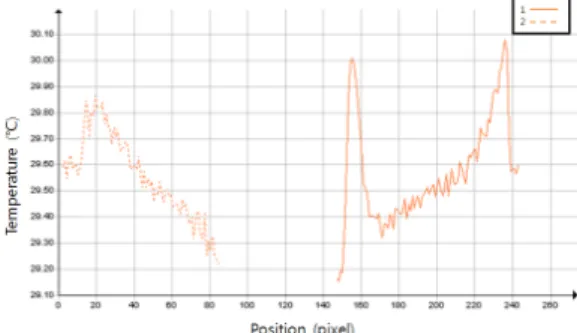
Fig. 6 The temperature image of (d) in Fig. 5
Fig. 7 The temperature graph of hot spot domains in Fig. 6
a pipe through the reflector, and then thermal behaviors occurring in the rear part can be detected as infrared thermography images.
However, due to the effect of thermal energy of the limited light source provided through the reflector, it is not easy to detect defects. As for ultrasound infrared thermography, unlike light source-used infrared thermography, since the same heat generation mechanism works in an area under the influence of ultrasound and vibration occurring when ultrasound is excited, it will be easy to detect defects in real time through the infrared reflector. Image (b) in Fig.
5 is an thermography image when the pipe was rotated at 90°. Through the image, it was found that some of the hot spots occurring in the front of (a) remain on the upper part of the front, and a bit larger hot spots exist below the area. Hot spots partially existing on the upper part clearly prove that they have moved to the direction of rear images through images of the rear of a pipe seen on the reflector. The thermography image in (c) is one detected when the pipe was rotated at 180°, and it was detected with hot spots existing, which was judged as a defect of the frontal part only. As a result of checking the image of the rear of a pipe through the reflector, however, it was found that defects existed below the rear part. That is, through the 180° image of (c), which is contrary to the 0° pipe measurement image of (a), it was found that hot spots appearing on the reflector exist as actual hot spots. thermography Image (d) shows a pipe rotated at 270°, and it is a thermography image located in the front, which used to be opposite to Image (b) located at the angle of 90°.
It also shows that hot spots existed on the upper part and the bottom part of a pipe.
Besides, this study found out that a long defect in a horizontal direction in the front of (c) moved to the upper part and the rear of a pipe, through the infrared reflector.
Fig. 6 shows the temperature image of (d) in Fig. 5, and it was not easy to divide domains of hot spots showing defects, compared to the images with the lock-in signal processing performed. Fig. 7 shows the temperature graph of hot spot domains in Fig. 6. The temperature of hot spots on the upper part and bottom part of a pipe measured at 270° was found to be over 30 ℃. As hot spots on the upper part are the same defect domain as that of the rear of a pipe seen on the reflector, the temperature difference between the hot spot domains was supposed to appear as the same values, but the actual temperature was detected as 29.86 ℃.
Such a result seems to be based on the difference between the radiant energy appearing in an actual pipe and the reflected radiant energy and the reflection rate.
The size of a pipe that was quantified through the sizes of an actual pipe and a reflector measured with an infrared thermography camera. When the diameter of an actual pipe is 89.00 mm, the number of pixels was found to be 91. Therefore, the size occupied by a single pixel was measured as 1.02 mm. Moreover, based on 65 pixels occupied by the diameter of a pipe located on the reflector, it was found that the size of a pipe located on the reflector was measured as 0.73 mm per pixel. These values were obtained in a state where the reflector angle was not considered, so there may be a small difference from the actual size.
5. Conclusions
Through this study, it was possible to detect defects through ultrasound infrared thermography using an aluminium reflector, especially when defects existed inside the austenite STS 304 seamless pipe, simulating thermal fatigue cracks occurring in a pipe of a nuclear power plant.
Through the aluminium reflector located at a certain angle in the rear of a pipe, this study could convert defects in the front and rear of the pipe into a single thermography image. it was found that defects existed below the rear part. That is, through the 180° image , which is contrary to the 0° pipe measurement image , it was found that hot spots appearing on the reflector exist as actual hot spots. In addition, by using lock-in technique, this study was able to clearly detect defects appearing as hot spots.
When the surface roughness of an infrared reflector and its numerical reflection angles are calculated, the results of this study will be really useful for actual industrial sites.
Acknowledgements
This work was supported by the Nuclear Research and Development of the Korea Institute
of Energy Technology Evaluation and Planing (KETEP) grant funded by the Korea Government Ministry of Knowledge and Economy.
Reference
[1] G. Buss, D. Wu and W. Karpen, "Thermal wave imaging with phase sensitive modulated thermpgraphy," J. Appl. Phys.
Vol. 71, No. 8, pp. 3962-3965 (1992) [2] M. Rafet, et al., "Assessment of testicular
core temperatures using microwave thermography," Human Reproducion, Vol.
15, No. 8, pp. 1723-1726 (2000)
[3] F. Riegart, Th. Zweschper and G. Busse,
"Eddy-current lock-in thermography: meth- od and its potential," J. phys. IV France, Vol. 125, pp. 587-591 (2005)
[4] A. Dillenz, G. Busse and D. Wu,
"Ultrasound lock-in thermography: feasi- bilities and limitations," SPIE, Vol. 3827, pp. 10-15 (1999)
[5] B. C. Kang, S. M. Kim, J. Y. Choi and G. O. Kim, "A study on infrared emissivity masurement of material surfrace by reflection method," Journal of the KSNT, Vol. 30, No. 5, pp. 483-485 (2010) [6] V. P. Vavilov, "Infrared and thermal
testing: heat transfer," Nondestructive Testing Handbook Series III (3rd Ed), X.
P. V. Maldague, P.O. Moore Ed., pp.
54-86, ASNT, Columbus, USA, (2001) [7] H. S. Park, M. Y. Choi, J. H. Park, S. S.
Lee, Y. H. Huh, B. Y. Lee and J. S.
Kim, "Study on the micro crack detection in joints by ultrasound infrared thermo- graphy," Journal of the KSNT, Vol. 32, No. 2, pp. 162-169 (2012)
[8] KS B 5361:2008 "Emissivity measuring methods for industrial solid materials."
(2008)