Seismic Analysis of Chemical Pump Using Automatic Mesh Generation System
장 현 석* 이 준 성†
Jang, Hyun-Seok Lee, Joon-Seong
···
요 지
본 논문은 자동요소생성 시스템을 이용한 화학적펌프의 지진해석에 대한 내용이다. 전처리시스템을 CAD시스템, 유한요 소 코드와 통합시킨 자동화된 해석시스템은 구조물 최적화 디자인에 효과적으로 사용되어 진다. 해석조건이 수반된 유한요 소모델은 자동적으로 해석모델로 부터 생성되어 진다. 또한, 유한요소모델은 해석코드에 의해 자동적으로 해석되어 진다.
이 통합화된 유한요소 시뮬레이션 시스템의 효용성을 화학펌프와 같은 3차원 복잡구조물에 적용하여 보았다.
핵심용어 : 화학펌프, 자동요소생성, 지진해석
Abstract
This paper describes a seismic analysis of chemical pump using automated mesh generation system. The use of an automated analysis system, involving FE codes together with CAD systems and FE pre- and post-processors, has provided an important step towards shortening the design process and structural optimization. The FE model, which is a FE mesh accompanied with the analysis condition, is automatically converted from the analysis model. The FE models are then automatically analyzed using the FE analysis code. This integrated FE simulation system is applied to an analysis of three-dimensional complex solid structures such as a chemical pump.
Keywords : chemical pump, automatic mesh generation, seismic analysis
···
†책임저자, 정회원․경기대학교 기계시스템공학과 교수 Tel: 031-249-9813 ; Fax: 031-244-6300 E-mail: [email protected]
* 경기대학교 대학원 기계공학과 석사과정
∙이 논문에 대한 토론을 2012년 2월 29일까지 본 학회에 보내주시 면 2012년 4월호에 그 결과를 게재하겠습니다.
1. 서 론
The design of structural component is an iterative process in which the aim is to achieve a structure which has adequate strength and stiffness, and is both practical and economical to manufacture : that is, in some sense, an optimum design. The design procedure can take a very long time if approached conventionally, and it is unlikely that components will in fact be optimized in detail against all impor- tant criteria.
The use of an automated analysis system, invol- ving FE codes together with CAD systems and FE pre- and post-processors, has provided an important
step towards shortening the design process and structural optimization. Of course, to do analysis and design work, various general purpose programs such as Pro/Engineering, I-DEAS, MARC and so on have been used. Using these programs, however, conven- tional analyses of practical structures are still labour-intensive and are not easy for ordinary designers and engineers to perform. Furthermore, it is difficult for them to find a satisfactory or optimized solution of practical structures utilizing such conven- tional tools. A lot of trial and error evaluations are indispensable.
The main reason for this is its high capability of dealing with boundary-value problems in arbitrarily
Fig. 1 Flow of system shaped domains. On the other hand, a mesh used
influences computational accuracy as well as time so significantly that the mesh generation process is as much important as the FEM analysis itself. Espe- cially, in such large scale nonlinear FEM analyses that approach the limitation of computational capability of so-called supercomputers, it is highly demanded to optimize the distribution of mesh size under the condition of limited total degrees of freedom. Particularly, the mesh generation process, which influences computational accuracy as efficiency and whose fully automation is very difficult in three-dimensional cases, has become the most critical issue in a whole process of the FE analyses. In this respect, various researches(Lee, 2002; Shephard, etc., 1991; Sibson, 1997; Cavendish etc., 1985; Lee, etc., 2009) have been performed on the development of automatic mesh generation techniques. However, the technique of finite elements is not often easy to use, because of the problem of formulating the necessary input data for a FE analysis program.
To efficiently support design processes of practical structures, the automatic FE mesh generator(Lee, etc., 2010), which is based on bubble mesh system is integrated with one of commercial FE analysis codes.
2. Outline of System
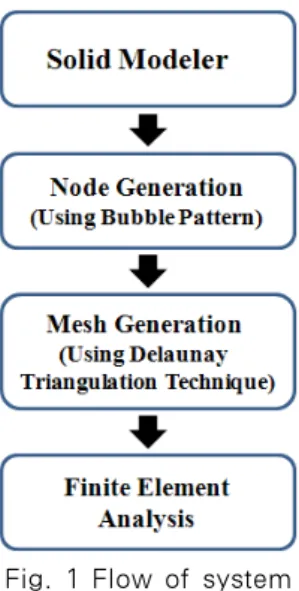
The developed FE simulation system allows designers to evaluate detailed physical behaviors of structures through some simple interactive operations to their geometry models. In other words, designers do not have to deal with mesh data when they operate the system. A flow of analyses using the system is shown in Fig. 1. Each subprocess will be described below.
2.1 Definition of Geometry Model
Geometric modelers are utilized to define geome- tries of analysis domains. One of commercial geometric modelers, Designbase(Chiyokura, 1998) is employed for 3D solid structures. The advantage of Designbase
is that a wide range of solid shapes from polyhedra to free-form surfaces can be designed in a unified manner. In these modelers, 3D geometric data are stored as a tree structure of domain - surfaces (free- form surfaces such as Bezier or Gregory type surfaces) - edge(B-spline or Bezier type curves) - vertices.
Designbase allows the user to start with a hierarchical compositional Constructive Solid Geometry (CSG)-view of a part and then to refine it with local but consistent operations on the boundary repre- sentation of the object.
2.2 Attachment of Material Properties and Boundary Conditions
Material properties and boundary conditions are directly attached onto the geometry model by clicking the loops or edges that are parts of the geometric model using a mouse, and then by inputting actual values. The boundary conditions of the present system accept Direchlet's and Neumann's type. This system allows the user to enter mechanical loads in various forms for stress analysis.
2.3 Node Generation Using Bubble Packing
The key element of bubble meshing lies in the first step, that is, the optimization of mesh node locations by close packing bubbles. By this method, bubbles move in a domain until forces between them are
(a) Vertex bubbles (b) Edge bubbles
(c) Loop bubbles (d) Final mesh Fig. 2 Bubble mesh procedure
Small Medium Large
1.0
0.0
1.00 1.02 1.05 1.08 1.10 p 0.00 0.02 0.03 0.04 0.08 q Fig. 3 Membership functions of lables of Ai(p) and
Bi(q)
stabilized, and Delaunay triangulation is then applied to generate a mesh connecting the nodes defined by the bubble packing. A repulsive or attractive force much like an intermolecular van der Waals force is assumed to exist between two adjacent bubbles. A globally stable configuration of tightly packed bubbles is determined by solving the equation of motion. The novelty of this method is that the close packing of bubbles forms a pattern of Voronoi polygons, corresponding to well-shaped Delaunay triangles. Fig. 2 shows the procedure of the bubble packing method. Bubble meshing generates a two- dimensional triangular mesh (a) solving the equation of motion on vertices, edges, and faces(or loops), in that order, and (b) generating a triangular mesh by connecting the center points of the bubbles by Delaunay triangulation. Similar steps are applied to the generation of three-dimensional tetrahedral meshes.
In this procedure, the mesh density is needed in order to determine the radius of the bubbles. To handle general bubble spacing, we adopted bubble density distribution function.
2.4 Fuzzy Control of Node Position
The fuzzy rules employed here can be generalized as :
RULEi : IF p is Ai , THEN q is Bi
where RULEi is the i-th fuzzy rule, Ai and Bi the fuzzy variables, p the value of node, and △p the difference of the current and the next values of p, i.e.
|p(n+1)-p(n)|(n : the iteration number of node), respectively. The labels of the fuzzy variables are defined as follows.
As for Ai,
LARGE → p is much larger than 1.0.
MEDIUM → p is larger than 1.0.
SMALL → p is little larger than 1.0.
As for Bi,
LARGE → q is positive and large.
MEDIUM → q is positive and medium.
SMALL → q is positive and small.
As shown in Fig. 3, trapezoid type membership functions are utilized as those of lables of Ai and Bi from the viewpoint of simplicity.
2.5 Mesh Generation
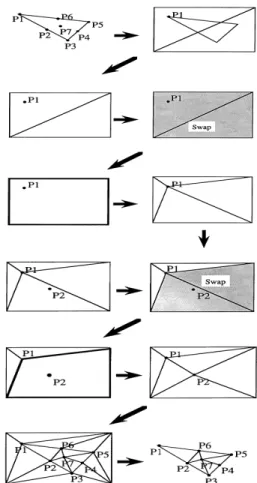
The Delaunay triangulation method(Lee, 2002; Lo, 1991; Shephard, etc., 1991; Sibson, 1997) is utilized to generate tetrahedral elements from numerous nodes given in a geometry.
Let N be a set of nodes, it has the property that the circumcircle of any triangle in the triangulation contains no point of N in its interior. The remaining points in N will be iteratively added to the triangulation. After each point is added, it will be
Fig. 5 Figure of the pump
Fig. 6 Mesh generation for the FEM model Fig. 4 Example showing a Delaunay triangulation
connected to the vertices of its enclosing triangle(See Fig. 4). All internal edges of a triangulation of a finite set N are locally optimal if no point of N is interior to any circumcircle of a triangle.
2.6 Preparation of input data
Through the interactive operations mentioned in section 2.2 and 2.3, an user designates material properties and boundary conditions onto the geometry model. Then these are automatically attached on nodes, edges, faces and volume of elements. Such automatic conversion can be performed owing to the special data structure of finite elements such that each part of element knows which geometry part it belongs to. Finally, a complete FE model consisting of mesh, material properties and boundary conditions is obtained.
3. Results of Seismic Analysis
The seismic analysis was performed to demonstrate the structural integrity of the chemical pump. The coordinate system relationship between the seismic analysis and safety related geometry is shown in Table 1. Modal analysis was performed to find the natural frequencies and mode shapes of the pump.
Geometry Seismic Analysis
Side-to-Side Direction X
Front-to-Back Direction Y
Vertical Direction Z
Table 1 Coordinate system definition
3.1 Modeling
A FEM model of the subject equipment was made by using elastic solid(SOLID 185) and mass(MASS 21) elements.
The modeling figures for the pump are shown in Fig. 5.
For the boundary conditions, the bolting conditions of the pump basement bolting positions were constrained to all translational (, , ) during the analysis process. Motor and other equipments
Fig. 7 Mode I
Fig. 8 Mode IV
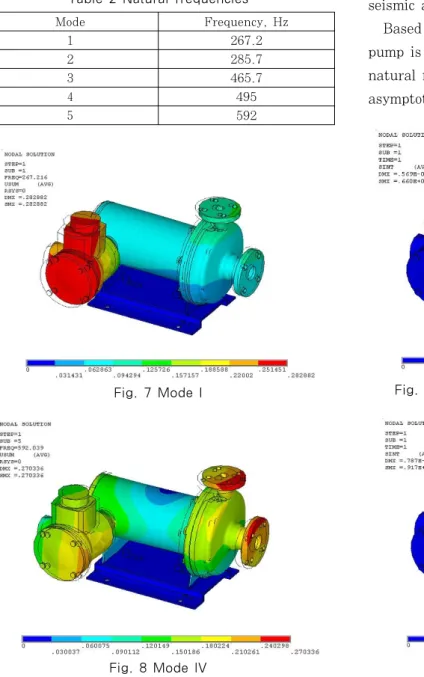
Mode Frequency, Hz
1 267.2
2 285.7
3 465.7
4 495
5 592
Table 2 Natural frequencies
Fig. 9 Stress Distribution at Normal Condition
Fig. 10 Stress Distribution at SSE were considered as lumped masses.
Fig. 6 shows an example of FE mesh for pump.
3.2 Modal Analysis
The modal analysis was performed to determine the natural frequencies and the mode shapes of the subject pump for the undamped case.
The mode extraction method used in the analysis is Block Lanczos. The Block Lanczos method is appro- priate to solve large model with many constraint equations. This method is applicable to the type of problems which is solved by using the subspace
eigenvalue method at a faster convergence rate.
The natural frequencies of the FEM model based on the modal analysis in seismic range were deter- mined and are summarized in Table 2. Also, the analysis results for Mode I and IV show the Figs. 7 and 8.
3.3 Equivalent Static Analysis
The acceleration of gravity was applied to make pre-stress effect caused by dead weight and operation loads including nozzle loads on the FEM model.
These pre-stress results shall be absolutely summed with the results of the following equivalent static seismic analysis.
Based on the results of section 3.2, the subject pump is considered as rigid because its fundamental natural frequency is greater than the high frequency asymptote or the cutoff frequency and does not exist
in seismic range. thus, it is justifying the use of an equivalent static analysis.
Because the subject pump is considered to be supported by rigid structure, the motion of the pump shall be the same as the support motion without amplification. The horizontal and vertical dynamic accelerations are taken as the zero period accelera- tion(ZPA) from RRS.
The ZPA obtained from the RRS is applied to the FEM model to perform an equivalent static analysis including dead weight.
The seismic loads including dead weight multiplied by applicable g levels, were applied simultaneously through the subject pump's FEM model. The acceleration to be used is obtained by multiplying the g values corresponding to ZPA of the applicable required response spectra(RRS) by 1.5.
Analysis result of stress distribution at normal condition shows the Fig. 9. Also, stress distribution at SSE shows the Fig. 10.
4. Conclusions
A novel automatic mesh generation system for large scale complex structures was developed. The effective of the present system is demonstrated through a chemical pump.
The mode frequency analysis results show that the fundamental natural frequency is greater than the cutoff frequency of the required response spectra (RRS) and does not exist in seismic range, thus justifying the use of an equivalent static analysis.
Therefore, detailed dynamic analysis is not required for the subject pump.
References
Cavendish, J.C. et al. (1985) An Approach to Automatic Three-Dimensional Finite Element Mesh Generation, International Journal for Numerical Methods in Engineering, 21, pp.329~347.
Chiyokura, H. (1998) Solid Modeling with Design- base: Theory and Implementation, Addition-Wesley.
Lee, J.S. (2002) Development of the Fuzzy-Based System for Stress Intensity Factor Analysis, Int.
Journal of Fuzzy Logic and Intelligent Systems, 12(3), pp.255~260.
Lee J.S., Lee, H.J. (2010) An Automated CAE System for Multidisciplinary Structural Design: Its Application to Micro Accelerometer, Journal of Mechanical Science and Technology, 24(9), pp.1875
~1883.
Lee, J.S., Shioya, R., Lee, E.C., Lee, Y.C. (2009) Parallel Finite Element Analysis System Based on Domain Decomposition Method, J. of the Com- putational Structural Engineering Institute of Korea, 22(1), pp.35~44.
Lo, S.H. (1991) Automatic Mesh Generation and Adaptation by Using Contours, Int. J. for Numerical Methods in Eng., 31, pp.689~707.
Shephard, M.S., Georges, M.K. (1991) Automatic Three-Dimensional Mesh Generation by Finite Octree Technique, International Journal for Numerical Methods in Engineering, 32, pp.709~749.
Sibson, R. (1997) Locally Equiangular Triangulations, The Computer Journal, 21, pp.243~245.
논문접수일 2011년 10월 28일 논문심사일
1차 2011년 11월 8일 2차 2011년 11월 28일 게재확정일 2011년 12월 3일