The Simulation of Pore Size Distribution from Unsaturated Hydraulic Conductivity Data Using the Hydraulic Functions
Young-Man Yoon*, Jeong-Gyu Kim1, and Kook-Sik Shin2
Biogas Research Center, Hankyong National University, Anseong 456-749, Korea
1College of Life Science and Biotechnology, Korea University, Seoul 136-713, Korea
2College of Agriculture and Life Science, Hankyong National University, Anseong 456-749, Korea
Until now, the pore size distribution, PSD, of soil profile has been calculated from soil moisture characteristic data by water release method or mercury porosimetry using the capillary rise equation. But the current methods are often difficult to use and time consuming. Thus, in this work, theoretical framework for an easy and fast technique was suggested to estimate the PSD from unsaturated hydraulic conductivity data in an undisturbed field soil profile. In this study, unsaturated hydraulic conductivity data were collected and simulated by the variation of soil parameters in the given boundary conditions (Brooks and Corey soil parameters, = 1 - 5 L-1, = 1 - 10; van Genuchten soil parameters, = 0.001 - 1.0 L-1, = 0.1 - 0.9).
Then, (1.0 cm h-1) was used as the fixed input parameter for the simulation of each models. The PSDs were estimated from the collected data by model simulation. In the simulation of Brooks-Corey parameter, the saturated hydraulic conductivity, , played a role of scaling factor for unsaturated hydraulic conductivity,
. Changes of parameter explained the shape of PSD curve of soil intimately, and a affected on the sensitivity of PSD curve. In the case of van Genuchten model, and played the role of scaling factor for a vertical axis and a horizontal axis, respectively. Parameter described the shape of PSD curve and
systematically. This study suggests that the new theoretical technique can be applied to the in situ prediction of PSD in undisturbed field soil.
Key words: Soil pore size distribution, Hydraulic conductivity, Matric potential, Soil moisture characteristic curve, Simulation
Received : August 2. 2010 Accepted : August 18. 2010
*Corresponding author : Phone: +82316705335 E-mail: [email protected]
Introduction
Hydraulic properties such as soil moisture characteristics curve (SMCC) and pore size distribution (PSD) are very important for the interpretation of soil physical characteristics and for the management of agricultural practices. The relationships between soil water content and water tension or infiltration rate are used to describe water flow in soil commonly. The hydraulic conductivity of a soil is affected by soil structure and pore size distribution. In the comprehension of soil hydraulic properties, the relationships of the hydraulic conductivity and water content, , and of the matric potential and the water content, , are very important.
Especially can be used to predict and pore size distribution in soil is characterized from its soil moisture
characteristics curve, indirectly (Childs, 1969). The measurement of is very difficult and time consuming.
Therefore many researches that utilize physical and empirical relation between hydraulic properties and other soil parameters have been studied. As an alternative to measurements, pedo-transfer functions have predicted water retention characteristics and hydraulic properties from the input variables that could be measured more easily such as soil texture, bulk density, or other soil variables (Rawls and Brakensiek, 1985; Ahuja et al., 1989; Vereecken et al., 1989, Saxton et al., 1986).
Recent development and application of tension disc infiltrometer (Ankeny et al., 1988; Perroux and White, 1988) has provided a simple, fast, and in situ method measuring infiltration rate. Tension disc infiltrometer is useful instrument that offer estimating methods of soil hydraulic properties at the soil surface. The most widely used method based on tension disc infiltrometer measurement is the Wooding’s (1968) solution of approximate steady-state
water flow from a surface circular source. Other methods include the determination of sorptivity, macroscopic capillary length (White et al., 1992) and the numerical inversion (Vogeler et al., 1996). Reynolds and Elrick (1991) have attempted to assess the accuracy of soil hydraulic parameters estimated with tension infiltrometer using Wooding’s approximate solution. They have reported that the estimated values of hydraulic conductivity from saturated soil were found to be 5 to about 300% of comparing to numerical simulation or other laboratory methods. But despite of large variation, it was thought that the measurement of unsaturated hydraulic conductivity by tension infiltrometer was useful since the other methods were not available in direct field measurement or needed to further validate the estimating technique (White and Perroux, 1989; Ankney et al., 1991).
Soil pores are very difficult to observe and characterize, bearing that the pore networks are complex 3-dimensional structure in variety of size, shape, connectivity. Burdine (1953) and Mualem (1976) have reported the pore size distribution models that were inferred from water retention characteristic making assumptions of pore continuity and connectivity. But the advanced analyzing of soil structure are very expensive and time consuming.
A few researchers, such as Everts and Kanwar (1993), Timlin et al. (1994), and Logsdon et al. (1993) have interpreted the relationship of soil pore size distribution and water flow using tension infiltrometer data without any quantification of the soil pore size distribution.
Recently, Yoon et al. (2007) have attempted to estimate the characteristics of soil water retention and pore size distribution using tension infiltrometer data.
Goal of this research is to propose a simple theoretical approach to estimate pore size distribution from soil unsaturated hydraulic conductivity data using the tension disc infiltrometer technique that may provide a simple, rapid, and accurate soil hydraulic conductivity measurement.
In order to investigate the feasibility of this theoretical approach, two hydraulic conductivity functions of Brooks and Corey (1964) and van Genuchten (1980) were adjusted, through the proposed theoretical approach, pore size distributions were simulated from unsaturated hydraulic conductivity data in each hydraulic function.
Materials and methods
Brooks and Corey model Using a multiple regression analysis on soil water retention data, Campbell (1974)
developed the equation to describe water retention as follows;
(Eq. 1) where, is the volume wetness (L3 L-3), is the saturated volume wetness (L3 L-3), is the matric potential (L), is the air-entry potential (L) of soil, and is Campbell’s water retention parameter. Similar to the prediction of unsaturated soil hydraulic conductivity () as proposed by Brooks and Corey (1966), the hydraulic conductivity function was proposed as
(Eq. 2) where, is the saturated hydraulic conductivity (L T-1).By assuming that the effect of residual volumetric water content is negligible (i. e., )>> or ≅0), the effective saturation (, L3 L-3) would be equal to
/ and thus can be expressed in terms of matric potential as follows;
≅
(Eq. 3)
By rearranging Eq. 1, the effective saturation will be given as
(Eq. 4)
where, is the reverse of an air entry potential (-1, L-1). Through substitution of Eq. 4 into Eq. 2, the relationship between and can be obtained as follows;
(Eq. 5)
van Genuchten model The hydraulic conductivity function of van Genuchten (1980) was known to perform better to predict a soil hydraulic properties. These functions were usually written as
(Eq. 6) where is the scaled water content (-), is thesaturated hydraulic conductivity (L T-1), and indicate the residual and saturated water contents (L3 L-3), respectively, is a pore connectivity parameter (-), and
(-) and ( ) (-) are empirical parameters. The pore connectivity parameter in the hydraulic conductivity function was estimated by Mualem (1976) to be 0.5 as an average for most soils.
The effective saturation by van Genuchten soil model will be given as
≅
(Eq. 7)
and van Genuchten soil parameters were confined as follows;
0<<1
where (L-1) is the empirical parameter and is the air-entry potential (L) of soil. Through substitution of Eq.
7 into Eq. 6, the relationship between and can be obtained as follows;
(Eq. 8)
Estimation of PSD from unsaturated hydraulic conductivity data The soil moisture characteristic curve is the plot versus . The effective water saturation () is equivalent to the fraction of total pore space filled with water (), which can be obtained by inputting the values of and into Eq. 4 in the case of Brooks and Corey model. Therefore, soil moisture characteristic curve (SMCC, ) can be obtained by multiplying the effective water saturation by soil porosity (, which was equal to );
× × (Eq. 9)
In the similar manner, soil moisture characteristic curve (SMCC, ) can be obtained using the van Genuchten soil model as follows;
× ×
(Eq. 10)
In addition, the effective water saturation () is the fraction of accumulative volume of a water filled soil pores as a function of . Upon assuming that the pores were capillary tube shape and the contact angle of water to pore to be zero, the largest water filled soil pore with a radius () at given matric pressure could be expressed by applying well known capillary equation;
(Eq. 11)
where, is the surface tension (kg sec-2) of water, is the density of water (kg m-3), and is the gravitational acceleration (9.81 m sec-2). The cumulative fraction of pore space filled with water, therefore, can be plotted with respect to soil pore size by plugging Eq. 11 into Eq. 3 and Eq. 7 for Brooks and Corey model and van Genuchten model, respectively.
Simulation of PSD In each models, unsaturated hydraulic conductivity data were collected and simulated by the variation of soil parameters in the given boundary conditions (Brooks and Corey soil parameters, = 1 - 5 L-1, = 1 - 10; van Genuchten soil parameters, = 0.001 - 1.0 L-1, = 0.1 - 0.9). Then, (1.0 cm h-1) was used as the fixed input parameter for the simulation of each models.
This fixed value of 1.0 cm h-1 was within the range of in sandy loam or sandy clay loam soils. The PSDs were estimated from the collected data by model simulation using the Eq. 10 and Eq 11 for Brooks and Corey model and van Genuchten model, respectively.
Results and Discussion
Simulation of PSD by Brooks-Corey parameters The Eq. 5 ( ) was the function that explains the relationship of unsaturated hydraulic conductivity () and hydraulic pressure head (). In Eq. 5 the role of has been easily understood as the scaling factor of
. The effects of and on were more complex.
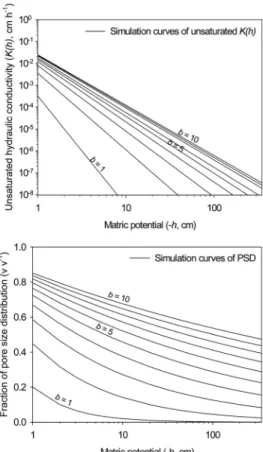
Figure 1 and 2 showed the effects on PSD and by the variation of when was 1.0, and 5.0, respectively.
Figure 3 and 4 showed the effects on PSD and by the variation of when was 1.0, and 5.0, respectively. In the changes of Brooks-Corey soil parameters, data points were plotted on a log-log scale in relationship between K(h) and pressure head () as the declined straight lines in
Fig. 1. The effect on PSD and unsaturated hydraulic conductivity, , of the variations in parameter in Eq. 5. Straight lines indicate the simulation curves of PSD and when the is 1.0 cm h-1, and the
is 1.0 cm-1.
Fig. 2. The effect on PSD and unsaturated hydraulic conductivity, , of the variations in parameter in Eq. 5. Straight lines indicate the simulation curves of PSD and when the is 1.0 cm h-1, and the is 5.0 cm-1.
decreasing of . Low led to a stronger reduction in the simulations of PSD and , but the effect on of was more meager than that of . The reduction of PSD and also showed a same tendency successively in the sequential variation of soil parameter . Campbell (1974) has defined the soil parameter as PSD factor in hydraulic function (Eq. 5). In the simulated curves of PSD by , the variation of parameter caused the high variations on PSD.
Nachabe (1996) has reported that small variation of soil parameter did not affect the infiltration rate significantly in the research of shape factor modeling the infiltration rate. In this study, The small variation in gave a small effect for , too.
Low caused a strong reduction in apparently but gave a little effect for the reduction of PSD. Variation of was enough to explain the curve shape of PSD in a full range of pore space. Parameter was closely concerned with PSD and affected on the sensitivity of . The
may not express the PSD of variable textured soils directly.
Nachabe (1996) reported that the shape factor, , could not be measured directly in the field, also, was difficult
to estimate accurately because it varied within a narrow range, and it involved many other soil parameters. White and Sully (1987) suggested that the using of setting value ( = 0.55) was practical for most field. But the suggestion of White and Sully (1987) was not proper to estimate PSD from measured data set, because soil parameter was strongly related with the shape of PSD curve. The opinion that the using = 0.55 was practical for most field was possible when parameterization procedure was simplified in the estimation of for field soils.
In the adjustment of Brooks and Corey model for the simulation of PSD and unsaturated , pore volume fractions and hydraulic conductivity might be overestimated at high pressure head. It was thought that overestimation was resulted from the nature of Brooks-Corey hydrological model adopting exponential type function, and was seem to be increased exponentially in high water content.
It has been reported that developed model to describe hydraulic properties in homogeneous porous media cannot account for significant impact of the structural pores on water retention and hydraulic conductivity close to saturation
Fig. 3. The effect on PSD and unsaturated hydraulic conductivity, , of the variations in in Eq. 5.
Straight lines indicate the simulation curves of PSD and
when the is 1.0 cm h-1, and the is 1.0.
Fig. 4. The effect on PSD and unsaturated hydraulic conductivity, , of the variations in in Eq. 5.
Straight lines indicate the simulation curves of PSD and
when the is 1.0 cm h-1, and the is 5.0.
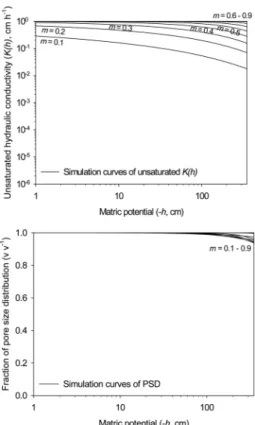
Fig. 5. The effect on PSD and unsaturated hydraulic conductivity, , of the variations in parameter in Eq. 8. Straight lines indicate the simulation curves of PSD and when the is 1.0 cm h-1, and the is 0.001 cm-1.
(Mualem, 1976; van Genuchten, 1980). Since Brooks-Corey hydrological model is assuming soil matrix as homogeneous media, the prediction of PSD in saturated condition may be difficult. In recently for further improvement of hydraulic conductivity two or multi-domain models have been proposed (Smettem and Kirkby, 1990; Othmer et al., 1991;
Durner, 1992; Ross and Smettem, 1993). To characterize PSD in saturated condition more correctly, it is possible to adopt recent works such as multi-domain model in the estimation model of pore size distribution.
Simulation of PSD by van Genuchten soil parameter The Eq. 8 is the relationship between and hydraulic pressure head () from the van Genuchten model. In order to understand the shape variation of PSD and
according to changes of van Genuchten soil parameters ( ), simulation data in variation of and were plotted in Fig. 5, 6, and 7. In simulation of PSD and
, and played the role of scaling factors about a vertical axis and a horizontal axis. The is a soil parameter which describes systematically the shape sensitivity of PSD curves and . The systematic
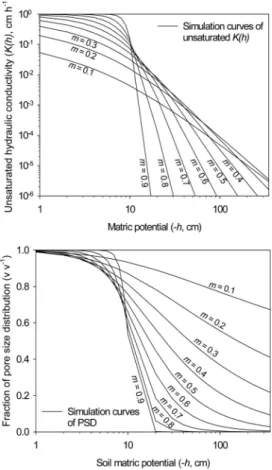
Fig. 6. The effect on PSD and unsaturated hydraulic conductivity, , of the variations in parameter in Eq. 8. Straight lines indicate the simulation curves of PSD and when the is 1.0 cm h-1, and the is 0.01 cm-1.
Fig. 7. The effect on PSD and unsaturated hydraulic conductivity, , of the variations in parameter in Eq. 8. Straight lines indicate the simulation curves of PSD and when the is 1.0 cm h-1, and the
is 0.1 cm-1. scheme of simulation curves may be caused by the closed
boundary condition of equation variables. The hydrological model of van Genuchten has included some constraints as closed form equation (van Genuchten, 1980). Schaap and Leij (2000) imposed the following constraints during the optimization to avoid fitted parameters with unreasonable values, 0.0001 < < 1.000 cm-1, 1.0001 < < 10 ( = 1/(1-)).
The van Genuchten hydrological model may explain PSD and in near saturated condition as shown in simulation results. But Schaap and Leij (2000) reported that prediction of was physically unrealistic but it occasionally occurred while fitting van Genuchten’s hydrological model equation because of random or systematic errors in unsaturated conductivity data.
In this simulation results we can confirm the reversion of having one breakpoint by variations in on the
in Eq. 8. And Fig. 6 and 7 showed the reversion range below the breakpoint during the simulation of . In reversion of , reduction of total pore space in
variation of may lead to more enhanced . This effect may be physically unrealistic but imply theoretical concept.
Also Nachabe (1996) has reported that the and of Brooks and Corey model and and of van Genuchten model had physical implications, but that in van Genuchten model had no physical meaning, because estimation of by the van Genuchten model could have several fit. van Genuchten and Nielson (1985) and Luckner et al. (1989) have argued that might not be especially suitable matching point because was sensitive to macro- pore flow. However, the was used with matching point for the estimation of other parameters since it could be measured in a simple experiment commonly. But the use of measured might be not always correct in parameter estimation procedure, because a measured was determined apart from the determining of in field. In the procedure of van Genuchten parameter estimation for the estimation of PSD, the using of as matching point may mislead reasonable parameter estimation.
Conclusion
In the simulation of Brooks-Corey parameter, the played a role of scaling factor for . Changes of parameter explained the shape of PSD curve of soil intimately, and a affected on the sensitivity of PSD curve. In the case of van Genuchten model, and
played the role of scaling factor for a vertical axis and a horizontal axis, respectively. Parameter described the shape of PSD curve and systematically.
References
Ahuja, L.R., D.K. Cassel, R.R. Bruce, and B.B. Barnes. 1989.
Evaluation of spatial distribution of hydraulic conductivity using effective porosity data. J. Soil Sci. 148:404-411.
Ankeny, M.D., M. Ahmed, T.C. Kaspar, and R. Horton. 1991.
Simple field method for determining unsaturated hydraulic conductivity. Soil Sci. Soc. Am. J. 55:467-470.
Ankeny, M.D., T.C. Kaspar, and R. Horton. 1988. Design for an automated tension infiltrometer. Soil Sci. Soc. Am. J.
52:893-895.
Brooks, R.H. and A.T. Corey. 1964. Hydraulic properties of porous media. Hydrology Paper no. 3, Civil Engineering Dep., Colorado State Univ., Fort Collins, CO, USA.
Brooks, R.H. and A.T. Corey. 1966. Properties of porous media affecting fluid flow. J. Irrig. Drain. Dic. Am. Soc. Civ. Eng.
92:61-88.
Burdine, N.T. 1953. Relative permeability calculations from PSD data. Trans. AIME 198:71-77.
Campbell, G.S. 1974. A simple method for determining unsaturated conductivity from moisture retention data. J. Soil Sci. 117:
311-314.
Childs, E.C. 1969. An introduction to the physical basis of soil water phenomena. London: Willey-Interscience.
Durner, W. 1992. Predicting the unsaturated hydraulic conductivity using multi-porosity water retention curves. pp.185-202. In van Genuchten, M.Th. et al. (ed.) Indirect methods for estimating the hydraulic properties of unsaturated soils.
Univ. of California, Riverside.
Everts, C.J. and R.S Kanwar. 1993. Interpreting tension- infiltrometer data for quantifying soil macropores: Some particle considerations. Trans. ASAE 36(2):423-428.
Logsdon, S.D., E.L. McCoy, R.R. Allmaras, and D.R. Linden.
1993. Macropore characterization by indirect methods. J.
Soil Sci. 155: 316-324.
Luckner, L., M.Th. van Genuchten, and D.R. Nielsen. 1989.
A consistent set of parametric models for the two-phase flow of immiscible fluids in the subsurface. Water Resour. Res.
25:2187-2193.
Mualem, Y. 1976. A new model predicting the hydraulic conductivity of unsaturated porous media. Water Resour.
Res. 12:513-522.
Nachabe, M.H. 1996. Macroscopic capillary length, sorptivity, and shape factor in modeling the infiltration rate. Soil Sci.
Soc. Am. J. 60:957-962.
Othmer, H., B. Diekkrüger, and M. Kutillek. 1991. Bimodal porosity and unsaturated hydraulic conductivity. J. Soil Sci.
152:139-150.
Perroux, K.M. and I. White. 1988. Designs for disc permeameters.
Soil Sci. Soc. Am. J. 52:1205-1215.
Rawls, W.J. and D.L. Brakensiek. 1985. Prediction of soil water properties for hydrologic modeling. p.293-299. In Jones, E.B.
and T.J. Ward. (ed.) Watershed management in the eighties.
Proc. Irrig. Drain. div., ASCE, Denver, CO. 30 April-1 May 1985. Am. Soc. Civil Eng., New York, NY, USA.
Reynolds, W.D. and D.E. Elrick. 1991. Determination of hydraulic conductivity using a tension infiltrometer. Soil Sci. Soc.
Am. J. 55:633-639.
Ross, P.J. and K.R.J. Smettem. 1993. Describing soil hydraulic properties with sums of simple functions. Soil Sci. Soc.
Am. J. 57:26-29.
Saxton, K.E., W.J. Rawls, J.S. Romberger, and R.I. Papendick.
1986. Estimation generalized soil-water characteristics from texture. Soil Sci. Soc. Am. J. 50:1031-1036.
Schaap, M.G. and F.J. Leij. 2000. Improved prediction of unsaturated hydraulic conductivity with the Mualem-van Grnuchten model. Soil Sci. Soc. Am. J. 64:843-851.
Smetten, K.R.J. and C. Kirkby. 1990. Measuring the hydraulic properties of a stable aggregated soil. J. Hydrol. 17:1-13.
Timlin, D.J., L.R. Ahuja, and M.D. Ankeny. 1994. Comparison of three field methods to characterize apparent macropore conductivity. Soil Sci. Soc. Am. J. 58:278-284.
van Genuchten, M.Th. 1980. A closed form equation for predicting the hydraulic conductivity of unsaturated soils.
Soil Sci. Soc. Am. J. 44:892-898.
van Genuchten, M.Th. and D.R. Nielsen. 1985. On describing and predicting the hydraulic properties of unsaturated soils.
Ann. Geophysicae 3:615-628.
Vogeler, I., B.E. Clothier, S.R. Green, D.R. Scotter, and R.W.
Tillman. 1996. Characterizing water and solute movement by time domain reflectometry and disk permeametry. Soil Sci. Soc. Am. J. 60:5-12.
White, I. and K.M. Perroux. 1989. Estimation of unsaturated hydraulic conductivity from field sorptivity measurements.
Soil Sci. Soc. Am. J. 53:324-329.
White, I. and M.J. Sully. 1987. Macroscopic and microscopic capillary length and time scales from field infiltration. Water Resour. Res. 23:1514-1522.
White, I., M.J. Sully, and K.M. Perroux. 1992. Measurement of surface soil hydraulic properties: Disk permeameters, tension infiltrometers, and other techniques. p.69-103. In Topp et al.(ed.) Advances in measurement of soil physical properties: Bringing theory into practice. SSSA Spec. Publ.
30. SSSA, Madison, WI.
Wooding, R.A. 1968. Steady infiltration from a shallow circular pond. Water Resour. Res. 4:1259-1273.
Yoon, Y., J.G. Kim, and S. Hyun. 2007. Estimating soil water retention in a selected range of soil pores using tension disc infiltrometer. Soil Till. Res. 97:107-116.
토양 수리학적 함수를 이용한 불포화 수리전도도로부터 공극크기분포의 모사
윤영만*·김정규1·신국식2
한경대학교 바이오가스연구센터, 1고려대학교 생명과학대학, 2한경대학교 농업생명과학대학
토양의 공극 크기별 분포는 토양중 수분의 함량과 수분퍼텐셜의 관계를 나타내는 토양수분특성 자료로부터 계산된다. 그러나 기존의 토양수분특성 측정방법들은 교란된 토양을 이용하거나 코어시료를 채취한다 하여도 동역학적으로 변화하는 현장 토양 공극분포를 반영하는 데는 많은 어려움이 있었다. 또한 이러한 토양수분특성 자료를 얻기 위해서는 많은 시간과 노력이 요 구되어 왔다. 따라서 본 연구에서는 교란되지 않은 현장 토양에서 측정한 불포화 수리전도도 자료로부터 토양의 공극 크기별 분포 곡선을 추정하는 이론적 체계를 제시하고자 하였다. 이를 위해 Brooks-Corey와 van Genuchten의 수리학적 모델을 이용하여 토양의 불포화 수리전도도 자료로부터 공극의 크기별 분포를 추정하는 이론적 모델을 전개하였으며, 이러한 이론적 모델에 근거하여 Brooks-Corey와 van Genuchten의 soil parameter들의 변화에 따른 불포화수리전도도와 공극 크기별 분포곡선의 모사하였다. 공극크기별 분포곡선의 모사는 토성별 불포화수리전도도 곡선의 scaling factor 역할을 하는 를 1.0 cm h-1로 설정하고, 수리학적 모델별로 일정한 경계조건 (Brooks-Corey soil parameters, = 1 - 5 L-1, = 1 - 10;
van Genuchten soil parameters, = 0.001 - 1.0 L-1, = 0.1 - 0.9)에서 수행하였다. Brooks-Corey 모델을 이용한 공극 크기별 분포곡선의 모사에서는 parameter 가 공극분포곡선의 형태에 영향을 주었으며, 는 공극분포곡선의 민감 도에 영향을 주었다. 또 van Genuchten 모델을 이용한 공극 크기별 분포곡선의 모사에서는 가 scaling factor의 역할을
하였으며, parameter 은 공극분포곡선의 형태에 영향을 주었다. 따라서 경계조건 안에서 불포화 수리전도도 자료로부터
공극의 크기별 분포 모사가 가능하였으며, 토양 parameter들이 토성, 입자분포 등의 물리적 특성을 잘 반영하는 경우 이론 적으로 현장 토양의 공극 크기별 분포의 추정이 가능할 것으로 판단되었다.