Introduction
Knowledge about the soil hydraulic properties is essential for simulating the movement of water and solutes in soils. A broad array of methods currently exists to determine soil hydraulic conductivity properties in the field or in the laboratory (Klute, 1986; Zang et al., 2007).
Field methods allow for in-situ determination of the hydraulic properties but have uncertainties about the actual sample volume. Laboratory measurements require more sample preparation but allow a larger number of measurements and a better control of the experimental conditions. Most laboratory and field techniques, however, have specific ranges of applicability with respect to soil type and saturation. Another limitation of
direct measurements is they are generally quite cumbersome and require a substantial investment in both of time and money. So, large number of indirect methods to generate soil hydraulic properties has been developed.
Pore-size distribution models have been used very often to estimate the unsaturated hydraulic conductivity from the distribution, connectivity and tortuosity of pores. The pore-size distribution can be inferred from the water retention curves, which is normally much easier to measure than the unsaturated hydraulic conductivity function. The hydraulic models of van Genuchten (1980) and Campbell (1974), often used in many water and solute simulation models, belong to the pore-size distribution models. To enhance accuracy of water and solute transport prediction, the hydraulic models need to be tested by the measured unsaturated hydraulic conductivity. Tempe pressure cell is one of apparatus for
Received : May 12. 2008 Accepted : July 27. 2008*Corresponding author: Phone : +822900271, E-mail : [email protected]
Unsaturated Hydraulic Conductivity Functions of van Genuchten's and Campbell's models Tested by One-step Outflow Method through Tempe
Pressure Cell
Kyung-Hwa Han,
*Hee-Myong Ro
1, Hyun-Jun Cho, Lee-Yul Kim, Seon-Woong Hwang, Hee-Rae Cho, and Kwan-Cheol Song
National Institute of Agricultural Science and Technology, Suwon, 441-707
1
Graduate School of Agricultural Biotechnology, Seoul National University, Seoul 152-742
This study was carried out in order to test unsaturated hydraulic conductivity estimation of van Genuchten's and Campbell's models using one-step outflow method through Tempe pressure cell. The undisturbed soil cores (columns) were taken from Ap1, B1 and C horizons of Songjeong series (the fine loamy, mesic family of Typic Hapludults). After the saturated hydraulic conductivity Ks of the cores was determined by constant head method, water outflow rate and retentivity of cores were measured in Tempe pressure cell. Fitted curves by models accorded to measured data except for both end of pressure range. In near-saturated condition, measured water retention characteristics showed a relatively better fitness with Campbell's model than van Genuchten's. The soil unsaturated conductivity estimated by Campbell's model was higher than by van Genuchten's. In Ap1 and B1 horizon, the soil unsaturated conductivities obtained by one-step outflow method went between van Genuchten's and Campbell's hydraulic functions, slightly closer to van Genuchten's. In C horizon, van Genuchten's model had better fitness with the one-step outflow data. Consequently, van Genuchten's model generally had better fitness with measured hydraulic conductivity than Campbell's model at the soil water potential range of -10~-75 kPa, especially in C1 horizon. In near-saturated condition, Campbell's model could be thought as relatively accurate hydraulic model, because of the better fitness of Campbell's model with soil water retention data than van Genuchten's model.
Key words : Unsaturated hydraulic conductivity, van Genuchten's model, Campbell's model, One-step outflow
method
measuring water retention curves and simultaneously able to measure unsaturated hydraulic conductivity through one-step outflow method, checking the rate of water outflow during each pressure step. This study, therefore, was conducted in order to test unsaturated hydraulic conductivity estimation of van Genuchten's and Campbell's models using one-step outflow method
Materials and Methods
Soil sampling and characteristics Undisturbed soil core samples were collected from Ap1, B1, and C horizon of Sonjeong series (the fine loamy, mesic family of Typic Hapludults) located in Apple research orchard field, College of Agriculture and Life science, Seoul National University, in Suwon. Ap1 (0 - 17 cm) horizon is brown to dark brown (7.5YR 4/4) fine gravelly sandy clay loam; moderate fine granular structure; friable, slightly sticky and slightly plastic; common fine quartz;
many fine grass and tree roots; abrupt smooth boundary, B1 (17 - 55 cm) is yellowish red (7.5YR 5/6) fine gravelly sandy clay loam; weak fine to medium subangular blocky structure; thin patch clay cutan;
friable, slightly sticky and slightly plastic; common fine mica and common fine quartz; many fine grass roots;
clear smooth boundary, and C horizon (79 - 120 cm) is reddish yellow (7.5YR 7/6) sandy loam; granite saprolite;
firm, nonsticky and nonplastic; many fine quartz grits;
few coarse roots.
The soil samples were sealed to prevent drying and were kept in temperature-controlled room at 4
℃to inhibit biological activity.
Soil cores (diameter, 5.4 cm and height, 3 cm) were saturated from the bottom with a 0.01 N CaCl
2solution and were left under conditions for more than 24 h. The
saturated hydraulic conductivity Ks of the cores was determined by constant head method. Caps on both ends were removed and carried into Tempe pressure cell.
Samples were then resaturated from the bottom and left for 24 h.
One-step outflow experiment The apparatus of one- step outflow experiment was described in Fig. 1. The one- step outflow experiment was initiated by applying a nitrogen gas pressure through the top cap and monitoring the resulting outflow into a graduated burette. Pressure was changed when outflow rate decreased to < 0.01 ml h
-1, which corresponds to the beginning of third stage of the outflow curve (Passioura, 1976). After the final pressure step, the cores were weighed and removed from the retaining cylinders for gravimetric water content determination. From outflow volumes and final water content, pressure head pairs were computed. Saturated water content (θs) was estimated from bulk density.
Residue water content, θr, was measured at 15 bar pressure using pressure plate.
Two hydraulic function models, van Genuchten's and Campbell's model, were checked with Gardner (1956)'s method which was directly calculated by one-step outflow data. The parameters of van Genuchten and Campbell's model were obtained by fitting water retention data points. In determining values of soil hydraulic conductivity at water content θ, K(θ), lab- measured not optimized Ks (soil saturated hydraulic conductivity) values were input into the hydraulic conductivity functions of van Genuchten (1980) and Campbell (1974).
Model description Van Genuchten (1980)
where is relative water content, and
α, m, n are the parameters of van Genuchten's model (m=1-1/n, 0<m<1).
K
r(Θ) = Θ
1/2[1-(1-Θ
1/m)
m]
2(2) where Kr = K/Ks is relative soil hydraulic conductivity at water content θ .
Fig. 1. The apparatus of Tempe pressure cell.
Θ = [ ] 1
m(1) 1+(
αh)
nθ- θ
rΘ = [ ]
θ
s- θ
rCampbell (1974)
where h is soil water pressure at water content θ , and ha, b are air entry pressure and the parameter of Campbell's model.
Gardner (1956)'s one-step outflow method
If the total outflow of the process Q
0, the outflow at any time Q(t), the diffusivity D, these has following relation.
The experimentally determined values of (Q
0-Q) was plotted against t on semi-log curve, and then a straight line with a slope equal to (π /2L)
2D should be obtained.
Results and Discussion
The saturated hydraulic conductivity increased as total
porosity was higher and clay content smaller. The saturated hydraulic conductivity of Ap1 horizon was about ten times higher than that of B1 horizon.
One of the five Ap1 horizon samples had cracks, which seemed to be formed by large plant root. The saturated hydraulic conductivity of that sample was about five times higher than the mean saturated hydraulic conductivity. Also, one of B1 horizon samples had a tubular hole, which looked likely an earthworm hole.
That sample's saturated hydraulic conductivity was ten times higher than the mean saturated hydraulic conductivity. So it can be confirmed that continuous macropores exist in B1 horizon. However, no macropore such as a crack or hole was observed by naked eye in C horizon samples.
The coefficient of variance (CV) of the soil physical properties ranged from 1 % to 40 % (Table 1), so it can be considered that spatial variations of these properties were large. Especially in B1 and C horizon, the particle size distributions were different in same horizon within samples according to distribution of a thin patch clay cutan. The CV (%) of bulk density from Ap1 horizon
h = h
a( ) θ
-b(3)
θ
sK(Θ) = K
s( ) θ
2b+3(4)
θ
s8Q
0π
In[Q
0- Q(t)] = [in ( )] - ( )
2Dt (5)
π
22L
Horizon
Ap1
B1
C
"
( ) : the coefficient of variance (%), Ks : saturated hydraulic conductivity,
"
(Ap1 horizon) : included crack,
‡(B1 horizon) : included tubular Hole. Two data was excluded in calculated mean value.
Ks Texture
Clay Silt
Sand Organic Matter
Bulk Density
1.31 1.31 1.34 1.31 1.43 mean 1.34 (3.9) 1.53 1.52 1.53 1.50 1.56 mean 1.53 (1.4) 1.30 1.31 1.28 1.29 1.37 mean 1.31 (2.7)
17.7 14.7 14.0 15.8 15.7 15.6 (9.0) 1.3 0.9 1.2 1.8 1.2 1.3 (25.6) 0.6 0.2 1.2 0.7 0.7 0.7 (52.4)
54.7 52.5 53.3 56.5 54.8 54.4 (2.8) 58.1 53.4 59.6 58.0 63.5 58.5 (6.2) 75.0 75.5 69.8 72.2 75.4 73.6 (3.4)
21.7 22.8 23.6 22.2 22.6 22.6 (3.1) 17.2 22.1 14.0 9.8 13.6 15.3 (30.0) 18.5 18.3 22.1 21.2 16.3 19.3 (12.2)
23.6 24.7 23.1 21.3 22.6 23.0 (5.4) 24.7 24.5 26.4 32.2 22.9 26.2 (3.8) 6.5 6.2 8.1 6.6 8.3 7.1 (13.7)
SCL
SCL
SL
"
9.25 2.40 1.75 1.78 2.08 2.00 (15.1) 0.42 0.34 0.10
‡2.74
0.23 0.27 (50.9) 8.50 4.90 2.20 5.60 5.50 5.24 (42.0) cm hr-1
%
% g kg-1 %
Mg m-3 Table 1. Soil physical properties.
was higher than other horizons. It was due to different type of plant root distribution and degree of compaction by cultivated work.
Soil water content decrease was greater in C horizon core than other horizons as soil water suction increased (Fig. 2). And the extent of decrease was lowest in B1 horizon. This was largely related to clay content. The soil water retentivity of B1 horizon was higher than that of
other horizons. Especially, the water content at -15 bar water potential of B1 horizon was two times higher than C horizon. But the available soil water content of each horizon was similar. It can be attributed that water content fixed soil matrix in Ap1 and B1 horizon, the water less than -15 bar potential, was large.
Fitted curves by models accorded to measured data except for both end of pressure range. In near-saturated
Horizon
Ap
B
C
b ha(cm)
n a
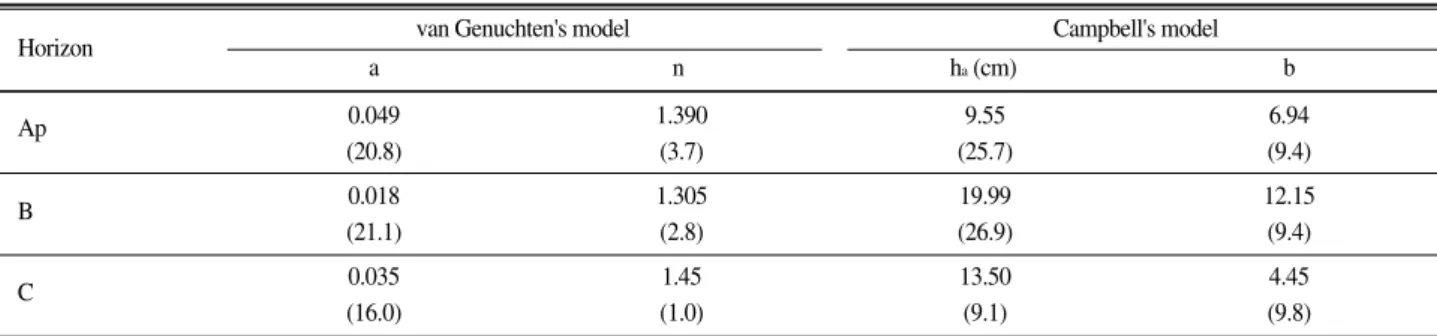
( ) : the coefficient of variance (%) 0.049 (20.8) 0.018 (21.1) 0.035 (16.0)
1.390 (3.7) 1.305 (2.8) 1.45 (1.0)
9.55 (25.7) 19.99 (26.9) 13.50 (9.1)
6.94 (9.4) 12.15 (9.4) 4.45 (9.8) Campbell's model van Genuchten's model
Table 2. The parameters of van Genuchten's and Campbell's model.
Fig. 2. Soil water retention curve of each horizon. Filled circles, solid line, and dashed line indicate measured data, van Genuchten's model, and Campbell's model, respectively.
Fig. 3. Soil hydraulic conductivity of each horizon. Filled circles, solid line, and dashed line indicate Gardner(1956)'s method, van Genuchten's model, and Campbell's model, respectively.
condition, measured water retention characteristics showed relatively better fitness with Campbell's model than van Genuchten's. By fitting measured data on two model, the parameters of van Genuchten's and Campbell's models were shown in Table 2. The largest pore size in each core can be calculated from air entry pressure (ha) of the parameter of Campbell's model, showing 309 m, 148 m, and 219 m in Ap1, B1, and C horizon, respectively. The parameter b of Campbell's model could explain the extent of drainage. Similarly, the parameter n of van Genuchten's model indicated curve's symmetry, so drainage water range was wider as n was larger.
In measuring soil unsaturated hydraulic conductivity through one-step outflow method in Tempe pressure cell, the water flow could be resisted by water conductivity of pressure plate. The water conductivity of 1 bar porous plate used in this study was 0.005 cm hr
-1. Gardner's one- step outflow method could, therefore, apply only more than 0.005 cm hr
-1. The soil hydraulic conductivity of C horizon at -22 kPa water potential was highest of three horizon. At the water potential, Ap1 horizon had a little less soil hydraulic conductivity than B1 horizon.
Contrasting to this, at -75 kPa water potential, B1 horizon had highest soil hydraulic conductivity, and Ap1 and C had similar values.
The soil unsaturated conductivity estimated by Campbell's model was higher than by van Genuchten's.
In Ap1 and B1 horizon, the soil unsaturated conductivities obtained by Gardner's method were more than that estimated by van Genuchten's model and less than that by Campbell's model. In C horizon, van Genuchten's model had better fitness compared with Gardner's method.
One of the differences between van Genuchten's and Campbell's models is a defined air-entry value. The theory of van Genuchten's model is based on Mualem (1976), describing a continuous hydraulic function without an air-entry value. Unlike this, Campbell's model introduces a well defined air-entry value. van Genuchten (1980) reported that the accuracy of van Genuchten's model could largely depend on residual water content r, and high deviation in high soil water content. Campbell's model started from establishing air-entry value in saturated soils had a error possibility in low water content range. Water and solute transport is more active in soils with high water content than in soils with low water content. So, the accuracy of hydraulic conductivity of soils with high water content could be more important.
This induced alternative formulation of van Genuchten model, incorporating an air entry value (Vogel et al., 2001). Ippsich et al. (2006) reported that the modified van Genuchten's model was more accurate than classical van Genuchten's model. In fact, in this study, the hydraulic models was not tested by measured data in the range of near-saturated condition, due to a plate resistance. Only the better fitness of Campbell's model with soil water retention data in near-saturated water range than van Genuchten's model could reflect the possibility of better fitness in hydraulic function.
Conclusion
From this study, van Genuchten's model generally had better fitness with measured hydraulic conductivity than Campbell's model at the soil water potential range of - 10~-75 kPa, especially in C1 horizon. In near-saturated condition, Campbell's model could be thought as a relatively accurate hydraulic model, because of the better fitness of Campbell's model with soil water retention data than van Genuchten's model.
References
Campbell, G .S. 1974. A simple method for determining unsaturated conductivity from moisture retention data. Soil Sci. 117:311-314.
Gardner, W. R. 1956. Calculation of capillary conductivity from pressure plate outflow data. Soil Sci. Soc. Am. Proc. 21:317-320.
Ippisch, O., H. J. Vogel, and P. Bastian. 2006. Validity limits for the van Genuchten-Mualem model and implications for parameter estimation and numerical simulation. Adv. Water. Resour.
29:1780-1789.
Mualem, Y. 1976. A new model for predicting the hydraulic conductivity of unsaturated porous media. Water Resour. Res.
12:513-522
Passioura, J. B. 1976. Hydrodynamic dispersion in aggregated media. I. Theory. Soil Sci. 111:339-344.
Klute, A. 1986. Methods of soil analysis, Part 1 : Physical and mineralogical methods, Second Edition. Monogr. 9. ASA and SSSA, Madison, WI, USA
van Genuchten, M. Th.. 1980. A closed-form equation for predicting the hydraulic conductivity of unsaturated soils. Soil Sci. Soc. Am.
J. 44:892-898.
Vogel, T., M. Th. van Genuchten, and M. Cislerova. 2001. Effect of the shape of the soil hydraulic functions near saturation on variably-saturated flow predictions. Adv. Water. Resour. 24:133- 144.
Zang, S., L. Lövdahl, H. Grip, and Y. Tong. 2007. Soil hydraulic properties of two loess soils in China measured by various field- scale and laboratory methods. Catena 69:264-273.
이 연구는 Tempe 압력셀에서 1-단계 유출법을 이용하여 불포화수리전도도 추정모형인 van Genchten 모형과 Campbell 모형을 비교하고자 수행하였다. 토양 코아(컬럼)는 서울대학교 농업생명과학대학 부속 사과 과수원에 위치한 송정통 (the fine loamy, mesic family of Typic Hapludults) 의 Ap1, B1, C 층에서 채취하였다. 각 층위 의 컬럼들에 대해 포화수리전도도를 측정하고 Tempe 압력셀에서 수분보유곡선을 측정한 후 최소좌승법으로 모형의 변수를 도출하였다. 수분보유곡선에서 모형과 측정치는 잘 적합하였고 포화근처에서 Campbell 모형의 적합도가 van Genchten 모형보다 약간 더 좋았다. Campbell 모형의 불포화수리전도도가 van Genchten 모형 보다 높게 추정되었으며 1-단계 유출법의 불포화수리전도도는 C층에서 van Genchten 모형과 잘 적합하였고 Ap1층, B1층에서는 두 모형의 중간에서 van Genchten에 약간 더 가까웠다. 따라서 불포화수리전도도 측정범 위-10~-75kPa에서 van Genuchten 모형이 실측치와 더 적합하다 할 수 있었고, 포화근처에서는 수분보유곡선 과의 적합도가 Campbell 모형이 더 높은 것으로 보아 상대적으로 수리전도도함수의 정확도가 높을 것으로 추 측할 수 있었다.
empe 압력셀에서 1-단계 유출법을 이용한 van Genchten모형과 Campbell모형의 불포화수리전도도 추정 검증
한경화*·노희명1·조현준·김이열·황선웅·조희래·송관철 농촌진흥청 농업과학기술원, 1서울대학교 농생명공학부