Allozyme Variation and Population Structure of Carex okamotoi (Cyperaceae), a Korean Endemic Species
Man Kyu Huh* and Joo Soo Choi
Department of Molecular Biology, Dong-eui University, Busan 614-714, Korea
Received April 15, 2010 /Accepted May 8, 2010The genetic diversity and population structures of fourteen Carex okamotoi (Cyperaceae) populations in Korea were determined using genetic variation at 25 allozyme loci. The Carex okamotoi species is native to Korea. It is endemic to three mountains (Mt. Taeback, Mt. Sobak, and Mt. Noreong) where it is found at 700~1,500 m above sea level. The percentage of polymorphic loci was 40.0%. Genetic diversity at the species level and at the population level was low (H
ES=0.106; H
EP=0.094), and the ex- tent of the population divergence was relatively low (G
ST=0.082). Measurement of deviation from ran- dom mating (F
IS) within the 14 populations was 0.238. An indirect estimate of the number of migrants per generation was 2.78 (Nm=2.78). Analysis of fixation indices revealed a substantial heterozygosity deficiency in some populations and at some loci. Mean genetic identity between populations was 0.986.
Key words : Carex okamotoi, genetic diversity, population structure
*Corresponding author
*Tel:+82-51-890-1529, Fax:+82-51-890-1521
*E-mail : [email protected]
Introduction
Many plant populations consist of small groups of genet- ically related individuals rather than randomly arrayed enti- ties of related and unrelated individuals [17]. Genetic varia- tion of plant populations is also distributed nonrandomly, which has many important consequences for the evolu- tionary dynamics of these species [23].
Species that occur as small isolated patches scattered over large geographic areas may experience significant genetic drift and high levels of population divergence. In contrast, species with large, interconnected populations are expected to maintain higher levels of genetic variation within their populations [7]. However, various studies have shown that asexually reproducing plants can be maintained to be varia- tion in the extent of the diversity [3,11]. Despite the im- portance of knowledge concerning genetic variation for pro- viding information for conservation purpose and population genetic structure, detailed studies of the levels and dis- tribution of genetic variation are not available for most spe- cies in Korea, particularly for plant species which reproduce both sexually and asexually.
The genus Carex is a widespread perennial herb occurring throughout the world, in moist temperate habitats [19]. It
is notable that although the Korean species (C. okamotoi) is endemic species, this species has much high with- in-population genetic diversity and much lower genetic dif- ferentiation among populations compared with all Carex species of North America. C. okamotoi reproduces extensively by vegetative rhizomes and potentially by sexually pro- duced seeds. This species is native to Korea. It is endemic to Taeback, Sobak, and Noreong Mountains where it is found at 700~1,500 m above sea level. Leaves of this species are evergreen, basal, 3 ranked, and linear. Flowers are monoecious. Clonal species of C. okamotoi is wind-pollinated outcrossing [16]. No specialized seed dispersal mechanisms were known this species. Bracts subtend each flower. The male flower is surrounded with 1 bract and female flower is surrounded with 2 bracts. The pistil is compound of 3 united carpels. Rhizomes are generally horizontal elongated underground or prostrate stem rooting at the nodes, covered with scale-like modified leaves, and upturned at the apex.
Buds in the axils of the scales may grow into aboveground
stems. Stems of C. okamotoi are made into mats, straw ropes,
and materials for mud brick. Fibrous root systems of this
plant form extensive networks in the soil. Recently, the spe-
cies has become economically important as a protectant of
washout. The objectives of this study are to estimate how
much allozyme diversity is maintained in the species and
to describe how genetic variation is distributed within and
among populations of C. okamotoi.
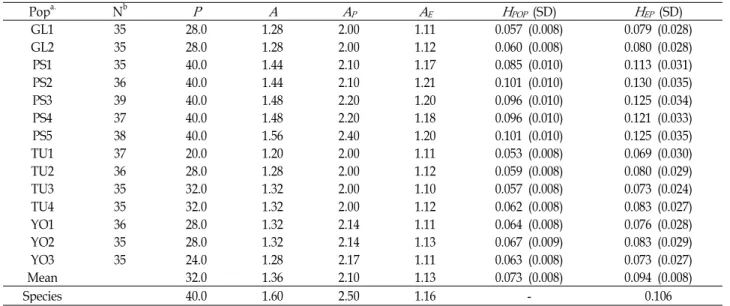
Table 1. Summary of allozyme variation within fourteen populations of
C. okamotoi
Popa. Nb
P A A
PA
EH
POP (SD)H
EP(SD)GL1 35 28.0 1.28 2.00 1.11 0.057 (0.008) 0.079 (0.028)
GL2 35 28.0 1.28 2.00 1.12 0.060 (0.008) 0.080 (0.028)
PS1 35 40.0 1.44 2.10 1.17 0.085 (0.010) 0.113 (0.031)
PS2 36 40.0 1.44 2.10 1.21 0.101 (0.010) 0.130 (0.035)
PS3 39 40.0 1.48 2.20 1.20 0.096 (0.010) 0.125 (0.034)
PS4 37 40.0 1.48 2.20 1.18 0.096 (0.010) 0.121 (0.033)
PS5 38 40.0 1.56 2.40 1.20 0.101 (0.010) 0.125 (0.035)
TU1 37 20.0 1.20 2.00 1.11 0.053 (0.008) 0.069 (0.030)
TU2 36 28.0 1.28 2.00 1.12 0.059 (0.008) 0.080 (0.029)
TU3 35 32.0 1.32 2.00 1.10 0.057 (0.008) 0.073 (0.024)
TU4 35 32.0 1.32 2.00 1.12 0.062 (0.008) 0.083 (0.027)
YO1 36 28.0 1.32 2.14 1.11 0.064 (0.008) 0.076 (0.028)
YO2 35 28.0 1.32 2.14 1.13 0.067 (0.009) 0.083 (0.029)
YO3 35 24.0 1.28 2.17 1.11 0.063 (0.008) 0.073 (0.027)
Mean 32.0 1.36 2.10 1.13 0.073 (0.008) 0.094 (0.008)
Species 40.0 1.60 2.50 1.16 - 0.106
Percentage of polymorphic loci (
P
), mean number of alleles per polymorphic population (A
P), mean number of alleles per locus (A
), effective number of alleles per locus (Ae), observed heterozygosity (H
OP), and Hardy-Weinberg expected heterozygosity or genetic diversity (H
EP).a: Abbreviation codes as in Fig. 1.
b: Number of individuals in the sample.
Materials and Methods Sampling procedure
Carex okamotoi (Cyperaceae) was collected from fourteen populations in Korea (Fig. 1). Populations of C. okamotoi are composed four major groups of the western (GL1 and GL2), southern (PS1~5), central (YO1~3), and eastern (TU1~4) regions. The elevations of the sampling sites were estimated to be: GL 763~822 m, YO 1,054~1,440 m, PS 1,430~1,915 m, and TU 721~1,236 m. In southern below GL1 and northern above TU4 areas, we failed to find the species. Young leaves from more than 35 plants were collected from each pop- ulation (Table 1). The distance between the selected in- dividuals was about 5 m to avoid inclusion of individuals emanating from the same rhyzome. Sampled leaves were stored in plastic bags for several days in a refrigerator until electrophoresis was carried out.
Enzyme electrophoresis
Enzyme extraction, starch gel electrophoresis and enzyme assay were conducted by following the procedures of Soltis et al. [25]. Leaves were homogenized by mechanical grinding to release enzymes from cell and organellar membranes with Tris-HCl grinding buffer-PVP solution as described in Soltis et al. [25]. Electrophoresis was performed with a 12.0% starch gel. Twelve enzyme systems were assayed: acid phosphatase
Fig. 1. Collection localities for populations of
C. okamotoi
as source for isozyme analysis. GL1: Bancheon-ri, Sancheong-gun;GL2: Buchun-ri, Hadong-gun; PS1: Goseong-ri, Geesan-gun;
PS2: Unheung-ri, Sangju-si, PS3: Sanggeum-ri, Gimcheon-si;
PS4: Jisan-ri, Geochang-gun; PS5: Banpo-ri, Hapcheon-gun;
TU1: Daechi-ri, Yangynag-gun; TU2: Imgok-ri, Gangneung-si;
TU3: Icheon-ri, Samcheok-si; YO1: Geumcheon-ri, Uljin-gun; YO2: Dongmyeon-ri, Bonghwa-gun; Yeong-ri, Yeongdeok-gun.
(ACP), leucine aminopeptidase (LAP), and menadione re- ductase (MNR), were resolved on System 9 of Soltis et al.
[25]; glucose phosphate isomerase (GPI), isocitrate de- hydrogenase (IDH), malate dehydrogenase (MDH), malic enzyme (ME), 6-phosphogluconate dehydrogenase (PGD), and phosphoglucomutase (PGM) were resolved on System 10 of Soltis et al. [25]; fluorescent esterase (FE), peroxidase (PER), and shikimate dehydrogenase (SKD) were resolved on System (morpholine-citrate, pH 6.1) of Clayton and Tretiak [2]. Gels were run in a refrigerated chamber at 4
oC.
The systems 9 and 10 were run at 150 V for 4.5 hr and at 100 V for 5.5 hr, respectively. Morpholine buffer system was run at 200 V for 4.0 hr. For enzymes resolving in more than one zone of activity, the most anodal isozyme is arbitrarily designated ‘1’ and subsequent isozymes were sequentially assigned higher numbers. Likewise, alleles were designated alphabetically with the most anodally migrating allozyme designated ‘a’.
Analysis of data
Various standard genetic parameters were estimated us- ing a computer program developed by Loveless and Schnabel (personal communication); percentage of poly- morphic loci (P), mean number of alleles per locus (A), effec- tive number of alleles per locus (A
E), the number of alleles per polymorphic locus (A
P), and gene diversity (H
E) [9].
Subscripts refer to species (s) or population (p) level parameters. Observed heterozygosity (H
O) was compared with Hardy-Weinberg expected value using Wright's fix- ation index (F) or inbreeding coefficients [29]. Nei's gene di- versity formulae (H
T, H
S, D
ST, and G
ST) were used to evaluate the distribution of genetic diversity within and among pop- ulations [20,21]. The G
STcoefficient estimates relative pop- ulation differentiation. In addition, χ
2-statistics were used to detect significant differences in allele frequencies among populations for each locus [28]. Nei's genetic identity was calculated for each pairwise combination of populations [20].
The genetic structure within and among populations was also evaluated using Wright's F-statistics: F
IT, F
IS, and F
ST. The F
ITand F
IScoefficients measure excesses of homozygotes or heterozygotes relative to the panmictic expectations with- in the entire samples and within populations, respectively [29]. In the context of multiallelic loci F
STis denoted G
ST[21].
The mating system of C. okamotoi was estimated using the equation Fe=(1-t)/(1+t) [10] which assumes mating system in equilibrium. Two indirect estimates of gene flow were
calculated. One estimate of Nm (the number of migrants per generation) was based on G
ST[29] and the other estimate was based on the average frequency of rare alleles found in only one population [23]. Correlation between geo- graphical and genetic distance was tested using Mantel's test as advocated by Smouse et al. [24].
A phenetic relationship was constructed by the neigh- bor-joining (NJ) method [22] using the NEIGHBOR program in PHYLIP version 3.57 [4].
Results Genetic diversity
Ten of the 25 loci (40.0%) showed detectable poly- morphism in at least one population, while the remaining fourteen loci (Acp, Fe-2, Gpi-1, Idh-1, Lap-1, Lap-2, Mdh-2, Mdh-3, Mdh-4, Me, Mnr-1, Per-3, Per-4, Pgd-2, and Pgm-2) were monomorphic in all populations (Table 1). Significant differences were found in allele frequencies between regions for 3 loci (Fe-1, Per-2, and Mdh-1). In YO region, Fe-1 is mono- morphic while others are polymorphic. In GL and TU re- gions, Per-2 locus is also the same trend. In PS region, Mdh-1 was shown polymorphic. An average of 32.0% of the loci was polymorphic within populations, with individual pop- ulation values ranging from 20.0% to 40.0%. The average number of alleles per locus (A) was 1.36 across populations, varying from 1.20 for the population with the lowest number of alleles and 1.56 for the population with the highest num- ber of alleles. The effective number of alleles per locus (A
E) was similar at the species and the population level (A
ES=1.16;
A
EP=1.14). The number of alleles per polymorphic locus (A
P) was 2.10 across populations, varying from 2.00 for the pop- ulation with the lowest number of alleles and 2.40 for the population with the highest number of alleles. The mean genetic diversity within populations was 0.094. The Population PS2 had the highest expected diversity (0.130), while the Population TU1 the lowest (0.069). In addition, the correlation between genetic distance and geographic dis- tance was low (r=0.51, p<0.05), and indicated that geo- graphically close populations tended to be genetically sim- ilar and about 74% of the variation in genetic distance was caused by unknown factors other than distance.
Genetic structure
F
IS, a measure of the deviation from random mating with-
in the 14 populations, was 0.238, and ranged from 0.081
Table 2. Estimates of genetic diversity statistics and 11 polymorphic loci in
C. okamotoi
Locus
H
TH
SD
STF
ISF
ITG
STFe-1
0.449 0.296 0.153 0.256 0.510 0.341***Per-1
0.076 0.068 0.008 0.290 0.364 0.104Per-2
0.185 0.165 0.020 0.081 0.179 0.107*Pgd-1
0.234 0.212 0.022 0.428 0.481 0.092Idh-2
0.339 0.330 0.010 0.180 0.204 0.029Mdh-1
0.207 0.201 0.007 0.348 0.369 0.033Skd
0.172 0.164 0.008 0.302 0.335 0.047Mnr-2
0.291 0.287 0.005 0.218 0.230 0.015Pgi-2
0.394 0.392 0.003 0.094 0.101 0.007Pgm-1
0.298 0.284 0.015 0.185 0.223 0.049Mean 0.265 0.240 0.025 0.238 0.300 0.082
Total genetic diversity (
H
T), genetic diversity within populations (H
S), among populations (D
ST), deviations of genotype frequencies from Hardy-Weinberg expectations over all populations (F
IT), within individual population (F
IS), and proportion of total genetic diversity partitioned among population (G
ST).*
p
<0.05; ***p
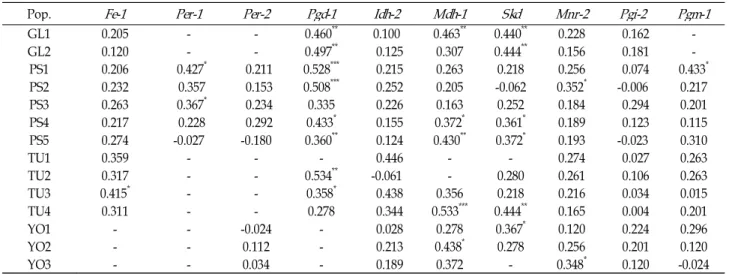
<0.001.Table 3. Wright's fixation indices for fourteen populations of
C. okamotoi
Pop.
Fe-1 Per-1 Per-2 Pgd-1 Idh-2 Mdh-1 Skd Mnr-2 Pgi-2 Pgm-1
GL1 0.205 - - 0.460** 0.100 0.463** 0.440** 0.228 0.162 -
GL2 0.120 - - 0.497** 0.125 0.307 0.444** 0.156 0.181 -
PS1 0.206 0.427* 0.211 0.528*** 0.215 0.263 0.218 0.256 0.074 0.433*
PS2 0.232 0.357 0.153 0.508*** 0.252 0.205 -0.062 0.352* -0.006 0.217
PS3 0.263 0.367* 0.234 0.335 0.226 0.163 0.252 0.184 0.294 0.201
PS4 0.217 0.228 0.292 0.433* 0.155 0.372* 0.361* 0.189 0.123 0.115
PS5 0.274 -0.027 -0.180 0.360** 0.124 0.430** 0.372* 0.193 -0.023 0.310
TU1 0.359 - - - 0.446 - - 0.274 0.027 0.263
TU2 0.317 - - 0.534** -0.061 - 0.280 0.261 0.106 0.263
TU3 0.415* - - 0.358* 0.438 0.356 0.218 0.216 0.034 0.015
TU4 0.311 - - 0.278 0.344 0.533*** 0.444** 0.165 0.004 0.201
YO1 - - -0.024 - 0.028 0.278 0.367* 0.120 0.224 0.296
YO2 - - 0.112 - 0.213 0.438* 0.278 0.256 0.201 0.120
YO3 - - 0.034 - 0.189 0.372 - 0.348* 0.120 -0.024
*
p
<0.05; **p
<0.01; ***p
<0.001.(Per-2) to 0.428 for Pgd-1 (Table 2). The observed significant and positive F
ISvalue (0.238) indicates that there was a sig- nificant deficit of heterozygotes in the populations. Analysis of fixation indices, calculated for all polymorphic loci in each population, showed a slight deficiency of heterozygotes rela- tive to Hardy-Weinberg expectations (Table 3). For example, on an individual locus level, 92.0% of fixation indices were positive (103/112), and 28 of those departed significantly from zero (p<0.05). Eight of indices were negative, indicating an excess of heterozygotes, but none departed significantly.
Assuming mating system equilibrium, the outcrossing rate (t) which calculated from the mean F
ISvalue was estimated to be 0.616. Total genetic diversity values (H
T) varied be- tween 0.076 (Per-1) and 0.449 (Fe-2), giving an average over
all polymorphic loci of 0.265. The interlocus variation in within population genetic diversity (H
S) was high (0.240).
On a per locus basis, the proportion of total genetic variation due to differences among populations (G
ST) ranged from 0.007 for Pgi-2 to 0.341 for Fe-1 with a mean of 0.082, indicat- ing that about 6.0% of the total allozyme variation was among populations. The estimate of gene flow based on G
STwas slightly high among Korean populations of C. okamotoi (Nm=2.78). Values of genetic distance (D) were below 0.033.
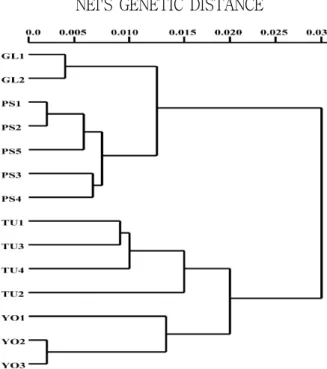
Genetic identity values among pairs of populations range from 0.967 to 0.999. The similarity among C. okamotoi pop- ulations can be seen in the NJ dendrogram, where total pop- ulations cluster at a genetic distance below 0.032 (Fig. 2).
Four major clusters of C. okamotoi regions, corresponding to
NEI'S GENETIC DISTANCE
Fig. 2. A dendrogram showing the genetic similarity among the fourteen populations of
C. okamotoi
, based on data of ge- netic distance obtained by starch gel electrophoresis.groups of the western, southern, central, and eastern regions, revealed by the tree. Within the four major clades, associated between distance and genetic divergence were somewhat more tenuous, the two spatially closest pairs of regions (central and eastern regions) exhibited the highest genetic identities. Within the four east populations, TU2 forms a long cluster with three populations. The same trend is ob- served in the YO region.
Discussion
Genetic diversity and genetic structure in Carex complex C. okamotoi maintains lower diversity in populations than the average plant species. For example, its genetic diversity at 0.106 is lower than that of temperate-zone species (0.146), species with a reproduction mode that is sexual and asexual (0.138), and species are short-lived herbaceous perennials (0.116) [9]. Other genetic diversity parameters of C. okamotoi were also lower than those of species with similar ecological and history traits. These comparisons suggest that genetic diversity levels of C. okamotoi are lower than that of its asso- ciates, the temperate-zone species. In addition, among three Korean Carex species for which there are allozyme data (Table 5), C. okamotoi had the lowest total genetic diversity (H
T). Rare and/or endemic species may become genetically
depauperate, historically or prehistorically, owing to small population size, to strong directional selection for speci- alized niches, or to a combination of these factors [27].
Karron [14] reported that widespread species had a greater number of polymorphic loci than restricted congeners. For all 9 genera cited by Karron where number of alleles poly- morphic loci was calculated, widespread species had more alleles than restricted species. The differences in genetic vari- ability among Carex honoensis, Carex humilis var. nana, and C. okamotoi are consistent with these trends (Table 5).
Carex species of North America except Carex lasiocarpa have much lower genetic diversity compared with the tree Korean species (Table 5). That is due at least in part to low abundance and the ranges of collecting populations. For ex- ample, in C. rariflora, the range of western population and eastern population is more than 1500 km. But, in this study, the distance between the two most distinct populations is only 250 km (Fig. 1). Vellend and Waterway [26] suggest that geographic separation is more imported than local se- lection in determining the pattern of genetic diversity in Carex rariflora.
Most northern Carex species usually occur in the relatively narrow transition zone between wetland and forest or tun- dra [26]. Thus, the sizes of populations are relatively small.
Thus, low gene flow among isolated populations dues to genetic drift and genetic differentiation among populations [7].
These Carex are mostly species with relatively large rang- es in the North Temperature zones of Asia, North America, and Europe. The northern North American regions were heavily impacted by Pleistocene glaciation, with much of their areas covered by ice [26]. Four regions of C. okamotoi are isolated, which might result from life history traits and historical events (e.g. the Holocene Paleoclimatic history) of the species. Holocene uplifts created the present Sobak- Noreong Mountains [15]. When North Korea was covered with glaciers throughout the Pleistocene, the South Korea did not experience strong glaciation history period at that time. It is highly probable that the glacial remnants of these Carex species after the glacial warm to the warm Southern Korea Peninsula [15]. Population bottlenecks regulating from founder effects during postglacial colonization may ex- plain the lower genetic diversity in C. okamotoi compared with C. honoensis and C. humilis var. nana in Korea.
Genetic differentiation among populations is principally
a function of natural selection, genetic drift, and gene flow
among populations via pollen and seed dispersal [23]. Of
Table 4. Estimates of gene flow and genetic diversity within regions
Region P(I)a
Nm
(S) bNm
(W) cH
TH
SG
STGL 0.000(0) 1.00 7.26 0.409 0.407 0.009
PS 0.083(2) 0.61 6.54 0.432 0.429 0.035
TU 0.049(1) 1.46 2.15 0.418 0.418 0.029
YO 0.032(1) 2.98 5.56 0.408 0.408 0.014
a: P(I) is the mean frequencies of ‘private’ allele.
b: Estimates based on Slatkin’s equation.
c: Estimates based on Wright’s equation.
Table 5. Measures of genetic variability for all previously studied northern rhizomatous
Carex
speciesSpecies
A P H
SH
TG
STNm
Data set Data sourceC. saxatilis
1.6 45 0.146 0.182 0.198 1.01 Ramet Fordet al
. [5]C. membranacea
1.6 44 0.162 0.199 0.183 1.12 Ramet Fordet al
. [5]C. rotundata
1.6 44 0.120 0.148 0.184 1.11 Ramet Fordet al
. [5]C. lasiocarpa
1.6 48 0.226 0.266 0.151 1.41 Genet McClintock and Waterway [19]C. pelllita
1.6 44 0.203 0.248 0.181 1.13 Genet McClintock and Waterway [19]C. bigelowii
1.8 49 0.167 0.180 0.072 3.22 Genet Jonssonet al
. [13]C. limosa
1.5 42 0.137 0.146 0.063 3.72 Genet Waterway and McClintock (unpublished data)C. paupercula
1.2 19 0.068 0.151 0.553 0.20 Ramet Waterway and McClintock (unpublished data)C. hondoensis
1.6 42 0.315 0.326 0.043 5.51 Ramet Huh [12]C. rariflora
1.4 32 0.071 0.134 0.467 0.29. Ramet Vellend and Waterway [26]C. humilis
var.nana
1.4 48 0.256 0.274 0.068 3.42 Ramet Huh [12]C. okamotoi
1.6 40 0.240 0.265 0.082 2.78 Ramet This studyMean 1.5 41 0.171 0.210 0.187 2.24
the total variation observed in C. okamotoi about 6.0% was due to differences among populations (G
ST=0.082).
Predominantly wind-pollinated outcrossing species have on an average less than 10 % of the genetic variation between populations [9]. This low level of genetic differentiation also suggests that gene flow among population is high (Nm=2.78). The indirect outcrossing estimate reported in this paper (t=0.616) suggests a mixed-mating system in C.
okamotoi.
Genetic variation among regions
Plants cannot move to more favorable patches. New gen- ets by break of physically connections among ramets occur in near parental plants. Some genets move considerably with collapse of cliffs. But gene flow by clonal spread may only occur in short distance. Although many of sampled C. okamo- toi populations were small and appear to be relatively iso- lated, indirect estimates of gene flow for the four regions were moderate. Nm ranged from 2.15 for TU region to 7.26 for GL region (Table 4). The estimate of gene flow might be an overestimate for the species as a whole because two of the sampled populations (GL1 and Gl2) were consisted of many subpopulations within 25 km. Only two pop-
ulations of region GL had the fixed allele on the Pgm-1 locus.
Because two populations of region GL found along the same side (East) of the Sobak Mountain, the Mountain is not acted as a barrier of gene flow of two populations. Other regions are same trend. C. okamotoi can be found growing erratically anywhere from the top of the mountains to valley from ele- vations of 700 m to 1,500 m. Physical barriers are always possible between populations. The G
STranging from 0.009 to 0.035 indicates the physical barrier does not restrict gene flow between populations within regions (Table 4).
In any case, the main agent of gene flow in this species is probably seed or pollen dispersal by wind. Perigynia pos- sess an eliasome-like body, suggesting that species may be ant dispersal [8]. Plants are frequently found on slopes, often in association with streams. In these areas perigynia may fall downslope and could be carried some distance by snow or water. Morphological adaptations, such as perigynia with long serrated beaks, could favor long-distance by small mammals [5,6].
Fragmentation of historically contiguous populations is
expected to lead to genetic drift and increased levels of pop-
ulation divergence as population sizes become smaller and
gene flow decrease [18]. However, the low allelic diversity
and heterozygosity within populations and the low G
STesti- mates show that genetic drift has not yet had a major influ- ence on Korean C. okamotoi populations. Species with natu- rally isolated, patchy distributions might be expected to ex- hibit similar genetic structure. In this regard, the pattern of genetic divergence between C. okamotoi regions is notable.
Analyses of subpopulation structure within four of the re- gions indicated that, on an average, 2.2% of the total genetic diversity for each region was found between subpopulations (Table 4).
Although C. okamotoi maintains low level of genetic diver- sity, the small isolated populations that currently character- ize the Korean populations of C. okamotoi coupled with the recent increased destruction of natural habitats for the con- struction of skiing grounds. It may result in further species extinction of rare species as well as erosion of genetic varia- tion in the future. Thus, environmental factor (a basin be- tween two high mountains) plays a role as an endemic species. The basin is a region of heavy snow in winter and very hot in summer owing to high mountains. In addition, for a student of adaptive evolution it is natural to seek out an extreme environment with strong selection pressures where conspicuous adaptations are likely to be found, such as alpine habits [1,13]. C. okamotoi is endemic to three ranges of mountains (Fig. 1), plants must withstand the full force of the winter gales and the abrasive action of drifting snow.
Therefore, C. okamotoi has sparsely herbaceous stems each terminated by a leaf rosette and strong roots.
Acknowledgement
This work was supported by Dongeui University Research Grant (2010AA103).
References
1. Bliss, L. C. 1962. Adaptations of arctic and alpine plants to environmental conditions.
Arctic
15, 117-144.2. Clayton, J. W. and D. N. Tretiak. 1972. Amine-citrate buffers for pH control in starch gel electrophoresis.
J. Fish Res. Board
Can.
29, 1169-1172.3. Ellstrand, N. C. and M. L. Roose. 1987. Patterns of genotypic diversity in clonal plant species.
Am. J. Bot.
74, 123-131.4. Felsenstein, J. 1993. PHYLIP (Phylogeny Inference Package) Ver. 3.5s. Distributed by the Author. Department of Genetics, Univ. of Washington, Seattle.
5. Ford, B. A., P. W. Ball, and K. Ritland. 1991. Allozyme diver- sity and genetic relationships among North American mem-
bers of the short-beaked taxa of
Carex
sect.Vesicariae
(Cyperaceae).Syst. Bot.
16, 116-131.6. Ford, B. A., D. A. R. McQueen, R. F. C. Naczi, and A. A.
Reznicek. 1998. Allozyme variation species in the
Carex will- denowii
complex (Cyperaceae).Am. J. Bot
. 85, 546-552.7. Godt, M. J. W. and J. L. Hamrick. 1993. Genetic diversity and population structure in
Tradescantia hirsuticaulis
(Commelinaceae).Am. J. Bot
. 80, 959-966.8. Graddy, L. L. 1986. Twelve new ant-dispersal species from the southern Appalachians.
Bull. Tor. Bot. Club
113, 247-251.9. Hamrick, J. L., M. J. W. Godt, and S. L. Sherman-Broyles.
1992. Factors influencing levels of genetic diversity in woody plant species.
New For.
6, 95-124.10. Hartl, D. L. and A. G. Clark. 1988.
Principles of Population Genetics
. pp. 682, Sinauer Associates Inc., Sunderland, MA.11. Hebert, P. D. N., D. W. Ward, and L. J. Weider. 1988.
Clonal-diversity patterns and breeding-system variation in
Daphnia pulex
, an asexual-sexual complex.Evolution
42, 147-159.12. Huh, M. K. 2001. Allozyme variation and population struc- ture of
Carex humilis
var.nana
(Cyperaceae) in Korea.Can.
J. Bot.
79, 457-463.13. Jonsson, B. O., I. S. Jonsdtottir, and N. Cronberg. 1996.
Clonal diversity and allozyme variation in populations of the arctic sedge
Carex bigigelowii
(Cyperaceae).J. Ecol.
84, 449-459.14. Karron, J. D. 1987. A comparison of levels of genetic poly- morphism and self-compatibility in geographically re- stricted and widespread plant congeners.
Evol. Ecol.
1, 47-58.15. Kim, J. H. and S. S. Hong. 1991. Translation: history of the Korean butterflies and origin of the Japanese endemic butterflies. Chiphyunsa, Seoul, Korea.
16. Lee, Y. N. 2007. New Flora of Korea. Kyo-Hak Publishing Co., Seoul, Korea.
17. Linhart, Y. B. 1999. Mosaic landscapes, family structure and evolution.
TREE
14, 376-377.18. Loveless, M. D. and J. L. Hamrick. 1984. Ecological determi- nants of genetic structure in plant populations.
Ann. Rev.
Ecol. Syst
. 15, 65-95.19. McClintock, K. A. and M. J. Waterway. 1993. Patterns of allozyme variation and clonal diversity in
Carex lasiocarpa
andC. pellita
(Cyperaceae).Am. J. Bot
. 80, 1251-1263.20. Nei, M. 1972. Genetic distance between populations.
Am.
Nat
. 106, 282-292.21. Nei, M. 1973. Analysis of gene diversity in subdivided populations.
Proc. Natl. Acad. Sci. USA
70, 3321-3323.22. Saitou, N. and M. Nei. 1987. The neighbor-joining method:
A new method for reconstructing phylogenetic trees.
Mol.
Biol. Evol.
4, 406-425.23. Slatkin, M. 1985. Rare alleles as indicators of gene flow.
Evolution
39, 53-65.24. Smouse, P. E., J. C. Long, and R. R. Sokal. 1986. Multiple regression and correlation extensions of the Mantel test of matrix correspondence
. Syst. Zool
. 35, 627-632.25. Soltis, D. E., C. H. Haufler, D. C. Darrow, and G. J. Gastony.
1983. Starch gel electrophoresis of ferns: A compilation of
grinding buffers, gel and electrode buffers, and staining schedules.
Am. Fern J
. 73, 9-27.26. Vellend, M. and M. J. Waterway. 1999. Geographic patterns in the genetic diversity of a northern sedge,
Carex rariflora
.Can. J. Bot
. 77, 269-278.27. Williamson, P. S. and C. R. Werth. 1999. Levels and patterns of genetic variation in the endangered species
Abronia macro-
초록:한국 내 국부적으로 분포하는 지리사초의 알로자임 변이와 집단구조 허만규*․최주수
(동의대학교 분자생물학과)
한국 내 국부적으로 분포하는 지리사초(Carex okamotoi)의 14집단에 대해 유전적 다양성과 집단구조를 실시하 였다. 이 식물은 세 산맥(태백산맥, 소백산맥 노령산맥)의 고지대(700~1,500 m)에 제한적으로 자생한다. 다형성을
나타내는 대립유전자좌위는 40.0%였다. 종 수준과 집단 수준에서 유전적 다양성은 낮았으며(H
ES=0.106;
H
EP=0.094), 집단간 분화도 낮았다(G
ST=0.082). 14집단에 대한 임의 교배로부터 산출한 편차는 0.238이였다. 간접 적으로 산출한 세대간 이주하는 개체들의 수는 2.78이였다(Nm=2.78). 고정지수 분석에서 이형접합체의 실질적 결핍이 일부 집단과 대립유전자좌위에서 나타났다. 집단간 유전적 동질성은 평균 0.986이였다.
carpa
(Nyctaginaceae).Am. J. Bot.
86, 293-301.28. Workman, P. L. and J. D. Nishwander. 1970. Population studies on southern Indian tribes. II. local genetic differ- entiation in the Papago.
Am. Hum. Genet
. 22, 24-49.29. Wright, S. 1965. The interpretation of population structure by