1. INTRODUCTION
The moisture contents of milk is 87% of moisture. And 5.5%
of carbohydrates, 3.2% of lipids, 3.0% of protein and 0.7% of ash are in the dry bases of milk. Milk is know as nutritionally almost complete foods as natural single foods (Cho et al., 2017).
The digestibility of main component of milk, protein and fat, was almost 100%. And also digestibility of calcium was 53%
which was higher than that from vegetables of 10~20% and
fish of 20~40% (Nam & Park, 2011). However, the moisture content of milk can be used as an important medium for the growth of microorganisms, commercial milk is subjected to heat treated and refrigerated. In order to remove pathogens and harmful bacteria of the raw milk, it is pasteurized under low temperature and long time (LTLT) which is heated at 63℃
for 30 minutes to minimize changes the component of milk caused by heat, under high temperature short time (HTST) which is heated at 72~75℃ for 15 seconds, or under ultra-
Information available at the Culinary Society of Korea (http://www.culinary.re.kr/)Culinary Science & Hospitality Research
Journal & Article Management System: https://cshr.jams.or.kr/
21-28
http://dx.doi.org/10.20878/cshr.2018.24.2.008
Changes in Quality Characteristics of Commercial Milk with Different Physical Treatments during Storage
Jinyoung Choi , Youngsung Kim & Taeeun Kwon
Division of Food Science and Culinary Arts, Shinhan University, South Korea
KEYWORDS ABSTRACT
Physical treatments, Fatty acid composition, Quality characteristics, Storage,
Commercial milk.
In this study, the fatty acid content and quality characteristics of the massless enegy treated com- mercial milk products stored at 30 were investigated. The pH of pasteurized milk decreased sig- nificantly. UHT milk showed also significant decrease in pH to 4.70 5.72 on the 8th day of storage which was higher than control even there was no significant differences. The acidity of pasteurized milk decreased significantly from the 2nd day of storage to 0.13 0.65% in treatments and control and control was 0.94% at the 8th day of storage and 0.35% in the treatment of ultra high tem- perature milk. The solid content of pasteurized milk was 7.5 °Bx at 1 day after storage, which showed significant differences from the 11.2 °Bx in the treatment. Pasteurized milk showed more bacterial growth in the treatment than in the control. After 4 days of storage, there was no bacterial count in pasteurized milk but it increased significantly 1.9×10⁸ and 4.5×10⁶ each in UHT milk. Lactic acid bacteria were detected in the curd 2.0×10⁶ in the control and 2.0×10⁸ in the treatment at the 4th day. Palmitic acid content in the saturated fatty acid was the highest at 35.4 41.4% in both pasteurized and ultra high temperature milk. In the UHT milk, linolenic acid was significantly in- creased to 3.8% in the treatment compared with 2.9% in the control at the 4th day of storage.
Therefore, commercial ultra high temperature milk with physical treatment to increase beneficial bacteria showed significant difference compared to the control after 5 days of storage in this experi- ment.
* This study was supported by Shinhan University Research Grants in 2017.
Corresponding author: Jinyoung Choi, Division of Food Science and Culinary Arts, Shinhan University, 95 Hoam-ro, Uijeongbu-si, Gyeonggi 11644, South Korea, Tel. +82-31-870-3517, Fax. +82-31-870-3519, E-mail: [email protected]
high temperature sterilization (UHT) sterilization at 135℃ for 2 seconds, and then distributed as commercial milk(Noh et al, 2017). However, these methods of heat treatment cause changes in the nutrients contained in the milk. a method of preserving the nutritional components of the milk by the mi- nimum heating method is used. Casein is a main component in the milk protein. Since it is used as a medium for Lacto- bacillus which is good for intestinal health, it needs to be shipped and stored in a refrigeration distribution system in order to increase the storage period. In order to increase the storage period of milk, various processing methods have been studied and developed like whole milk powder and skim milk powder which are produced by lowering the water activity through drying, non-sweetened condensed milk and fructose condensed milk produced by adding sugar, and yogurt and cheese production fermented by lactic acid (Noh et al., 2017).
The other ways to prolong the storage of milk were tried such as a high pressure of 100~1,000 MPa was applied to milk to induce solubilization of casein micelle-related minerals and whey proteins denaturalization for cheese or yogurt manufac- turing, made a significant changes in the baroresistance bet- ween bacterial species and strains(Huppertz T, 2006). As a result of experiment of bacteria, E. coli and the enzyme activity in milk, the number of bacteria was decreased. E. coli was not detected at 15℃ for 15 days and all milk enzymes were inacti- vated after treatment of ultra high pressure of 550~600 MPa (Lee et al., 2014). In the result of milk storage experiment with different heat treatments and temperature conditions, the detection of volatile substance was found apparently LTLT → HTST → UHT → sterilization in order by the heat treatment and the detection of the volatile substance was least when stored at 4℃ (Hong et al., 2010). In the freeze-flow processing method, the change in quality during the freezing of the concentrated milk was not observed when stored for 18 days with increasing amount of sugar, fructose and glucose as a cryoprotectant. (Lee & Shin, 1985). After hydrotropic cavitation in milk, vitamin A decreased about 23%, vitamin B
2decreased about 19% and there was no difference in mineral and crude fat content. It showed the possibility of replacing the existing sterilization method because it didnt change the content vitamin or mineral content of the milk with the hydraulic cavitation treatment(Jung et. al., 2016).
This study was conducted to measure the physicochemical properties and fatty acid contents of milk stored at high tem- perature in order to extend the storage period of commercial
milk through the massless energy using the wave which could make the beneficial bacteria grow well.
2. MATERIALS AND METHODS
2.1. Materials
Pasteurized milk (LTLT, Pasteur, Korea) and ultra high tem- perature sterilization (UHT, Seoul, Korea) were purchased from local market. All of the reagents used for the analysis were Guaranteed Reagent (G.R.).
2.2. Sample Treatment
The quantum energy emitted from an atom was artificially created through special equipment that generates massless energy from the group of electrons and the surrounding small particles. Then, through energy transfer equipment, this ener- gy was surface treated to effect on the surface of the target material and transferred to teaspoon for 72 hours. The ther- mostated pasteurized milk (LTLT) and ultrahigh temperature sterilized (UHT) milk were stored in a glass container (diameter 15 cm×height 20 cm) at an incubation temperature of 30℃
for 8 days.
2.3. pH
The pH was measured with a pH meter (Mettler, toledo 340, Switzerland) pH meter (Orion 230A, USA) using a pH electrode for solid state.
2.4. Acidity
The acidity was determined by taking 10 mL of milk, add- ing 10 mL of distilled water and add 2~3 drops of phenolph- thalein indicator and titrate immediately with standard 0.1N NaOH to pink color.
2.5. Solid Content
The solids content in the aqueous solution was measured using a sugar meter (N1, ATAGO, Japan) to measure the Brix content (Bx) in terms of the weight ratio of the solute con- tained in the aqueous solution.
2.6. Total Bacteria, Total Coliforms and Lactic acid Bacteria
In order to quantitatively analyze general bacteria present
in milk, sterilized distilled water, which is 9 times that of the collected samples, was added to the stomacher plastic bag (3M, USA) and homogenized for 60 seconds using a stomach- er (Seward Medical Limited, London, UK) The supernatant is then. The cells were cultured at 35 ℃ for 24~48 hours, and then cultured in a medium containing 30~30 colonies. Cells were cultured in a Petri dish medium (Petrifilm
TMAC, 3M, USA) at 10
2, 10
3, 10
4, And the colonies were counted. The dry film mediawere used as Petrifilm (TM) aerobic count plates (AC, 3M, USA), E. coli/coli form count plate (EC, 3M, USA), lactic acid bacteria count plate (LAB, 3M, USA).
2.7. Fatty Acid Analysis
Fatty acid analysis was performed using gas chromato- graphy (Agilent GC 7890, Palo Alto, Calif., USA). Ammonia and ethanol were added to milk, followed by mixing and diethyl ether, and the supernatant was recovered. Diethyl ether was removed from the recovered supernatant and methylated by adding BF3 methanol to the remaining fat. DB-WAX capillary (60m×0.24mm×0.25μm) was used as a GC analytical column for fatty acid analysis. The column temperature was main- tained at 50℃ for 1 minute, then heated up to 200℃ at 20℃
per minute, The temperature was raised to 3℃ and main- tained for 20 minutes. The detector was a Flame Ionization Detector (FID), the inlet temperature was 250℃, and the de- tector temperature was maintained at 250℃. He was used as a carrier gas.
2.8. Statistical Analysis
Each analysis item was analyzed by Duncan's multiple range test at p<0.05 after SPSS (Version 9.1, SPSS, Inc., Chica- go, IL) program for analysis of three or more repeated expe- riments.
3. RESULTS AND DISCUSSION
3.1. pH
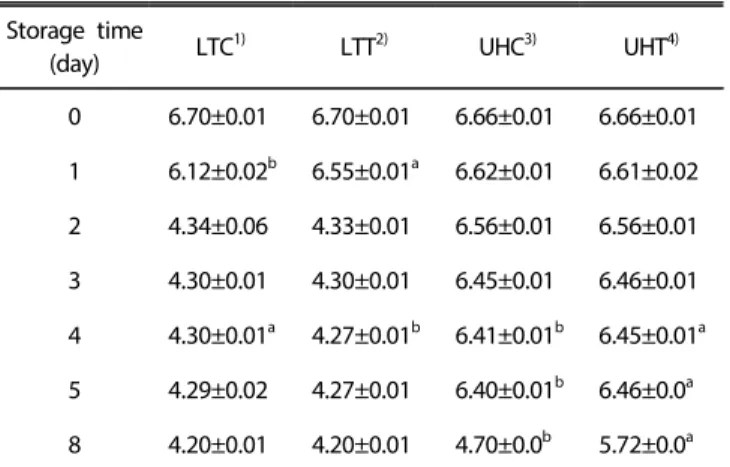
The pH changes of the milk with different physical treat- ments according to storage period was as shown in Table 1.
In LTC, the pH changes were 6.70~4.20. After 1 day of sto- rage at 30℃, the pH of the LTC was decreased to 6.12 while the pH of the LTT was 6.55. The changes of pH in the UHC and UHT were not observed during the same period of sto- rage. The pH of pasteurized milk was significantly reduced to
pH 4.20~4.34 in both LTC and LTT after 2 days of storage, and after near the isoelectric point of milk, pH 4.67, coagu- lation of casein in milk began to occur and separation of whey protein started. The pH of the sterilized milk was decreased between 3 and 5 days, but there was no differences between UHC and UHT. At the 8th day of storage, the UHC rapidly de- creased to pH 4.70, and the separation of whey protein and casein began to appear. These results were similar to the pre- vious experiments of the milk preheated at 65℃ for 30 se- conds and at 75℃ for 2 seconds were stored at 5℃ for 4 days, the pH were maintained at 6.60(Kim & Kim, 1993), and UHT, LTLT milk and low fat milk after lactic acid fermentation stored for 30 days at refrigerated temperature, the pH were decreased in the initial 10 days but increased after 10 days while the pasteurized milk was greatly decreased after 20 days of storage(Choi & Yoon, 1997).
It was thought that the decomposition of amino acids and the increase of lactic acid bacteria acted as a factor of decreas- ing pH while the storage period was increased.
3.2. Acidity
Table 2 showed the acidity changes of commercial and treated milk with different physical treatments according to storage period at 30℃. The acidity of commercial and treated milk with LTLT or ultra high temperture showed the same val- ue at the first day as 0.11%. The acidity of pasteurized milk
Table 1. pH change of commercial and treated milk during storage at 30℃
Storage time
(day) LTC1) LTT2) UHC3) UHT4)
0 6.70±0.01 6.70±0.01 6.66±0.01 6.66±0.01 1 6.12±0.02b 6.55±0.01a 6.62±0.01 6.61±0.02 2 4.34±0.06 4.33±0.01 6.56±0.01 6.56±0.01 3 4.30±0.01 4.30±0.01 6.45±0.01 6.46±0.01 4 4.30±0.01a 4.27±0.01b 6.41±0.01b 6.45±0.01a 5 4.29±0.02 4.27±0.01 6.40±0.01b 6.46±0.0a 8 4.20±0.01 4.20±0.01 4.70±0.0b 5.72±0.0a The same upper case letters in a row are not significantly different between samples at p<0.05 by Duncan’s multiple range test.
LTC1): Non-treated pasteurization milk.
LTT2): Treated pasteurization milk.
UHC3): Non-treated ultra high temperature milk.
UHT4): Treated ultra high temperature milk.
Table 2. Acidity changes of commercial and treated milk
during storage at 30℃ (Unit: %)
Storage time
(day) LTC1) LTT2) UHC3) UHT4)
0 0.11±0.01 0.11±0.01 0.11±0.01 0.11±0.01 1 0.13±0.01 0.13±0.01 0.11±0.02 0.10±0.01 2 0.43±0.02 0.39±0.02 0.18±0.02a 0.11±0.02b 3 0.54±0.02 0.50±0.02 0.20±0.02a 0.17±0.02b 4 0.60±0.01a 0.51±0.01b 0.23±0.01a 0.19±0.01b 5 0.67±0.01a 0.59±0.01b 0.23±0.02 0.20±0.01 8 0.70±0.02a 0.65±0.02 0.94±0.01a 0.35±0.01b The same upper case letters in a row are not significantly different between samples at p<0.05 by Duncan’s multiple range test.
LTC1): Non-treated pasteurization milk.
LTT2): Treated pasteurization milk.
UHC3): Non-treated ultra high temperature milk.
UHT4): Treated ultra high temperature milk.
decreased significantly from the 2nd day of storage to 0.13~
0.70% at the both of control and treatment. pH differences were observed at the 4th and 5th days of storage. In the case of acidity of ultra high temperture milk, there were differences between the control and the treatment from the 2nd day of storage. Acidity of UHC was 0.94% while that of UHT was 0.35% at the 8th day of storage. According to Korean Food Standards Codex, the acidity value of milk should be less than 0.18%. Therefore, in this experiment, the pasteurization milk could not be expected to be extended by the test treatment, but in case of ultra high temperature sterilized milk, It can be extended about 2 days of storage. The acidity value of pas- teurized milk increased from 0.43 at 2 days of storage to 0.70% at 8 days after storage. It seemed to be caused by ami- no acid decomposition or lactic acid increment. In the case of ultra high temperture milk, the acidity value was not sig- nificantly decreased but gradually decreased in the beginning stage. At the 8th day of storage, the value was greatly de- creased to 0.94. With these results, it could be understood de- composition of amino acid was greatly increased and lactic acid was increased. The amount of citric acid in organic milk and ordinary milk produced in Chungnam and Jeonbuk was 0.19%(Ki et al., 2015). This indicated that citric acid in pas- teurized milk was more abundant than UHT milk for heat treatment process differences, it was considered that the pH value could be lowered depending on the storage period, and the acidity value might be significantly different.
3.3. Solid Content
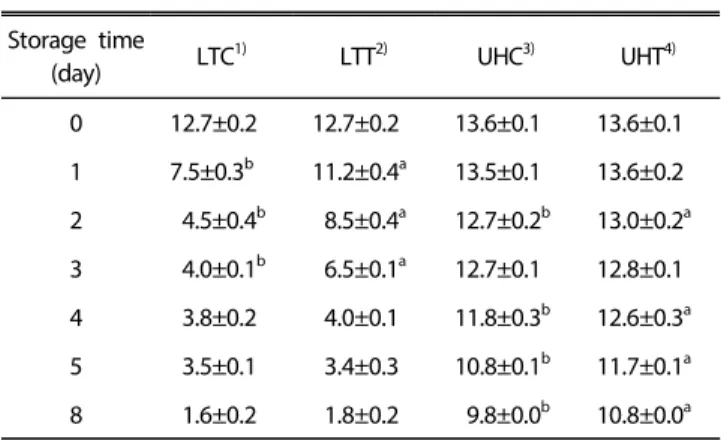
Table 3 showed the solid content changes of commercial and treated milk with different physical treatments according to storage period at 30℃. The solids content is an experiment to identify water-soluble components suspended in milk. The solid content of ultra high temperture milk was 13.6 °Bx while 12.7 °Bx in the pasteurized milk respectively at the first day and showed differences significantly. This suggests that the fat globules in the pasteurized milk were not well dispersed in the sterilization process and thus showed differences in the solid content by fat globule and the water soluble solid separation. After 1 day of storage, the solid contents of pas- teurized milk showed a significant difference of 7.5 °Bx in con- trol and 11.2 °Bx in treatment. Also, when the pH was lower than 4.6~4.7, the content of the water soluble solid was great- ly decreased as the whey protein and casein were separated.
However, at the 1st day of storage, the solid content of ultra high temperture milk showed 13.6°Bx in both treatment and control, which were the same solid content result at 0 day.
From 2 days after storage, the solid content decreased in UHC milk and decreased agin to 9.8 °Bx at the 8th day of storage while it was greatly reduced from 4.5°Bx at 2nd day to 1.6°Bx at the 8th day of storage in pasteurized milk and it showed almost completely hardened casein cake agglomeration on the 8th day. The solid contents showed a significant correla- tion with the pH decrease. The whey separation phenomenon in the pasteurized milk was appeared gradually with the de-
Table 3. Solid contents changes of commercial and treated milk during storage at 30℃ (Unit: °Bx) Storage time
(day) LTC1) LTT2) UHC3) UHT4)
0 12.7±0.2 12.7±0.2 13.6±0.1 13.6±0.1
1 7.5±0.3b 11.2±0.4a 13.5±0.1 13.6±0.2 2 4.5±0.4b 8.5±0.4a 12.7±0.2b 13.0±0.2a 3 4.0±0.1b 6.5±0.1a 12.7±0.1 12.8±0.1 4 3.8±0.2 4.0±0.1 11.8±0.3b 12.6±0.3a 5 3.5±0.1 3.4±0.3 10.8±0.1b 11.7±0.1a 8 1.6±0.2 1.8±0.2 9.8±0.0b 10.8±0.0a The same upper case letters in a row are not significantly different between samples at p<0.05 by Duncan’s multiple range test.
LTC1): Non-treated pasteurization milk.
LTT2): Treated pasteurization milk.
UHC3): Non-treated ultra high temperature milk.
UHT4): Treated ultra high temperature milk.
crease of pH from the 2nd day of storage. Since the solid con- tent of milk is closely related to the quality of milk, sugar sup- plement and freeze-flow process were used to maintain the solid content of concentrated milk which could be reduced during the freezing process (Lee et al., 1985).
3.4. Total Bacteria, Total Coliforms and Lactic acid Bac- teria
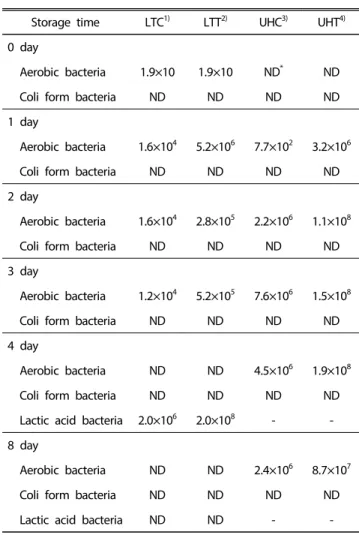
Table 4 showed the number of bacteria changes in the commercial and treated milk with different physical treat- ments according to storage period at 30℃. The number of bacteria was 1.9×10 in pasteurized milk and no bacteria was detected in ultra high temperture milk on day 0 of storage.
At the first day of storage, bacteria increased to 1.6×10
4in control and 5.2×10
6in the treatment respectively in pas- teurized milk and it showed more bacterial growth in the treatment. In the case of ultra high temperture milk, the num- ber of bacteria was 7.7×10
2in the control and 3.2×10
6in the treatment at the same day of storage. However, as the storage period increased, the number of bacteria began to decrease and there was no bacterial count in pasteurized milk after 4 days of storage, but increased 1.9×10
8and 4.5×10
6in ultra high temperture milk. According to the Korean Food Stan- dards Codex, the bacteria should be less than 20,000 CFU/mL of milk, so it could not be considered to be decayed until the 1st day, but after that, bacteria were proliferated com- pared with the initial number of bacteria. It was thought that whey proteins were separated at pH 4.6 or less and also bac- teria did not propagate at low pH in the pasteurized milk. On the other hand, the number of bacteria increased by 10000 times since UHT milk had weak acidic pH condition. Therefore, it was thought that corruption proceeded after 2 days of sto- rage. Jeong et al. (2002) reported that microorganisms were not detected in ultra high temperture milk at 5, 10, and 15℃
for 10 days. Lee & Park, (1998) reported that when commercial milk was stored at 10℃, it increased to 40 CFU/mL at first day, 90 units at 3 days and kept around 100 CFU/mL until 14 days. The increment of number of bacteria did not occur to 15 days or less at temperatures below 15℃, but it increases rapidly at temperatures above 15℃, which requires thorough management especially during the summer season. Bacteria such as heat resistant bacteria, E. coli, Staphylococcus aureus, powdery Streptococcus and Pseudomonas were not detected as contaminated bacteria contained in commercial milk, but the number of bacteria might be went up by storage period
and temperature increase.
E. coli counts were detected according to the storage peri- od of milk with different physical treatments and the result were at Table 4. The coliform group which is an indicator of fecal contamination should be less than 2 units per 1 mL of commercial milk. However, in this experiment, no coliform was detected in both commercial milk and UHT milk during storage at 30℃ for 8 days. This result was in agreement with the results of the experiments of Lee & Park (1998) who re- ported that E. coli was not detected when fermented milk, butter, cheese, and commercial milk were stored at 10, 20, and 30℃ for 14 days.
Table 4 showed the number of lactic acid bacteria per sto- rage period in milk with different physical treatments. In the
Table 4. Number of total bacteria, total coliforms and lactic acid bacteria changes of commercial and treated milk du-
ring storage at 30℃ (Unit: CFU/g)
Storage time LTC1) LTT2) UHC3) UHT4) 0 day
Aerobic bacteria 1.9×10 1.9×10 ND* ND
Coli form bacteria ND ND ND ND
1 day
Aerobic bacteria 1.6×10⁴ 5.2×10⁶ 7.7×10² 3.2×10⁶
Coli form bacteria ND ND ND ND
2 day
Aerobic bacteria 1.6×10⁴ 2.8×10⁵ 2.2×10⁶ 1.1×10⁸
Coli form bacteria ND ND ND ND
3 day
Aerobic bacteria 1.2×10⁴ 5.2×10⁵ 7.6×10⁶ 1.5×10⁸
Coli form bacteria ND ND ND ND
4 day
Aerobic bacteria ND ND 4.5×10⁶ 1.9×10⁸
Coli form bacteria ND ND ND ND
Lactic acid bacteria 2.0×10⁶ 2.0×10⁸ - - 8 day
Aerobic bacteria ND ND 2.4×10⁶ 8.7×10⁷
Coli form bacteria ND ND ND ND
Lactic acid bacteria ND ND - -
LTC1): Non-treated pasteurization milk.
LTT2): Treated pasteurization milk.
UHC3): Non-treated ultra high temperature milk.
UHT4): Treated ultra high temperature milk.
preliminary experiment, lactic acid bacteria were not detected in the early stage. however lactic acid bacteria were not de- tected in ultra high temperture milk at 4 days of storage at 30℃ but in the low temperature sterilized milk, 2.0×10
8of lactic acid bacteria were detected. Lactic acid bacteria did not increase as the storage period was increased and the con- dition of the medium, in which the lactic acid bacteria in- creased at a low pH, could not grow. Lactic acid bacteria were not produced during the storage period in ultra high temper- ture milk. The pH of the lactic acid fermented food was ranged from 4.10 to 4.16 as a result of 20 weeks of storage(Ko
& Kang, 1990). The sherbet mixed with 20% of Tarak was measured to be 7.32 Log CFU/g, And in case of 50% treat- ment, it showed lactic acid bacterium content of 8.35~8.49 Log CFU/g (Ko et al., 2014) In this experiment, pH was de- creased with increasing number of harmful bacteria It is thought that the proliferation of lactic acid bacteria did not appear.
3.5. Fatty Acid Content
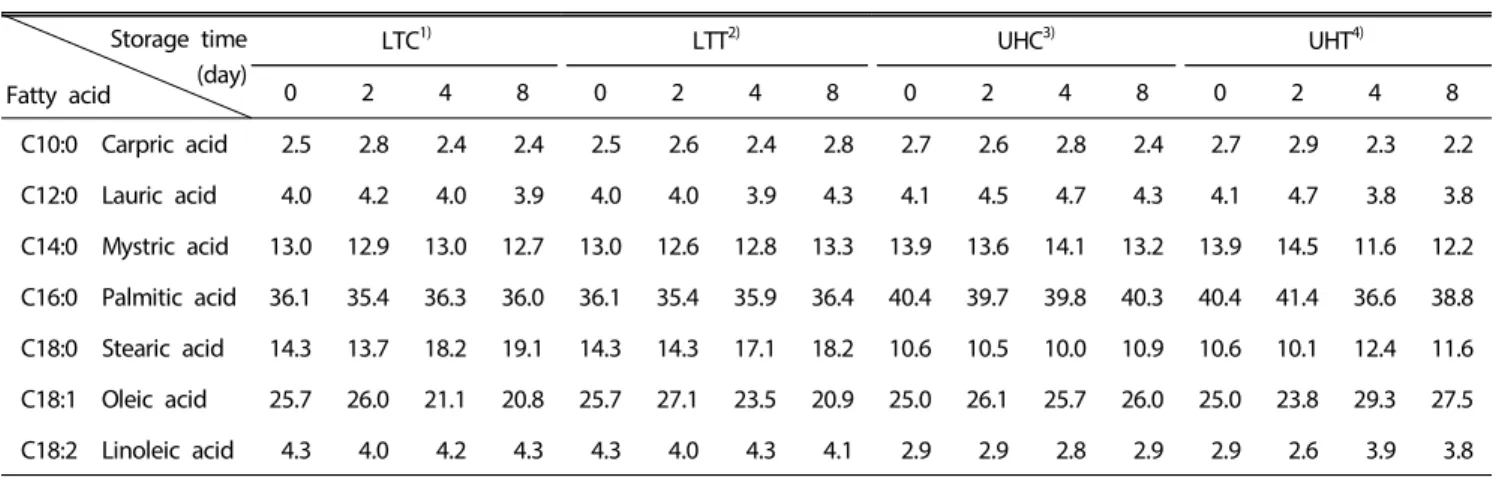
Table 5 showed the fatty acid content of milk with different physical treatments according to storage period. Since fatty acids of milk have a low level of fatty acid content, they have a characteristic smell of milk. In this experiment, fatty acid contents were measured by area ratio in the range of C
10:0~ C
18:2in order to observe the change of unsaturated fatty acid content which could easily occur during storage. At the 0th day of storage, the saturated fatty acid content of palmitic acid was the highest at 35.4~41.4% in both pasteurized and
Table 5. Fatty acid compositions changes of commercial and treated milk during storage at 30℃ (Unit: Area%) Storage time
(day) Fatty acid
LTC1) LTT2) UHC3) UHT4)
0 2 4 8 0 2 4 8 0 2 4 8 0 2 4 8
C10:0 Carpric acid 2.5 2.8 2.4 2.4 2.5 2.6 2.4 2.8 2.7 2.6 2.8 2.4 2.7 2.9 2.3 2.2
C12:0 Lauric acid 4.0 4.2 4.0 3.9 4.0 4.0 3.9 4.3 4.1 4.5 4.7 4.3 4.1 4.7 3.8 3.8
C14:0 Mystric acid 13.0 12.9 13.0 12.7 13.0 12.6 12.8 13.3 13.9 13.6 14.1 13.2 13.9 14.5 11.6 12.2 C16:0 Palmitic acid 36.1 35.4 36.3 36.0 36.1 35.4 35.9 36.4 40.4 39.7 39.8 40.3 40.4 41.4 36.6 38.8 C18:0 Stearic acid 14.3 13.7 18.2 19.1 14.3 14.3 17.1 18.2 10.6 10.5 10.0 10.9 10.6 10.1 12.4 11.6 C18:1 Oleic acid 25.7 26.0 21.1 20.8 25.7 27.1 23.5 20.9 25.0 26.1 25.7 26.0 25.0 23.8 29.3 27.5
C18:2 Linoleic acid 4.3 4.0 4.2 4.3 4.3 4.0 4.3 4.1 2.9 2.9 2.8 2.9 2.9 2.6 3.9 3.8
LTC1): Non-treated pasteurization milk.
LTT2): Treated pasteurization milk.
UHC3): Non-treated ultra high temperature milk.
UHT4): Treated ultra high temperature milk.