INTRODUCTION
The population of the elderly in Korea has in- creased rapidly by the advanced medicine and in- dustrial development since 1970. The proportion of the population aged 65 years and over has increased approximately to four-fold over the past 40 years, from 3.1% in 1970 to 11% in 2010. It will be expected for Korea to enter the super-aged society in 2026 (Statistics Korea). Moreover, there have been changes in disease and diet patterns. Recently, nutritional re- search has considered epigenetics that nutrient fac- tor mainly influence on preventing chronic diseases and contribute to the successful aging and lon- gevity as well (Gaudreau P et al 2007; Ozaki A et al
2007). Because it has been known that the elderly population has been considered serious mal-nu- trition group, recently, it has been started to research on the effect of dietary patterns and nutrition for the elderly in Korean. In the previous study, Korea elderly takes the Korean traditional diet characterized as a low-fat and low- calorie and consisted of white rice, soup and plant foods (Song Y et al 2005). There are several reports that white rice consumption has been affected to deteriorate glucose metabolism. The oth- er hands, there are still conflictions whether there is association between elevated intakes of white rice and increased risks of metabolic disorder or not (Wa- tanabe Y et al 2013). Especially, for the Korean elderly who are easily in mal-nutrition, white rice consump- Culinary Science and Hospitality Research (October 2015)
Vol. 21, No. 5, pp. 147-159
Study on White Rice Consumption and Metabolic Risk Factor in Korean Elderly: Focused on Muscle Mass
Chorong Oh
1, Jae-Kyung No
2¶1
Dept. of Hospitality & Tourism Management, Kyungsung University, Korea
2
Dept. of Food Science & Biotechnology, Kyungsung University, Korea
ABSTRACT: White rice consumption, a staple food for the Korean influence the other food consumption and nutrition balance. The aim of this study was to investigate the association with rice consumption based dietary intake and muscle mass for the Korean elderly who are easily in mal-nutrition. A total of 1,433 subjects (658 male and 775 female) 60 years or older from the fifth Korea National Health and Nutritional Examination Survey 2010 participated in this study. One of the findings was that there was association white rice consumption and marital status (single/with/without spouse) as well as education for men. Other interesting finding was the member of highest white rice consumption group showed higher muscle mass in both sexes. The other finding was that the more white rice consumption group showed the less meat consumption as well as the less consumption of other grains, noodle & dumpling, and flours & bread in both sexes. We found the significant association between white rice consumption level and muscle mass and several metabolic syndrome related factors in the elderly. But the association with white rice consumption and glucose metabolism related factor had not shown consistently.
Keywords: white rice consumption, Korean elderly, nutrient, socio-demographic factors, metabolic risk fac- tor
¶ Corresponding Author: Jae-Kyung No, Dept. of Food Science & Biotechnology, Kyungsung University, 309, Suyeong-ro, Nam-gu,
Busan 48434, Korea, Tel. +82-51-663-4651, E-mail: [email protected]
tion, a staple food for the Korean could influences the other food consumption and increase nutrition balance. Aging causes many functional deteriorate and typically body composition changes such as a progressive muscle mass loss and an increased fat mass called sarcopenia (Zamboni M et al 2008). Re- duced muscle mass influence to insulin sensitivity negatively which is associated with an increase of the risk of metabolic syndromes by fat infiltration in the skeletal muscle (Roubenoff R 2000). Muscle loss in the elderly causes metabolic syndrome, cardiovas- cular disease, and fracture, and cancer (Zamboni M et al 2008). Despite muscle loss could be much wors- ened in the future, it is often under-recognized and lack of data on muscle mass and nutrient in the elderly. There is research on the higher of rice con- sumption had significantly higher intakes of nutrients and lower waist circumference and triceps skinfolds (Kennedy E, Luo H 2015). By Jo N, Kim SY(2015). The Korean diet was nutritional imbalance because of ex- cessive amounts of rice consumption in the 1970s.
Since the 1980s, drastically decreased rice consump- tion has become a serious social problem. So far, the study regarding white rice consumption and health status is rare. According to dietary pattern, nutrient contents of diet are different, so to be performed the research on the rice consumption based dietary in- take are so important and association with muscle mass for the Korean elderly. Developing an inter- active and friendly information system could also change meal quality of catering menu in senior cen- ter or nursing home.
LITERATURE REVIEW
White rice consumption and matabolic risk factors Traditional Korean diet composed of rice and sev- eral side dishes containing a variety of nutrients are known to be effective in the prevention of metabolic diseases (Ahn JY, Ha TY 2010). Central obesity, hy- pertension, blood sugar, and abnormal serum lipid levels that lead to an increased likelihood of car- diovascular disease (CVD) are the major causes of early death in both sexes in developed countries in- clude Korea. (Graham I et al 2007 & Kadowaki T et al 2005). In the prevention of metabolic risk, dietary pattern approaches are more cost-effective, much
safer, and more proper than medical approaches (Graham I et al 2007 & Azadbakht L et al 2011). There are many studies on the effects of the white rice con- sumption to metabolic risk factors in western coun- try but not in asian, especially, focused on muscle mass. By Watanabe (Watanabe Y et al 2013), there were positive correlations with rice intake and met- abolic disease in the 40–9 and 50–9 age groups, whereas in the 60 such as BMI, waist circumference and metabolic disease decreased with increasing rice consumption in the aged 60–4 yrs men. Many re- searcher suggest that older individuals have under- gone easily mal-nutrition, so they advised rice con- sumption by three times a day in reasonable quanti- ties could increase other nutrients as well (Wata- nabe Y et al 2013). Recently, evidence displayed that rice intake could protect against risk of mortality from cardiovascular diseases(Eshak ES et al 2011). So, the association between carbohydrate intake from refined grains, such as white rice and CVD risk factors still remain uncertain (Eshak ES et al 2011).
METHODS AND MATERIALS
Subjects
This study was based on data obtained from the KNHANES 2010, a nationally representative survey conducted by the Korean Ministry of Health and Welfare. The survey’s target population included non-institutionalized Korean civilians. Sampling units consisted of households selected through a stratified, multistage, probability-sampling design based on geographic area, sex, and age group using house- hold registries (Oh C et al 2015). KNHANES 2010 con- sisted of four components: a health interview survey, a health behaviors survey, a health examination sur- vey, and a nutrition survey. These surveys were com- pleted by 8473 (77.5% of the total target population of 10,938) participants in 2010 (Oh C et al 2015). A total of 1,687 subjects (748 male and 939 females) 60 years or older who participated in the health ex- amination and nutrition surveys were included in this study. We excluded those who did not have data on oral daily nutrition intake, and had not undergone blood tests.
Data Collection
Details of the measurement have been described as follow. In brief, health examination, dietary mea- surement, height, and weight were obtained using standardized techniques and calibrated equipment.
Information on socio-demographic factors, such as gender, age, level of education, income, drinking, smoking and marital status, and more specific in- formation regarding sex and white rice consumption were obtained by a personal interview with a struc- tured questionnaire. Body mass index (BMI) was cal- culated by dividing weight (kg) by height (m
2). Blood pressure was measured using a sphygmomanometer with the subject in a sitting position. Three measure- ments were taken at 5-min intervals in the morning after having fasted for at least 8 h, and the average of the second and third measurements was used.
Fasting glucose, fasting insulin, homeostasis model assessment of insulin resistance (HOMA-IR), total cho- lesterol, triglycerides (TG), and high-density lipopro- tein (HDL) were analyzed in a central, certified labo- ratory. A dual-energy X-ray absorptiometry (DXA) scan was performed to measure total body fat mass, total body fat percentage, and lean mass using fan-beam technology (Lunar Corp, Madison, WI). A general questionnaire was administered to assess ba- sic demographic and health-related information. Die- tary intake was measured by the single 24-h dietary recall method and trained staff instructed the re- spondents to recall and describe all the foods and beverages they had consumed in the previous day.
Food models and measuring bowls, cups, and spoons were used to assist in estimating portion sizes. Sub- jects were further classified into four groups based on daily energy intake from white rice consumption - quartiles (Q1–Q4): Q1 (≤542.90 Kcal), Q2 (542.91 Kcal~801.26 Kcal), Q3 (801.27 Kcal~1,080.56 Kcal), Q4 (1,080.57 Kcaly~3807.34 Kcal).
Definition of Appendicular Skeletal Muscle Ma- ss and Obesity
Appendicular skeletal muscle mass (ASM, kg) was defined as the sum of lean soft tissue mass in the arms and legs following the method of Heymsfield et al (Heymsfield SB et al 1990). We calculated ASM as a percentage of body weight (Wt), modifying methods published by Janssen et al (2002) and Lim
S et al (2010), respectively. Obesity classification was determined according to the BMI criteria established by the Obesity Task Force (IOTF), World Health Orga- nization (WHO) and the Korean Society for the Study of Obesity (KSSO) (Oh SW 2011).
Definition of Metabolic Syndrome Risk Factors We employed the original criteria for metabolic syndrome proposed by the National Cholesterol Edu- cation Program (NCEP) Adult Treatment Panel III.
However, we used ethnicity-specific WC values, as proposed by the International Diabetes Federation (IDF) (Oh C et al 2015). Obesity was assessed based on the BMI cut-offs proposed by the World Health Organization (WHO). Metabolic syndrome were de- fined as having three or more of the following five criteria: Abdominal obesity was defined as waist cir- cumference >90 cm in males and >80 cm in females;
hypertriglyceridemia as triglycerides ≥150 mg/dL; low HDL cholesterol as <40 mg/dL in males and <50 mg/dL in females; hypertension as blood pressure ≥ 130/85 mmHg; and hyperglycemia as fasting plasma glucose ≥110 mg/dL (Oh C et al 2015).
Statistical Analyses
All statistical analyses were conducted using SPSS version 20.0 (SPSS, IBM, NY, USA). The generalized li- near model was used to compare numerical variables such as anthropometric measurements, metabolic risk factors, and nutrient intakes among the four groups classified by white rice consumption quartile.
Adjustments for age, sex. Data are presented as means±SE. Chi-square test for categorical variables.
Logistic regression models were used to calculate odds ratios (ORs) with 95% confidence intervals (CIs) for the relationships between white rice consump- tion and metabolic syndrome risk factors. The level of significance was set at p<0.05.
RESULT
The prevalence of metabolic syndrome and meta-
bolic abnormality according to sex among the elderly
are presented in Table 1. Age adjusted prevalence of
metabolic syndrome was 20.4% in men and 27.0% in
women. There were significantly different between
Metabolic syndrome and metabolic abnormality Men (n=748)
Women
(n=939) p
1)Waist circumference (Male 90, Female 80) 217(30.9)
2)393(43.4) 0.001
Blood pressure ( 130/85 mmHg) 160(22.8) 206(22.3) 0.856
Fasting blood glucose ( 110 mg/dL) 304(39.5) 288(31.4) 0.004
Triglyceride ( 150 mg/dL) 557(31.6) 347(13.2) 0.784
HDL cholesterol (male 40, female 50 mg/dL) 171(23.4) 401(40.4) 0.001 Metabolic syndrome ( 3 or more of the risk factors) 153(20.4) 257(27.0) 0.006 1) P from chi-square test. p<.05.
2) Categorical variables are given as numbers and percentages.
Table 1. Metabolic risk factors by sex
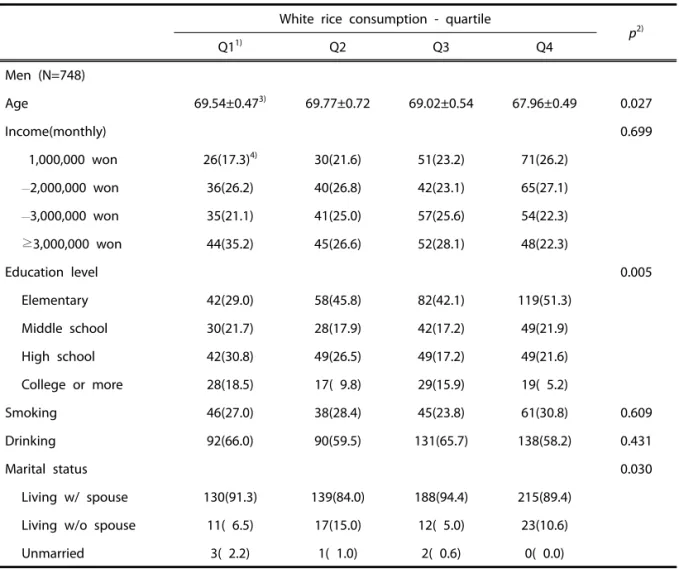
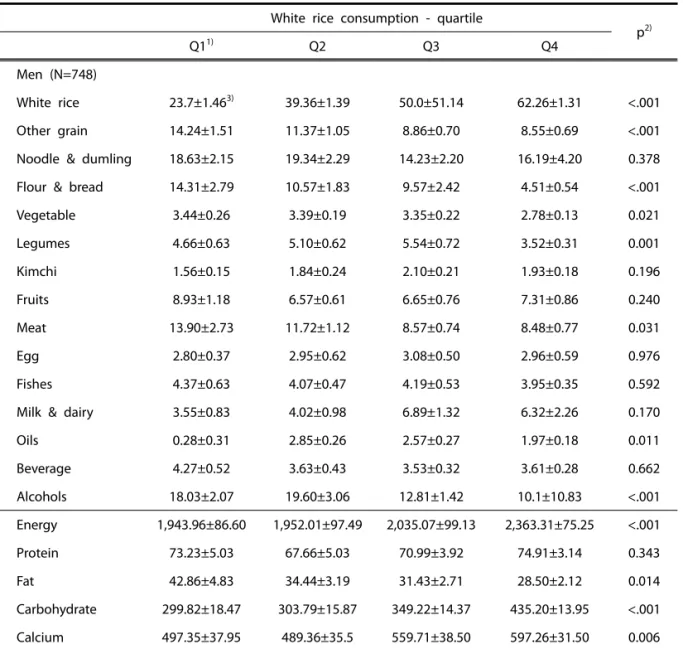
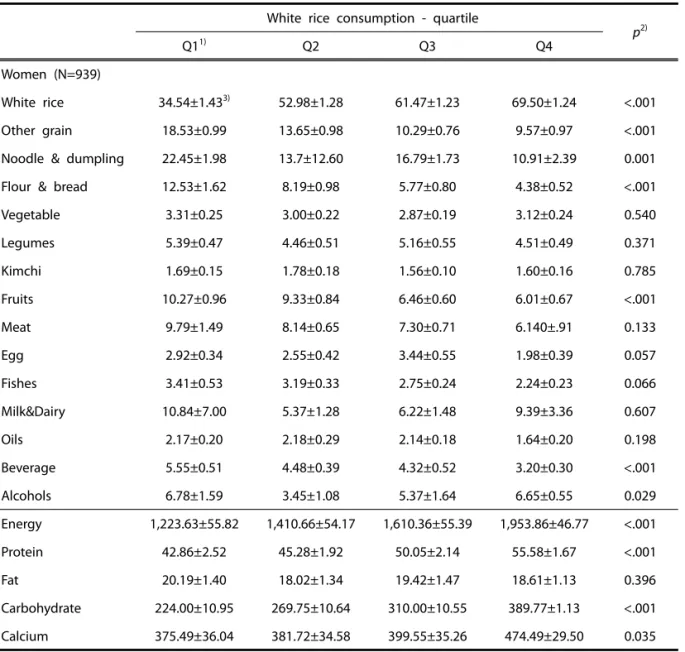
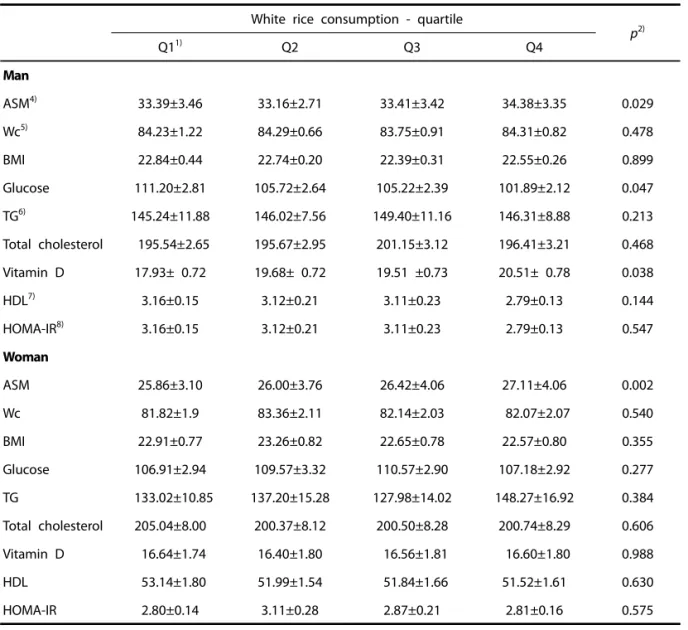
sex and the prevalence of metabolic syndrome, WC, fasting blood glucose and HDL abnormality. The prevalence of WC (30.9% in men vs 43.4 in women, p<.001) and HDL (23.4% in men vs 40.4 in women, p<.001) abnormality was higher in women than in the men. The fasting blood glucose (39.5% in men vs 31.4 in women, p=0.004) was contrary. Table 2 and Table 3 present demographic characteristics and white rice consumption by sex. There were signifi- cantly different between white rice consumption and age, education level, marital status in men and edu- cation level only in women. Men showed that there were significantly different other grain, flour bread, vegetable, legumes, meat, oils, alcohols among 24 food groups were categorized. And for wo- men, oth- er grain, noodle & dumpling, flour & bread, fruits, beverage, and alcohols. Members of the highest white rice consumption group were more likely to be older, and subject with spouse. In women, members of the highest white rice consumption group were more likely to have fewer intakes of meat, other grain, noodle, and flour as well. The rice consump- tion in women was higher than men. The anthro- pometric and metabolic risk factors according to white rice consumption adjusted age, sex, smoking, diabetics are presented in Table 6. There were sig- nificantly different between white rice consumption and ASM related muscle mass, fasting blood glucose, vitamin D in men and ASM only in women. There was significantly increased muscle mass, depend- ing on the increased rice consumption in both se- xes.
DISCUSSION
In this study, we explore the association between white rice consumption level and metabolic risk fac- tors and food/nutrient intake as well. There is believe that white rice consumption has been affected to de- teriorate glucose metabolism because refined rice is negative for insulin sensitivity, but brown rice is positive. However, the association between increased white rice consumption and increased risks of devel- oping metabolic disorder remains unclear. We found that the member of highest white rice consumption group showed to have higher muscle mass in both sexes. White rice, which is a staple food for the Korean elderly, contributes major energy source of meal and for last 10 year, and it has been the top of the ranking of favorite food, and pork, kimchi stew ins next (Ahn EM et al 2011). Despite the changes in the westernization of diet, ages 6 and over of Korean still showed white rice is kept the top of favorite food (Ahn EM et al 2011). The rice consumption began to decline steadily since the 1970s (Lee GL & Kim MJ 2003) but annual per capita consumption of meat is increasing to 30.5kg in 1998 and 35.6kg in 2008 (Statistics Korea). The westernized diet and the in- creased the replacement food is affecting the re- duced consumption of rice (Yoon HS et al 2005).
After introduced the westernized diet, rice con-
sumption in Korean decreased and at the same time,
alternative food like flour product, bread, and noodle
increased (Ryu HK 2003). Due to this phenomenon,
flour consumption as a main ingredient has been in-
creased continuously, but rice consumption tend to reduce relatively (Statistics Korea). By Baxter et al (2006), diet rich in whole-grains, vegetables, fruits and dairy has influenced against metabolic syndro- me. The Korean diet based rice rich and various veg- etables include kimchi is traditionally high in carbo- hydrate, low in fat, and abundant in vegetables and legumes. This means adequate white rice con- sumption is especially important for Korean elderly to maintain their healthy aging for the advantages of Korean traditional diet. Centenarians in many regions
of the world have in common likely very much phys- ical activity, non-obese, consumed a lot of plant foods than animal foods (Hausman DB et al 2011). By Oh C et al(2014), traditional diet pattern has much positive part like low calorie, fat intake, and more plant food intake but considering the body composi- tion, consumption of protein, calcium and vitamin D should be increased for the Korean elderly. Rice con- sumption in the US is much lower compared to Asian countries such as Korea, Japan, and China (Batres- Marquez SP et al 2009), but the consumption is in- White rice consumption - quartile
p
2)Q1
1)Q2 Q3 Q4
Men (N=748)
Age 69.54±0.47
3)69.77±0.72 69.02±0.54 67.96±0.49 0.027
Income(monthly) 0.699
1,000,000 won 26(17.3)
4)30(21.6) 51(23.2) 71(26.2)
—
2,000,000 won 36(26.2) 40(26.8) 42(23.1) 65(27.1)
—
3,000,000 won 35(21.1) 41(25.0) 57(25.6) 54(22.3)
≥3,000,000 won 44(35.2) 45(26.6) 52(28.1) 48(22.3)
Education level 0.005
Elementary 42(29.0) 58(45.8) 82(42.1) 119(51.3)
Middle school 30(21.7) 28(17.9) 42(17.2) 49(21.9)
High school 42(30.8) 49(26.5) 49(17.2) 49(21.6)
College or more 28(18.5) 17( 9.8) 29(15.9) 19( 5.2)
Smoking 46(27.0) 38(28.4) 45(23.8) 61(30.8) 0.609
Drinking 92(66.0) 90(59.5) 131(65.7) 138(58.2) 0.431
Marital status 0.030
Living w/ spouse 130(91.3) 139(84.0) 188(94.4) 215(89.4)
Living w/o spouse 11( 6.5) 17(15.0) 12( 5.0) 23(10.6)
Unmarried 3( 2.2) 1( 1.0) 2( 0.6) 0( 0.0)
All model were adjusted by sex and age.
1) Energy from white rice consumption (Q1~Q4): Q1(≤542.90), Q2(542.91~801.26), Q3(801.27~1080.56), Q4(1,080.57
~3,807.34),
2) P from chi-square test for categorical variables. Differences were tested using generalized linear model for numer- ical variables. p<.05.
3) Numerical variables are given as means±SE.
4) Categorical variables are given as numbers and percentages.
Table 2. The relationship between socio-demographic factors and white rice consumption for men
creasing rapidly. According to the data from U.S.
Department of Agriculture 2009 (Food and Nutrient Database for Dietary Studies), more than 70% of rice consumed is white rice as well as increased rice consumption. Some researchers are concerned that refined rice has negative effect on insulin related disease. Replace white rice to brown rice may lower risk of type 2 diabetes (Sun Q et al 2010). However, different perspective for white rice consumption is needed to remind for the healthy elderly. Even though the elderly are exposed to nutritional prob-
lems such as loss of appetite, bad teeth etc, in- creased white rice consumption which is most favor- able food in Korean elderly may have benefit for them to reduce malnutrition rate (Park MY et al 2006). One of findings was the more white rice con- sume and the less meat consume and other grains, noodle & dumpling, flours & bread in both sexes as well. Nutrients intake varies according to the type of dietary patterns (Ryu HK 2003). Some researchers have suggested that the most important environ- mental factors affecting longevity are proper nu- White rice consumption - quartile
P
2)Q1
1)Q2 Q3 Q4
Women (N=939)
Age (yr) 69.21±0.54
3)70.35±0.57 71.03±0.59 71.11±0.75 0.066
Income(monthly) (%) 0.166
1,000,000 won 48(18.3)
4)61(24.3) 61(29.1) 57(28.8)
—
2,000,000 62(20.6) 63(24.8) 53(25.5) 47(25.4)
—
3,000,000 75(29.2) 68(27.6) 48(25.4) 45(26.8)
3,000,000 83(31.9) 62(23.3) 48(20.0) 27(26.8)
Education level <.001
Elementary 183(74.5) 197(83.8) 183(89.7) 157(93.2)
Middle school 30(10.1) 28( 8.9) 16( 7.1) 11(4.3)
High school 42(10.6) 23( 6.1) 10( 3.0) 4( 2.0)
College or more 11( 4.7) 4( 1.1) 1( 0.2) 1( 0.5)
Smoking 12( 5.2) 7( 3.1) 8( 3.0) 6( 3.7) 0.723
Drinking 49(18.9) 52(18.7) 40(21.1) 38(21.9) 0.889
Marital status 0.845
Living w/ spouse 146(48.7) 143(47.5) 119(48.4) 102(53.9)
Living w/o spouse 126(50.9) 115(52.1) 95(51.6) 75(45.7)
Unmarried 2( 0.5) 1( 0.4) 0( 0.0) 1( 0.4)
All model were adjusted by sex and age.
1) Energy from white rice consumption (Q1–Q4): Q1(≤542.90), Q2(542.91~801.26), Q3(801.27~1,080.56), Q4(1,080.57
~3,807.34).
2) P from chi-square test for categorical variables. Differences were tested using generalized linear model for numer- ical variables. p<.05.
3) Numerical variables are given as means±SE.
4) Categorical variables are given as numbers and percentages.
Table 3. The relationship between socio-demographic factors and white rice consumption for women
trition and eating habits (Takeda S et al1998). By re- search with Tokyo area Centenarians by Shimizu K et al (2003), reported higher dairy intake associated with longevity. In present study, the highest white rice consumption group showed that highest calorie intake and muscle generation related nutrient such as protein, calcium intake is highest while lowest fat intake. So the member of highest white rice con- sumption group showed to have higher muscle mass
in both sexes in the present research. The keeping balance of body composition like high muscle mass and low fat mass is important for the elderly. The re- search with 1,433 subjects (658 men and 775 wom- en) who were 60 years or older by Oh C et al(2015) reported that the prevalence of sarcopenic obesity, muscle mass loss and increased fat mass, is related with metabolic syndrome and more in women (31.3%) than in men (19.6%). Individuals with sarco-
White rice consumption - quartile
p
2)Q1
1)Q2 Q3 Q4
Men (N=748)
White rice 23.7±1.46
3)39.36±1.39 50.0±51.14 62.26±1.31 <.001
Other grain 14.24±1.51 11.37±1.05 8.86±0.70 8.55±0.69 <.001
Noodle & dumling 18.63±2.15 19.34±2.29 14.23±2.20 16.19±4.20 0.378 Flour & bread 14.31±2.79 10.57±1.83 9.57±2.42 4.51±0.54 <.001
Vegetable 3.44±0.26 3.39±0.19 3.35±0.22 2.78±0.13 0.021
Legumes 4.66±0.63 5.10±0.62 5.54±0.72 3.52±0.31 0.001
Kimchi 1.56±0.15 1.84±0.24 2.10±0.21 1.93±0.18 0.196
Fruits 8.93±1.18 6.57±0.61 6.65±0.76 7.31±0.86 0.240
Meat 13.90±2.73 11.72±1.12 8.57±0.74 8.48±0.77 0.031
Egg 2.80±0.37 2.95±0.62 3.08±0.50 2.96±0.59 0.976
Fishes 4.37±0.63 4.07±0.47 4.19±0.53 3.95±0.35 0.592
Milk & dairy 3.55±0.83 4.02±0.98 6.89±1.32 6.32±2.26 0.170
Oils 0.28±0.31 2.85±0.26 2.57±0.27 1.97±0.18 0.011
Beverage 4.27±0.52 3.63±0.43 3.53±0.32 3.61±0.28 0.662
Alcohols 18.03±2.07 19.60±3.06 12.81±1.42 10.1±10.83 <.001
Energy 1,943.96±86.60 1,952.01±97.49 2,035.07±99.13 2,363.31±75.25 <.001
Protein 73.23±5.03 67.66±5.03 70.99±3.92 74.91±3.14 0.343
Fat 42.86±4.83 34.44±3.19 31.43±2.71 28.50±2.12 0.014
Carbohydrate 299.82±18.47 303.79±15.87 349.22±14.37 435.20±13.95 <.001
Calcium 497.35±37.95 489.36±35.5 559.71±38.50 597.26±31.50 0.006
All model were adjusted by sex and age.
1) Energy from white rice consumption (Q1~Q4): Q1(≤542.90), Q2(542.91~801.26), Q3(801.27~1,080.56), Q4 (1,080.57~3,807.34).
2) Differences were tested using generalized linear model for numerical variables. p<.05.
3) Numerical variables are given as means±SE.
Table 4. The relationship between white rice consumption and nutrient intake for men
penic obesity had significantly higher fasting insulin, homeostasis model assessment of insulin resistance, and triglycerides (Oh C et al 2015). Other interesting finding was that the member of highest white rice consumption group showed insulin abnormality re- lated factors like fasting glucose, HOMA IR, and weight became reduced. As consider with result of food group intake according to white rice con- sumption, we could presume that their rich in pro-
tein, calcium intake and low in fat diet reduced in- flammation which could degrade muscle by cytokine.
Additionally, less consumed simple sugars such as flour & bread and noodle & dumpling or alcohol which could cause metabolic abnormality in the highest white rice consumption group. On the other hand, other results on effect of white rice/ rice con- sumption and CVD (Izadi V & Azadbakht L 2015 &
Muraki I et al 2015 & Khosravi-Boroujeni H et al 2013
White rice consumption - quartile
p
2)Q1
1)Q2 Q3 Q4
Women (N=939)
White rice 34.54±1.43
3)52.98±1.28 61.47±1.23 69.50±1.24 <.001
Other grain 18.53±0.99 13.65±0.98 10.29±0.76 9.57±0.97 <.001
Noodle & dumpling 22.45±1.98 13.7±12.60 16.79±1.73 10.91±2.39 0.001 Flour & bread 12.53±1.62 8.19±0.98 5.77±0.80 4.38±0.52 <.001
Vegetable 3.31±0.25 3.00±0.22 2.87±0.19 3.12±0.24 0.540
Legumes 5.39±0.47 4.46±0.51 5.16±0.55 4.51±0.49 0.371
Kimchi 1.69±0.15 1.78±0.18 1.56±0.10 1.60±0.16 0.785
Fruits 10.27±0.96 9.33±0.84 6.46±0.60 6.01±0.67 <.001
Meat 9.79±1.49 8.14±0.65 7.30±0.71 6.140±.91 0.133
Egg 2.92±0.34 2.55±0.42 3.44±0.55 1.98±0.39 0.057
Fishes 3.41±0.53 3.19±0.33 2.75±0.24 2.24±0.23 0.066
Milk&Dairy 10.84±7.00 5.37±1.28 6.22±1.48 9.39±3.36 0.607
Oils 2.17±0.20 2.18±0.29 2.14±0.18 1.64±0.20 0.198
Beverage 5.55±0.51 4.48±0.39 4.32±0.52 3.20±0.30 <.001
Alcohols 6.78±1.59 3.45±1.08 5.37±1.64 6.65±0.55 0.029
Energy 1,223.63±55.82 1,410.66±54.17 1,610.36±55.39 1,953.86±46.77 <.001
Protein 42.86±2.52 45.28±1.92 50.05±2.14 55.58±1.67 <.001
Fat 20.19±1.40 18.02±1.34 19.42±1.47 18.61±1.13 0.396
Carbohydrate 224.00±10.95 269.75±10.64 310.00±10.55 389.77±1.13 <.001
Calcium 375.49±36.04 381.72±34.58 399.55±35.26 474.49±29.50 0.035
All model were adjusted by sex and age.
1) Energy from white rice consumption (Q1~Q4): Q1(≤542.90), Q2(542.91~801.26), Q3(801.27~1,080.56), Q4 (1,080.57~3,807.34).
2) Differences were tested using generalized linear model for numerical variables. p<.05.
3) Numerical variables are given as means±SE.
Table 5. The relationship between white rice consumption and nutrient intake for women
& Eshak ES 2014) showed that it seems that there is no significant correlation between white rice con- sumption and incidence of CVD, metabolic disease and its mortality. Meta-analysis by Vajihe Izadi (Izadi V & Azadbakht L 2015) showed a positive association between white rice intake and risk factors of CVD in- cluding metabolic syndrome and type 2 diabetes. In present study, the rice consumption of elderly wom-
en was higher than men. We found that for men, white rice consumption and marital status having spouse have affected rice consumption but educa- tion for women. In several researches, nutritional sta- tus of the elderly is different by gender rather than age (Choe JS et al 2004). Generally, the elderly has been a typical poor nutrition in rural areas of Korea, elderly women, elderly people living alone, and low-
White rice consumption - quartile
p
2)Q1
1)Q2 Q3 Q4
Man
ASM
4)33.39±3.46 33.16±2.71 33.41±3.42 34.38±3.35 0.029
Wc
5)84.23±1.22 84.29±0.66 83.75±0.91 84.31±0.82 0.478
BMI 22.84±0.44 22.74±0.20 22.39±0.31 22.55±0.26 0.899
Glucose 111.20±2.81 105.72±2.64 105.22±2.39 101.89±2.12 0.047
TG
6)145.24±11.88 146.02±7.56 149.40±11.16 146.31±8.88 0.213
Total cholesterol 195.54±2.65 195.67±2.95 201.15±3.12 196.41±3.21 0.468
Vitamin D 17.93± 0.72 19.68± 0.72 19.51 ±0.73 20.51± 0.78 0.038
HDL
7)3.16±0.15 3.12±0.21 3.11±0.23 2.79±0.13 0.144
HOMA-IR
8)3.16±0.15 3.12±0.21 3.11±0.23 2.79±0.13 0.547
Woman
ASM 25.86±3.10 26.00±3.76 26.42±4.06 27.11±4.06 0.002
Wc 81.82±1.9 83.36±2.11 82.14±2.03 82.07±2.07 0.540
BMI 22.91±0.77 23.26±0.82 22.65±0.78 22.57±0.80 0.355
Glucose 106.91±2.94 109.57±3.32 110.57±2.90 107.18±2.92 0.277
TG 133.02±10.85 137.20±15.28 127.98±14.02 148.27±16.92 0.384
Total cholesterol 205.04±8.00 200.37±8.12 200.50±8.28 200.74±8.29 0.606
Vitamin D 16.64±1.74 16.40±1.80 16.56±1.81 16.60±1.80 0.988
HDL 53.14±1.80 51.99±1.54 51.84±1.66 51.52±1.61 0.630
HOMA-IR 2.80±0.14 3.11±0.28 2.87±0.21 2.81±0.16 0.575
All model were adjusted by sex, age, smoking and diabetes.
1) Energy from white rice consumption (Q1~Q4): Q1(≤542.90), Q2(542.91~801.26), Q3(801.27~1,080.56), Q4 (1,080.57~3,807.34).
2) Differences were tested using generalized linear model for numerical variables. p<.05.
3) Numerical variables are given as means±SE. d. Appendicular skeletal muscle mass (ASM) was measured by DXA.
4) Wc; waist circumference(cm) 5) TG; triglycerides(nmol/l) 6) HDL; high-density lipoprotein(nmol/l) 7) HOMA-IR; ho- moeostasis model assessment of insulin resistance.
Table 6. The relationship between white rice consumption and metabolic risk measurement by sex
income seniors. According to KNHANES 2005 (Choe JS et al 2004), 65 years and over elderly showed lack of intake of riboflavin, vitamin C, vitamin A as well as calcium, while over intake of sodium. For the eld- erly women, in general, energy (94.0%), calcium (63.9%), potassium (50.9%), thiamine (82.6%), ribo- flavin (68.3%), niacin (92.7%), and vitamin C (80.8%) to less than the DRIs reference was shown (Choe JS et al 2006). Data from Department of Health and Human Services 2007 reported that the elderly living alone have been increasing 18% of total elderly pop- ulation and among them, skipping meals at least once a week to 17%, also more than five times the ratio to 9.8% (Park MY et al 2006). The lower levels of education and economic condition showed poor nutrition in the elderly (Choe JS et al 2006). There were several limitations in this study. First, the cross-sectional design of this study precluded our ability to identify on causal inference between white rice consumption and socio-demographic factors, metabolic risk factors and food/nutrient. Second, all participants in the present study were relatively healthy because those who were admitted to hospi- tal or nursing homes were not included in KNHANES.
Therefore, in the present study, the mean values of metabolic risk factors may have been underesti- mated. Third, at the population level, 24-h recall whi- ch might not represent accurate usual intake could be one of another limitation in our study. We could not control for all of epigenetic influence, thus, these results need to be confirmed by additional study with longitudinal data to make it possible to general- ize the results. In conclusion, there are various health problems due to malnutrition in aging. Therefore, the study on diet pattern by white rice consumption which is staple food in Korean elderly and socio-de- mographic factors influenced the onset of chronic diseases like metabolic syndrome is very important.
In Korea, improvement of nutrition policy and the transition of the management system in order to im- prove the quality of life of people by reduction of in- cidence and prevalence of various chronic diseases is need. We found the significant association between white rice consumption level and muscle mass and several metabolic syndrome related factors in the elderly. But results regarding white rice consumption and glucose metabolism related factor had not
shown the consistent results. Thus, present study provides that justification for Korean elderly should be start early with modification of diet by adequate white rice consumption which could improve muscle mass by taking nutrient-rich foods intake.
REFERENCES
Ahn EM, Kang MS, Gong JE, Choe JS, Park YH, Lee JY, Kim HR (2011). The changes of energy nu- trient intake, frequently consumed dishes and staple food consumption-based on the first to the forth (1998~2008) Korea National Health and Nutrition Examination Survey (KNHANES I~
IV-2)-. The Korean Journal of Community Living Science 22(4):669-678.
Ahn, JY, Ha TY (2010). Nutritional superiority of rice.
Food Preserv Process Ind 9(2):60-62.
Azadbakht L, Fard NRP, Karimi M, Baghaei MH, Surkan PJ, Rahimi M, Willett WC (2011). Effects of the dietary approaches to stop hypertension (DASH) eating plan on cardiovascular risks am- ong type 2 diabetic patients a randomized cross- over clinical trial. Diabetes Care 34(1): 55-57.
Batres-Marquez SP, Jensen HH, Upton J (2009). Rice consumption in the United States: Recent evi- dence from food consumption surveys. Journal of the American Dietetic Association 109(10):1719- 1727.
Baxter AJ, Coyne T, McClintock C (2006). Dietary pat- terns and metabolic syndrome-a review of epi- demiologic evidence. Asia Pacific Journal of Clini- cal Nutrition 15(2):134.
Choe JS, Paik HY, Kwon SO (2004). Nutritional status and related factors of residents aged over 50 in longevity areas: I. Anthropometric and biochem- ical nutritional status. Korean Journal of Nutrition 37(9):825-837.
Choe JS, Kwon SO, Paik HY (2006). Nutritional status and related factors of residents aged over 50 in longevity areas: II. Effect of dietary factors on bone ultrasound measurements in aged men.
Korean Journal of Nutrition 39(2):171-183.
Eshak, ES, Iso H, Date C, Yamagishi K, Kikuchi S,
Watanabe Y, Tamakoshi A (2011). Rice intake is
associated with reduced risk of mortality from
cardiovascular disease in Japanese men but not
women. The Journal of Nutrition 141(4):595-602.
Eshak ES, Iso H, Yamagishi K, Kokubo Y, Saito I, Yatsuya H, Tsugane S (2014). Rice consumption is not associated with risk of cardiovascular disease morbidity or mortality in Japanese men and wo- men: A large population-based, prospective co- hort study. The American Journal of Clinical Nutri- tion 100(1):199-207.
Food and Nutrient Database for Dietary Studies.
(2009). U.S. Department of Agriculture. http://www.
ars.usda.gov/Services.
Gaudreau P, Morais JA, Shatenstein B, Gray-Donald K, Khalil A, Dionne I, Ferland G, Flp TJD, Kergoat MJ, Tessier D, Wagner R, Payette H (2007). Nutrition as a determinant of successful aging: description of the Quebec longitudinal study age and results from cross-sectional pilot studies. Rejuvenation Res 10(3):377-386.
Graham I, Atar D, Borch-Johnsen K, Boysen G, Burell G, Cifkova R (2007). European Society of Cardio- logy (ESC) Committee for Practice Guidelines (CPG).: European guidelines on cardiovascular disease prevention in clinical practice: executive summary: Fourth Joint Task Force of the Euro- pean Society of Cardiology and Other Societies on Cardiovascular Disease Prevention in Clinical Practice (Constituted by representatives of nine societies and by invited experts). Eur Heart J 28(19).
Heymsfield SB, Smith R, Aulet M, Bensen, B, Licht- man S, Wang J, Pierson RN (1990). Appendicular skeletal muscle mass: measurement by dual-pho- ton absorptiometry. The American Journal of Clinical Nutrition 52(2):214-218.
Hausman DB, Fischer JG, Johnson MA (2011). Nutri- tion in centenarians. Maturitas 68(3): 203-209.
Izadi V, Azadbakht L (2015). Is there any association between rice consumption and some of the car- diovascular diseases risk factors? A systematic review. ARYA Atheroscler 109-115.
Janssen I, Heymsfield SB, Ross R (2002). Low relative skeletal muscle mass (sarcopenia) in older per- sons is associated with functional impairment and physical disability. Journal of the American Geriatrics Society 50(5):889-896.
Jo N, Kim SY (2015). Factors affecting changes of in- dividual rice intakes. 42(1):145-164.
Kadowaki T, Yamauchi T (2005). Adiponectin and adi- ponectin receptors. Endocrine Reviews 26(3):439- 451.
Kennedy E, Luo H (2015). Association between Rice consumption and selected indicators of dietary and nutritional status using National Health and Nutrition Examination Survey 2007–2008. Ecolo- gy of Food and Nutrition 54(3):224-239.
Khosravi-Boroujeni H, Sarrafzadegan N, Mohammadi- fard N, Sajjadi F, Maghroun M, Asgari S, Azad- bakht L (2013). White rice consumption and CVD risk factors among Iranian population. Journal of Health, Population, and Nutrition 31 (2):252.
Lee GL, Kim MJ (2003). An analysis of rice consump- tion behavior in Korea. Korea Rural Economic institute. Report of Research, p 134.
Lim S, Kim JH, Yoon JW, Kang SM, Choi SH, Park YJ, Jang HC (2010). Sarcopenic obesity: prevalence and association with metabolic syndrome in the Korean Longitudinal Study on Health and Aging (KLoSHA). Diabetes Care 33(7):1652-1654.
Muraki I, Wu H, Imamura F, Laden F, Rimm EB, Hu FB, Sun Q (2015). Rice consumption and risk of car- diovascular disease: results from a pooled analy- sis of 3 US cohorts. The American Journal of Clinical Nutrition 101(1):164-172.
Oh C, Kim HS, No JK (2015). Impact of dining out on nutritional intake and metabolic syndrome risk factors: data from the 2011 Korean National Health and Nutrition Examination Survey. British Journal of Nutrition 113(03):473-478.
Oh C, Jho S, No JK, Kim HS (2015). Body composition changes were related to nutrient intakes in eld- erly men but elderly women had a higher preva- lence of sarcopenic obesity in a population of Korean adults. Nutrition Research 35(1):1-6.
Oh C, No JK, Kim HS (2014). Dietary pattern classi- fications with nutrient intake and body composi- tion changes in Korean elderly. Nutrition Research and Practice 8(2):192-197.
Oh SW (2011). Obesity and metabolic syndrome in Korea. Diabetes & Metabolism Journal 35(6):561- 566.
Ozaki A, Uchiyama M, Tagaya H, Ohida T, Ogihara R
(2007). The Japanese Centenarian Study: autono-
my was associated with health practices as well
as physical status. Journal of the American Geria-
trics Society 55(1):95-101.
Park MY, Kim GR, Lee DJ, Kim JM, Park PS (2006). A survey of food and nutrient intakes of the eged people in rural area, Gyeongbuk Yecheon. Korean Journal of Nutrition 39(1):58-73.
Roubenoff R (2000). Sarcopenic obesity: Does mu- scle loss cause fat gain?: Lessons from Rheuma- toid Arthritis and Osteoarthritisa. Annals of the New York Academy of Sciences 904(1):553- 557.
Ryu HK (2003). A survey on the number of meals skipped and the types of main meals in Miryang and Daegue. Korean Journal of Community Living Science.
Statistics Korea (2009). The report of grain con- sumption survey per household. http:// kostat.
go.kr
Statistics Korea (2011). The report of grain con- sumption survey per household. http:// kostat.
go.kr
Shimizu K, Takeda S, Noji H, Hirose N, Ebihara Y, Arai Y, Konishi K (2003). Dietary patterns and further survival in Japanese centenarians. Journal of Nutritional Science and Vitaminology 49(2):133- 138.
Song Y, Joung H, Engelhardt K, Yoo SY, Paik HY (2005). Traditional v. modified dietary patterns and their influence on adolescents' nutritional profile. British Journal of Nutrition 93(06):943- 949.
Sun Q, Spiegelman D, van Dam RM, Holmes MD, Malik VS, Willett WC, Hu FB (2010). White rice,
brown rice, and risk of type 2 diabetes in US men and women. Archives of Internal Medicine 170 (11):961-969.
Takeda S, Noji H, Hirose N, Arai Y, Yamamura K, Shimizu K, Takayama M (1998). [Nutritional in- take by the oldest elderly Japanese. Tokyo Cente- narian Study 6]. Nihon Ronen Igakkai zasshi.
Japanese Journal of geriatrics 35(7):548-558.
Warr P (2013). Food Security in Asia and the Pacific.
ISBN 978-92-9254-224-5 (Print), Publication Sto- ck No. RPT135848-2.
Watanabe Y, Saito I, Asada Y, Kishida T, Matsuo T, Yamaizumi M, Kato T (2013). Daily Rice Intake strongly influences the incidence of metabolic syndrome in Japanese men aged 40~59 years.
Journal of Rural Medicine. JRM 8(1):161.
Yoon HS, Lee MJ, Yang HL, Lee KH (2005). A study on elementary schoolchildren’s knowledge, one’s value and consumption pattern for rice foods in Changwon and Gimhae city. Journal of the Kore- an Dietetic Association 11(3):353-364.
Zamboni M, Mazzali G, Fantin F, Rossi A, Di FV (2008).
Sarcopenic obesity: a new category of obesity in the elderly. Nutrition, Metabolism and Cardiovas- cular Diseases 18(5):388-39.
Received: 7 September, 2015
Revised: 1 October, 2015
Accepted: 20 October, 2015
한국 노인의 쌀 섭취와 대사위험지표에 관한 연구: 근육량 중심으로
오초롱
1)노재경
2)
1)
경성대학교 호텔관광․외식경영학과,
2)¶경성대학교 식품응용공학부
국문초록