J Korean Soc Parenter Enter Nutr Vol. 5, No. 3, 2013
110
Received June 3, 2013 Revised October 24, 2013 Accepted December 2, 2013
Correspondence to Hyun Wook Baik
Division of Gastroenterology, Department of Internal Medicine, Bundang Jesaeng Hospital, 20, Seohyeon-ro 180 beon-gil, Bundang-gu, Seongnam 463-774, Korea
Tel: +82-31-779-0210, Fax: +82-31-779-5079, E-mail: hbaik@ dmc.or.kr This work is carried out with the support of ‘Research Program for Agricultural Science and Technology Development’, National Academy of agricultural Science, Rural Development Administration, Republic of Korea (Project No. PJ007211).
Copyright ⓒ 2013. The Korean Society for Parenteral and Enteral Nutrition. All Rights Reserved.
This is an Open Access article distributed under the terms of the Creative Commons Attribution Non-Commercial License (http://creativecommons.org/licenses/ by-nc/3.0) which permits unrestricted non-commercial use, distribution, and reproduction in any medium, provided the original work is properly cited.
건강한 한국인에서 김치의 섭취가 대사증후군의 위험에 미치는 상관관계
분당제생병원 소화기내과, 1서울대학교 보건대학원, 2동국대학교 일산병원 가정의학과, 3인제대학교 일산백병원 가정의학과
오인명ㆍ정효지1ㆍ오상우2ㆍ윤영숙3ㆍ유경화ㆍ박지은ㆍ박주상ㆍ장은정ㆍ박상종ㆍ박상운ㆍ김상중ㆍ백현욱
Relationship of Combined Consumption of Rice and Kimchi, Korean Traditional Diet and the Risk of Metabolic Syndrome in Healthy Korean Volunteers
In Myung Oh, Hyo Jee Joung
1, Sang-Woo Oh
2, Yeong Sook Yoon
3, Kyoung Hwa Yoo, Ji Eun Park, Ju Sang Park, Eun Jeong Jang, Sang Jong Park, Sang Woon Park, Sang Jung Kim, Hyun Wook Baik
Division of Gastroenterology, Department of Internal Medicine, Bundang Jesaeng Hospital, Seongnam, 1Graduate School of Public Health, Seoul National University, Seoul, 2Department of Family Medicine, Dongguk University Ilsan Hospital, Goyang,3Department of Family Medicine, Inje University Ilsan Paik Hospi- tal, Goyang, Korea
Purpose: Metabolic Syndrome (MetS) is defined as the coexistence of several metabolic risk factors. Diet is thought to play a major role in development of MetS. We attempted to determine whether the Korean diet is related to a reduced risk for development of MetS.
Methods: A total of 425 healthy Korean adults were re- cruited by advertisement to Bundang Jesaeng Hospital from January 1 to June 30, 2009; those not taking regular medications and without diagnosis of disease were included. Data were collected on three-day dietary intake, anthropometric measurements, and diagnostic parame- ters, including levels of lipid panel, glucose, adiponectin,
and inflammatory cytokines (interleukin-6 [IL-6], tumor ne- crosis factor-α [TNF-α]) for MetS from individuals enrolled in the study. The National Cholesterol Education Program (NCEP) scoring system was used for diagnosis of MetS.
Results: Out of 425 (11.8%) subjects, 50 were diagnosed as having MetS. As NCEP scores increased, the levels of inflammatory cytokines (IL-6, TNF-α) showed an increas- ing tendency, however, the adiponectin level had de- creased (P<0.0001). A greater amount of total vegetable consumption appeared to be associated with decreased risk for MetS. A higher carbohydrate consumption repre- sented by the amount of rice intake (refined starch) ap- peared to be associated with higher risk of MetS. However, increasing consumption of rice combined with Kimchi showed an association with increased high-density lip- oprotein cholesterol (56.7±1.6 vs. 62.8±2.2, P for trend:
0.0321) and decreased adiponectin level (9.0±0.8 vs.
11.4±1.2, P for tend: 0.0255).
Conclusion: Among healthy Korean volunteers consum- ing an ordinary Korean diet, the prevalence of MetS was found to be 11.8%. Greater consumption of rice showed an association with greater risk of MetS, while greater consumption of rice combined with Kimchi, the main sta- ple of the Korean diet, showed an association with lower risk of MetS. (J Korean Soc Parenter Enter Nutr 2013;
5(3):110-116)
Key Words: Korean traditional diet, Metabolic syndrome, Adiponectin
중심 단어: 한국 전통 식이, 대사증후군, 아디포넥틴
서 론
대사증후군은 1988년 미국 스탠포드 대학의 Reaven
1에
의해 인슐린저항성과 고혈압, 이상지질혈증, 내당능 장애
및 복부 비만과의 개념으로 처음 등장하였고, ‘X 증후군’이
라는 이름으로 처음으로 명명되었으며 1999년 세계보건기
구(World Health Organization)에서 실제적인 진단 기준을 제
시하며 ‘대사증후군’이라는 용어로 통칭하기를 권고하였
다.
2그 후, 2001년에는 The National Cholesterol Education
Program-Adult Treatment Panel III (NCEP-ATP III),
3최근에 는 2005년도에 International Diabetes Federation
4에서 서로 다 른 진단 기준을 제시하였으며 아직 표준화되어 있지는 않 다. 대사증후군은 결과적으로 당뇨병, 심혈관 질환, 뇌혈관 질환과 같은 비전염성 질환의 발생을 증가시키므로 무엇보 다 예방이 중요하며, 그 위험 인자들에 대한 연구들이 이루 어지고 있다.
1999년부터 2002년 사이의 미국 국민건강영양조사 결과 를 바탕으로 Ford
5가 발표한 바에 의하면, 20세 이상의 성인 에서 NCEP-ATP III 진단기준으로 정의된 대사증후군의 유 병률은 남자에서는 34.4%, 여자에서는 34.5%였다. 우리나 라의 경우 2007년 국민건강영양조사 자료에 의하면 정상인 에서 남자 36.4%, 여자 34.3%가 대사증후군으로
6대사증후 군에 대한 서로 다른 진단 기준 적용에 따라 유병률은 다소 결과 차이를 보이나 이미 서양의 수준과 비슷한 결과 이르 고 있음을 알 수 있다. 이는 상대적으로 비만을 잘 일으키는 현대의 서구화된 식습관 및 생활 습관 변화에 따른 것으로, 최근에는 식생활과 대사증후군 간의 연관성에 대한 연구가 활발히 이루어지고 있다. 건강한 식습관은 대사증후군과 제2형 당뇨병 등과 역의 상관관계를 보이며, 고지방, 고칼 로리의 서구형 식습관이 대사증후군의 위험도를 증가시킨 다는 것이 여러 연구에서 보고되고 있다.
7,8과거에 비해 만성 질환의 유병률이 증가하는 것은 간접 적이기는 하나 고유한 한국 전통 식습관의 장점을 시사하 는 반증이라 할 수 있다. 한식은 아직 정형화된 정의가 없으 나, 주식인 밥과 김치의 높은 섭취 및 발효 식품과 다양한 채소류의 구성을 특징으로 하며 이런 한식의 특징은 대사 증후군의 여러 요소들과 관련이 있을 것으로 생각된다. 따 라서 본 연구에서는 이전에 진단받은 질환이 없는 건강한 한국인을 대상으로 대사증후군의 유병률 및 대상자들간의 식품 섭취의 차이점을 조사함으로써 한식이 대사증후군에 미치는 영향에 대하여 알아보기로 하였다.
대상 및 방법
1. 대상
본 연구는 2009년 1월 1일부터 6월 30일까지 6개월 동안 분당제생병원 바이오 메디컬 연구센터에서 건강 진단을 받 은 서울 및 경기 지역에 거주하는 30∼59세의 건강한 한국 인 자원자 425명(남자 122명, 여자 303명)을 대상으로 하였 다. 고혈압, 고지혈증, 당뇨 등 만성 질환을 진단받았거나 이로 인한 약물 복용중인 자는 제외하였다. 또한 본 연구는 연구 대상의 윤리적 보호를 위하여 분당제생병원 기관생명 윤리심의위원회(institutional review board, IRB)의 승인하에
진행하였다(심의번호 IMG 09-01). 연구 대상자에게 모집 시, 연구목적 및 방법, 익명성 보장, 자발적 참여와 거부, 중 도 포기 가능성, 발생할 수 있는 이익과 불이익 등에 대하여 구두와 서면을 통한 설명을 진행하고 동의서를 받았다.
2. 신체 계측
키와 체중은 가벼운 옷차림에 신발을 벗은 채로 신장 체중 계(GL-150; G-Tech International, Seoul, Korea)로 측정하였고, 허리둘레는 직립 자세에서 양쪽 장골능의 가장 높은 부위 바 로 위쪽에 줄자를 대고 숨을 내쉰 상태에서 바닥과 수평하게 측정되었다. 수축기 및 이완기 혈압은 EW3152 (Panasonic, Tokyo, Japan)를 이용하여 안정 상태에서 측정하였다.
3. 식이 습관 평가
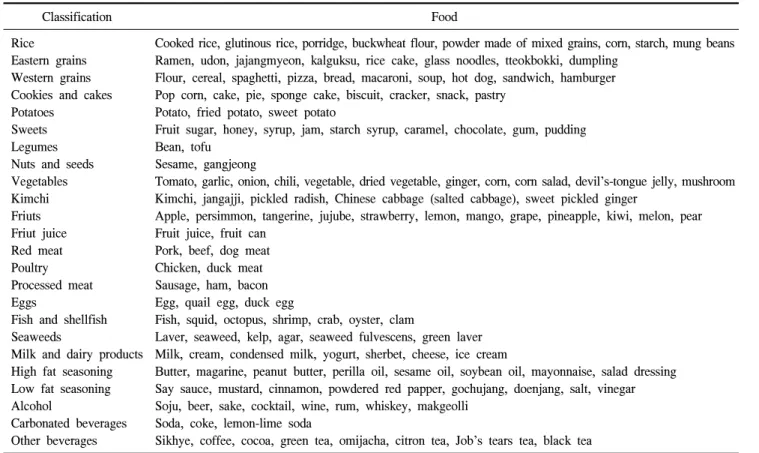
모든 대상자의 식이 조사는 내원 당일 시행한 24시간 회 상법 1일 기록과 2일간의 식사일지 기록을 포함하여 총 3일 간의 자료(주중 2일, 주말 1일)를 수집하였으며, 반정량적 식품 섭취 빈도 기록지를 이용하였다. 모든 설문 조사는 서 울대학교 식품 영양학과 조사팀의 훈련된 조사원에 의해 실시되었으며 모든 대상자는 각 식품군에 대하여 섭취 빈 도와 섭취량의 정도를 설문지에 함께 기재된 표준형 크기 비교단위에 준하여 기록하였다. 조사된 식사 자료는 서울 대학교 인체영양연구실에서 개발한 웹기반 식사조사프로 그램인 Diet Evaluation System program에 입력하여 분석하 였다. 수집된 임상 자료와 식사 자료는 최종적으로 한국영 양학회 영양정보센터에서 연구 개발한 컴퓨터용 영양평가 용 Computer Aided Nutritionalanalysis 프로그램의 식품 영양 소 함량 데이터 베이스의 17개 식품 분류에 기초하여 관심 있는 식품을 세분화한 24가지 항목에 대해 대사증후군과 관련이 있는 식이 요인을 분석하였다(Table 1). 또한, 한식 으로 대표되는 밥과 김치의 섭취량이 대사증후군에 미치는 영향을 알아보기 위하여 밥 섭취량에 따라 참가자를 4등분 하였고, 김치 섭취량에 따라 참가자를 4등분하였다. 밥을 제일 적게 먹은 그룹과 김치를 제일 적게 섭취한 그룹 사이 에 공통되는 참가자들은 Quartile 1 (49명), 밥을 제일 많이 먹은 그룹과 김치를 제일 많이 먹은 그룹 모두에 속한 참가 자를 Quartile 4 (33명)로 다시 나누어 두 그룹간의 신체 계 측 및 실험실 계측 자료를 비교하였다.
4. 실험실 계측
모든 연구 대상자들은 채혈을 하기 전에 최소한 12시간
이상 금식을 하였고, 혈청 포도당 농도, 혈청 중성지방 농
도, 혈청 총 콜레스테롤 농도, 혈청 고밀도 지단백 콜레스테
롤 농도, 혈청 당화 혈색소는 표준화된 자동 효소 분석법
Table 1. Classification of food
Classification Food
Rice
Eastern grains Western grains Cookies and cakes Potatoes
Sweets Legumes Nuts and seeds Vegetables Kimchi Friuts Friut juice Red meat Poultry Processed meat Eggs
Fish and shellfish Seaweeds
Milk and dairy products High fat seasoning Low fat seasoning Alcohol
Carbonated beverages Other beverages
Cooked rice, glutinous rice, porridge, buckwheat flour, powder made of mixed grains, corn, starch, mung beans Ramen, udon, jajangmyeon, kalguksu, rice cake, glass noodles, tteokbokki, dumpling
Flour, cereal, spaghetti, pizza, bread, macaroni, soup, hot dog, sandwich, hamburger Pop corn, cake, pie, sponge cake, biscuit, cracker, snack, pastry
Potato, fried potato, sweet potato
Fruit sugar, honey, syrup, jam, starch syrup, caramel, chocolate, gum, pudding Bean, tofu
Sesame, gangjeong
Tomato, garlic, onion, chili, vegetable, dried vegetable, ginger, corn, corn salad, devil’s-tongue jelly, mushroom Kimchi, jangajji, pickled radish, Chinese cabbage (salted cabbage), sweet pickled ginger
Apple, persimmon, tangerine, jujube, strawberry, lemon, mango, grape, pineapple, kiwi, melon, pear Fruit juice, fruit can
Pork, beef, dog meat Chicken, duck meat Sausage, ham, bacon Egg, quail egg, duck egg
Fish, squid, octopus, shrimp, crab, oyster, clam
Laver, seaweed, kelp, agar, seaweed fulvescens, green laver Milk, cream, condensed milk, yogurt, sherbet, cheese, ice cream
Butter, magarine, peanut butter, perilla oil, sesame oil, soybean oil, mayonnaise, salad dressing Say sauce, mustard, cinnamon, powdered red papper, gochujang, doenjang, salt, vinegar Soju, beer, sake, cocktail, wine, rum, whiskey, makgeolli
Soda, coke, lemon-lime soda
Sikhye, coffee, cocoa, green tea, omijacha, citron tea, Job’s tears tea, black tea
(TBA-20FR; Toshiba Medical, Tokyo, Japan)을 이용하여 당 일 측정하였다.
또한 최근 연구에서 혈장 아디포넥틴(adiponectin)은 비만 인 및 제2형 당뇨병 환자에서 농도가 감소되어 있으며 저아 디포넥틴혈증은 심혈관 질환 발생 및 대사 질환의 유무와 도 관계가 있는 것으로 나타나 그 중요성이 대두되고 있는 바
9-11혈청 아디포넥틴의 농도를 측정하여 식사 섭취 패턴 에 따른 농도에 차이가 있는지 분석하고자 하였다.
5. 대사증후군 진단 기준
대사증후군의 진단 기준으로 NCEP-ATP III (2001)에 기 초하여 정상 공복 혈당 수치를 100 mg/dL으로 수정한 2004 년 American Heart Association/National Heart, Lung, and Blood Institute criteria
12를 사용하였으며, 그 내용에 따라 허 리둘레는 2005년 국내 비만협회에서 제시한 한국인에 적합 한 허리 둘레 값(남 90 cm, 여 85 cm)
13으로 정의하였다. 다 음 5개 항목 중에서 3개 항목 이상을 만족한 경우를 대사증 후군으로 하였다.
복부 비만: 허리둘레가 남자≥90 cm, 여자≥85 cm 고중성지방혈증: 중성지방이 150 mg/dL 이상(1.69 mmol/L) 저고밀도지단백콜레스테롤: 남자<40 mg/dL (1.04 mmol/L),
여자<50 mg/dL (1.29 mmol/L) 고혈압: ≥130/85 mmHg
공복시 고혈당: ≥100 mg/dL (≥6 mmol/L) 6. 통계 분석
모든 자료는 대사증후군의 진단 기준 개수 증가에 따라 4개 군(1개 해당, 2개 해당, 3개 해당, 3개 이상 해당-대사증 후군으로 진단)으로 나누어 분석되었다. 연속 변수의 평균 차이 분석은 공분산 분석을 이용하였다(Proc GLM; SAS Institute, Cary, NC, USA). 각 식품군별 섭취 1회 분량 수와 대사증후군 및 그 구성요소 간의 관계는 다중 로지스틱 회 귀 분석을 이용, 연령, 성별, 1일 평균 섭취 에너지, 체질량 지수(대사증후군과 복부비만에는 적용하지 않음)를 보정하 였다.
결 과
1. 대상군의 임상적 특징
연구에 응한 총 425명중 남자 122명(28.7%), 여자 303명
(71.3%)이었으며 30대가 170명(40.0%), 40대가 165명(38.8%),
50대 이상이 90명(21.2%)이었다. 대상군의 평균 body mass
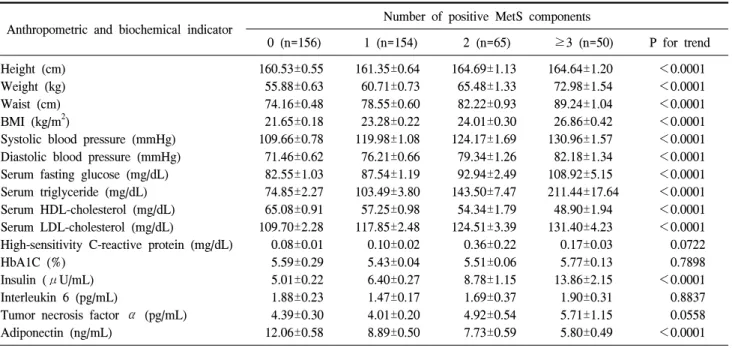
Table 3. Anthropometric and biochemical indicators of subjects with varying number of MetS components Anthropometric and biochemical indicator Number of positive MetS components
0 (n=156) 1 (n=154) 2 (n=65) ≥3 (n=50) P for trend Height (cm)
Weight (kg) Waist (cm) BMI (kg/m2)
Systolic blood pressure (mmHg) Diastolic blood pressure (mmHg) Serum fasting glucose (mg/dL) Serum triglyceride (mg/dL) Serum HDL-cholesterol (mg/dL) Serum LDL-cholesterol (mg/dL)
High-sensitivity C-reactive protein (mg/dL) HbA1C (%)
Insulin (μU/mL) Interleukin 6 (pg/mL)
Tumor necrosis factor α (pg/mL) Adiponectin (ng/mL)
160.53±0.55 55.88±0.63 74.16±0.48 21.65±0.18 109.66±0.78 71.46±0.62 82.55±1.03 74.85±2.27 65.08±0.91 109.70±2.28 0.08±0.01 5.59±0.29 5.01±0.22 1.88±0.23 4.39±0.30 12.06±0.58
161.35±0.64 60.71±0.73 78.55±0.60 23.28±0.22 119.98±1.08 76.21±0.66 87.54±1.19 103.49±3.80 57.25±0.98 117.85±2.48 0.10±0.02 5.43±0.04 6.40±0.27 1.47±0.17 4.01±0.20 8.89±0.50
164.69±1.13 65.48±1.33 82.22±0.93 24.01±0.30 124.17±1.69 79.34±1.26 92.94±2.49 143.50±7.47 54.34±1.79 124.51±3.39 0.36±0.22 5.51±0.06 8.78±1.15 1.69±0.37 4.92±0.54 7.73±0.59
164.64±1.20 72.98±1.54 89.24±1.04 26.86±0.42 130.96±1.57 82.18±1.34 108.92±5.15 211.44±17.64
48.90±1.94 131.40±4.23 0.17±0.03 5.77±0.13 13.86±2.15 1.90±0.31 5.71±1.15 5.80±0.49
<0.0001
<0.0001
<0.0001
<0.0001
<0.0001
<0.0001
<0.0001
<0.0001
<0.0001
<0.0001 0.0722 0.7898
<0.0001 0.8837 0.0558
<0.0001 Values are presented as mean±standard error.
P for trend of anthropometric markers and biochemical markers between MetS score groups was calculated by general linear model.
MetS = metabolic syndrome; BMI = body mass index; HDL = high-density lipoprotein; LDL = low-density lipoprotein.
Table 2. General characteristics of the subjects
Anthropometric and biochemical indicator Total (n=425) Male (n=122) Female (n=303) P-value Height (cm)
Weight (kg) Waist (cm) BMI (kg/m2)
Systolic blood pressure (mmHg) Diastolic blood pressure (mmHg) Serum fasting glucose (mg/dL) Serum triglyceride (mg/dL) Serum HDL-cholesterol (mg/dL) Serum LDL-cholesterol (mg/dL)
High-sensitivity C-reactive protein (mg/dL) HbA1C (%)
Insulin (μU/mL) Interleukin 6 (pg/mL)
Tumor necrosis factor α (pg/mL) Adiponectin (ng/mL)
161.95±0.39 61.11±0.51 78.76±0.41 23.21±0.15 118.12±0.68 75.65±0.45 89.05±0.99 111.72±3.53 58.69±0.66 117.47±1.46 0.14±0.04 5.54±0.11 7.13±0.36 1.71±0.12 4.52±0.22 9.51±0.32
171.10±0.57 71.51±0.80 84.05±0.60 24.40±0.23 126.23±1.05 79.68±0.71 97.11±2.09 149.34±9.13 53.61±1.11 121.59±2.74 0.13±0.03 5.46±0.06 9.73±1.03 1.40±0.21 4.83±0.54 6.18±0.38
158.26±0.3 56.92±0.46 76.63±0.47 22.74±0.18 114.86±0.77 74.02±0.53 85.80±1.05 96.70±2.93 60.74±0.77 115.81±1.72 0.15±0.05 5.57±0.15 6.09±0.26 1.83±0.15 4.38±0.2 10.85±0.39
<0.0001
<0.0001
<0.0001
<0.0001
<0.0001
<0.0001
<0.0001
<0.0001
<0.0001 0.0039 0.7861 0.6269
<0.0001 0.0321 0.5611
<0.0001 Values are presented as mean±standard error.
P for trend of anthropometric markers and biochemical markers between sex groups was calculated by general linear model.
BMI = body mass index; HDL = high-density lipoprotein; LDL = low-density lipoprotein.
index (BMI)는 남자에서는 24.4 kg/m
2, 여자에서는 22.74 kg/m
2로 남자에서 높게 측정되었다(Table 2). 조사 대상 중 NCEP 3점 이상으로 대사증후군으로 진단할 수 있는 환자 수는 남자 25명(20.49%), 여자 25명(8.25%)로, 여자에 비해 남자가 상대적으로 높은 유병률을 보였다(P<0.0001). 또한
대사증후군의 진단 기준의 개수를 많이 만족할수록 몸무
게, 허리둘레, 혈압, 혈청 중성 지방 수치, 공복 혈당 수치
및 저밀도 지단백 지질 혈증은 증가하는 경향을 나타내었
으며, 고밀도 지단백 콜레스테롤은 감소하는 경향을 나타
내었다. 인슐린 농도 또한 통계적으로 유의하게 증가하는
Table 4. Food intake amount with varying number of metabolic syndrome (MetS) components
Variable (g/day) Number of positive MetS components
0 (n=156) 1 (n=154) 2 (n=65) ≥3 (n=50) P for trend (crude) Rice
Eastern grains Western grains Cookies and cakes Potatoes
Sweets Legumes Nuts and seeds Vegetables Kimchi Fruits Fruit juice Red meats Processed meat Eggs
Fish and shellfish Seaweeds
Milk and dairy products High fat seasoning Low fat seasoning Carbonated beverages Other beverages Alcohol Poultry Total
164.41±6.59 91.29±5.14 80.59±5.54 57.57±6.15 75.04±8.26 11.73±0.71 49.55±4.68 4.31±0.62 201.02±8.78 72.88±3.05 195.42±12.37 151.91±17.43 63.81±3.85 21.84±2.01 36.91±2.10 57.99±2.73 6.75±0.87 182.33±11.11
11.50±0.44 29.23±1.04 141.30±21.12
83.70±9.93 183.94±32.30
84.21±7.01 1,231.55±32.21
181.19±7.63 100.84±6.50 78.60±5.84 67.29±7.93 69.00±9.95 11.32±0.64 52.54±4.99 3.57±0.48 197.32±12.76
72.70±3.29 191.32±12.76 138.87±16.55 66.90±4.53 22.45±2.57 36.12±2.29 59.65±3.86 8.18±1.72 193.39±12.72
10.72±0.42 28.31±1.05 155.60±21.86
57.10±8.07 228.49±48.32 107.32±11.08 1,217.60±35.39
197.26±13.23 93.50±6.58 81.75±12.12 67.99±16.95 71.13±10.44 11.63±1.00 50.61±5.94 3.00±0.50 193.70±12.45
68.73±4.61 248.17±40.37 157.63±32.43 64.33±7.27 28.57±5.57 40.45±3.33 73.54±7.77 5.79±1.39 163.16±13.87
11.05±0.65 33.71±1.89 248.62±52.74
77.58±16.25 258.18±63.51 119.74±17.70 1,342.81±59.93
207.72±18.11 95.77±8.30 93.24±12.77 46.01±7.32 51.98±7.18 11.24±1.33 44.12±6.38 3.95±0.75 189.90±16.07
82.66±6.01 173.99±20.18 213.59±72.93 70.29±9.38 27.43±3.89 52.43±7.39 55.27±4.62 8.10±2.00 182.04±19.59
10.71±0.75 26.58±1.42 190.91±39.78
69.69±14.23 459.47±105.38
98.76±16.47 1,382.26±86.95
0.0015 0.6855 0.4347 0.8937 0.2468 0.7599 0.6814 0.369 0.4972 0.4055 0.7099 0.2944 0.548 0.1164 0.0069 0.4383 0.8256 0.6412 0.3426 0.9263 0.0667 0.4659 0.0043 0.1284 0.0193 Values are presented as mean±standard error.
P for trend of food intake between American Heart Association/National Heart, Lung, and Blood Institute score groups was calculated by general linear model.
경향을 나타내었으며, 통계적으로 유의하지는 않았지만 in- terleukin-6, tumor necrosis factor-α도 증가하는 경향을 나타 내었다. Adiponectin도 대사증후군 위험도 증가에 따라 매우 확실하게 감소하는 경향을 나타냈다(Table 3).
2. 대사증후군의 발생 위험도와 각 식품군별 섭취량과 의 관계
대사증후군의 진단 기준의 개수를 많이 만족할수록 통계적 으로 유의하게 밥, 계란, 알코올의 섭취가 많은 것으로 나타났 으며, 채소의 섭취는 감소하는 경향을 나타내었다(Table 4).
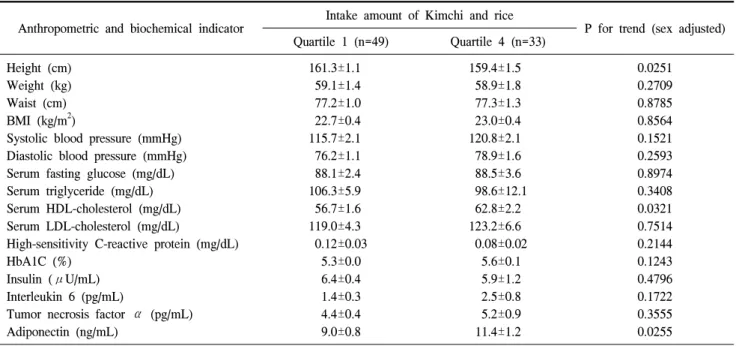
3. 밥과 김치의 통합섭취량에 따른 대사증후군의 구성 인자와의 관계
대상 및 방법에서 설명하였듯이 한국인의 주식으로 대표 되는 밥과 김치의 섭취가 대사증후군에 미치는 영향을 알 아보기 위하여 밥과 김치를 적게 먹은 군과 많이 먹은 군으
로 대상자를 극대화시켜 두 그룹간의 신체 계측 및 실험실 계측을 시행하였으며, 밥과 김치의 섭취량이 많은 군에서 통계적으로 유의하게 혈청 고밀도 지단백 콜레스테롤과 아 디포넥틴의 농도가 증가하였다(Table 5).
고 찰
이번 연구에서는 기저질환이 없는 건강한 성인 남녀에서
의 대사증후군의 유병률 및 평균적인 건강한 한국인 식사
유형을 조사하고 한식과 대사증후군의 관계에 대해 알아보
고자 하였다. 본 연구에서는 대사증후군으로 진단할 수 있
는 환자 수는 남자 25명(20.49%), 여자 25명(8.25%)으로 보
고되었으며 30% 내외로 알려진 우리나라의 일반적인 대사
증후군 유병률보다 낮은 결과를 보였다. 이는 본 연구의 대
상을 연령을 59세까지로 제한하였으며 만성 질환력이 없는
건강한 성인을 바탕으로 하였기 때문으로 생각된다. 또한
Table 5. Anthropometric and biochemical indicators of re-group by the amount of combined rice and Kimchi intake Anthropometric and biochemical indicator Intake amount of Kimchi and rice
P for trend (sex adjusted) Quartile 1 (n=49) Quartile 4 (n=33)
Height (cm) Weight (kg) Waist (cm) BMI (kg/m2)
Systolic blood pressure (mmHg) Diastolic blood pressure (mmHg) Serum fasting glucose (mg/dL) Serum triglyceride (mg/dL) Serum HDL-cholesterol (mg/dL) Serum LDL-cholesterol (mg/dL)
High-sensitivity C-reactive protein (mg/dL) HbA1C (%)
Insulin (μU/mL) Interleukin 6 (pg/mL)
Tumor necrosis factor α (pg/mL) Adiponectin (ng/mL)
161.3±1.1 59.1±1.4 77.2±1.0 22.7±0.4 115.7±2.1 76.2±1.1 88.1±2.4 106.3±5.9 56.7±1.6 119.0±4.3 0.12±0.03
5.3±0.0 6.4±0.4 1.4±0.3 4.4±0.4 9.0±0.8
159.4±1.5 58.9±1.8 77.3±1.3 23.0±0.4 120.8±2.1 78.9±1.6 88.5±3.6 98.6±12.1 62.8±2.2 123.2±6.6 0.08±0.02
5.6±0.1 5.9±1.2 2.5±0.8 5.2±0.9 11.4±1.2
0.0251 0.2709 0.8785 0.8564 0.1521 0.2593 0.8974 0.3408 0.0321 0.7514 0.2144 0.1243 0.4796 0.1722 0.3555 0.0255 Values are presented as mean±standard error.
P for trend of food intake between groups according intake amount of Kimchi and rice was calculated by general linear model.
We devided into four quartiles as intake amount of rice and Kimchi. And regrouped Quartile 1 as having the forth highest amount of rice and the forth highest aomunt of kimch, Queatile 4 as having the first highest amount of rice and the first highest amount of Kimchi.
여자에 비해 남자가 상대적으로 높은 유병률을 보였는데 이는 모집된 여자가 남자에 비해 평균 BMI, 혈압, 공복 혈 당등 임상적 수치가 낮았기 때문으로 보이며 또한 본 연구 의 기본 남녀 대상자 수에 차이가 있으므로(122 vs. 303) 이 를 우리나라 전체의 특성으로 일반화시키기에는 어려울 것 으로 생각된다.
최근 외식업이 고부가가치 수출 산업 품목으로 각광받고 있는 바 이런 세계적 추세에 따라 우리나라도 2008년부터 한식 세계화 정책을 수립하여 한식을 규정하기 위한 여러 가지 시도가 이루어져 왔다. 본 연구가 이루어질 당시에는 한식에 대한 국가적 사업이 초창기였을 때로 한식의 정의 가 충분히 정립되지 않은 상태였으며 따라서 일반적인 한 식의 특성인 밥을 주식으로 하며 김치를 포함한 발효 식품 과 채소류의 높은 섭취임을 참고하여 밥과 김치 섭취량에 초점을 맞추어 분석을 하고자 하였다. 대사증후군의 개수 가 증가할수록 밥, 계란, 알코올의 섭취량이 증가한 것으로 나타났으나 흥미롭게도 밥과 김치를 함께 먹었을 때에는 두 군 모두 정상 범위이기는 하지만 상대적으로 많이 섭취 한 군에서 유의하게 혈청 high-density lipoprotein (HDL)-콜 레스테롤 농도의 증가를 보였다. 이러한 결과를 바탕으로 한식이 대사증후군의 발생에 긍정적 효과를 보일 것으로 추정해 볼 수 있으나 대상자 수가 425명으로 한식의 유형을 규정하기에는 대상자 수가 적으며 이중 대사증후군으로 진
단된 환자가 50명으로 한식 전반에 걸쳐 대사증후군의 관 계에 대해 분석하기에는 제한점이 있다. 또한 본 연구의 결 과는 밥과 김치의 단순 섭취량에 따라 분석한 데이터이므 로 영양소 섭취량에 따른 분석 및 섭취량의 표준화 등 이에 대한 추가적인 연구가 필요할 것으로 생각된다.
또한 이전의 여러 연구에서 아디포넥틴이 복부지방축적 및 인슐린저항성과 음의 상관관계가 있으며 폐경 전 비만 여자에서 감소된 혈중 아디포넥틴 농도가 대사증후군에 관 련된 인자들과 밀접한 관련이 있음이 보고된 바 있는데,
7,8이번 연구에서도 대사증후군의 구성 인자의 수가 증가할수 록 아디포넥틴이 현저하게 감소하는 소견을 보여 지방세포 에서 분비되는 아디포넥틴이 대사증후군의 발생에 중요한 역할을 하며 대사증후군 발병 위험도 예측에 도움을 줄 수 있을 것으로 생각된다.
이번 연구에서는 이전 진단받은 질환이 없는 건강한 성
인에게 밥과 김치로 대표되는 한식의 섭취량의 증가가 혈
중 중성 지방 농도를 낮추고 혈청 HDL-콜레스테롤 농도를
증가시킴으로써 대사증후군에 있어 긍정적 효과가 있을 것
으로 생각되며, 밥과 김치에 기초한 한국식 식단의 구성이
대사증후군의 예방 효과를 기대해 볼 수 있을 것으로 생각
한다. 더불어 항산화 지표인 혈중 아디포넥틴 농도도 대사
증후군의 발병 위험도 예측 및 치료 효과 판정에 유용할
것으로 생각된다.
REFERENCES
1. Reaven GM. Banting lecture 1988. Role of insulin resistance in human disease. Diabetes 1988;37(12):1595-607.
2. Alberti KG, Zimmet PZ. Definition, diagnosis and classi- fication of diabetes mellitus and its complications. Part 1: di- agnosis and classification of diabetes mellitus provisional re- port of a WHO consultation. Diabet Med 1998;15(7):539-53.
3. Expert Panel on Detection, Evaluation, and Treatment of High Blood Cholesterol in Adults. Executive Summary of The Third Report of The National Cholesterol Education Program (NCEP) expert panel on detection, evaluation, and treatment of high blood cholesterol in adults (Adult Treatment Panel III). JAMA 2001;285(19):2486-97.
4. Zimmet P, Alberti G, Shaw J. A new IDF worldwide defi- nition of the metabolic syndrome: the rationale and the results.
Diabetes Voice 2005;50(3):31-3.
5. Ford ES. Prevalence of the metabolic syndrome defined by the International Diabetes Federation among adults in the U.S.
Diabetes Care 2005;28(11):2745-9.
6. Moon HK, Kong JE. Assessment of nutrient intake for middle aged with and without metabolic syndrome using 2005 and 2007 Korean National Health and Nutrition Survey. Korean J Nutr 2010;43(1):69-78.
7. Carnethon MR, Loria CM, Hill JO, Sidney S, Savage PJ, Liu K; Coronary Artery Risk Development in Young Adults study.
Risk factors for the metabolic syndrome: the Coronary Artery Risk Development in Young Adults (CARDIA) study, 1985-
2001. Diabetes Care 2004;27(11):2707-15.
8. Park YW, Zhu S, Palaniappan L, Heshka S, Carnethon MR, Heymsfield SB. The metabolic syndrome: prevalence and as- sociated risk factor findings in the US population from the Third National Health and Nutrition Examination Survey, 1988-1994. Arch Intern Med 2003;163(4):427-36.
9. Kwon K, Kwak JJ, Park SH. Relationship of adiponectin to body fat distribution, insulin sensitivity and plasma lipopro- teins: in healthy premenopausal women. Korean Circulation J 2003;33(11):1004-10.
10. Kim MJ, Lee Y, Lee BJ, Yoen JH, Shin SY, Shin YG, et al. Plasma adiponectin concentration and insulin resistance in type 2 diabetes. J Korean Diabetes Assoc 2003;27(3):260-71.
11. Hwang ST, Sung KC, Kim BJ, Kim BS, Kang JH, Lee MH, et al. Insulin resistance and apolipoprotein B as a metabolic syndrome risk factor in normal glucose tolerance. Korean J Med 2004;66(2):156-66.
12. Grundy SM, Cleeman JI, Daniels SR, Donato KA, Eckel RH, Franklin BA, et al; American Heart Association National Heart, Lung, and Blood Institute. Diagnosis and management of the metabolic syndrome: an American Heart Association/
National Heart, Lung, and Blood Institute Scientific Statement.
Circulation 2005;112(17):2735-52.
13. Lee S, Park HS, Kim SM, Kwon HS, Kim DY, Kim DJ, et al. Cut-off points of waist circumference for defining abdomi- nal obesity in the Korean population. Korean J Obes 2006;
15(1):1-9.