A Study on Relationships between Environmental Risk and Demographic
Characteristics Using GIS
GIS를 이용한 환경 위험과 인구적 특성의 관계에 대한 연구
황 성 남
*
조 춘 만**
Seong Nam Hwang Chun Man Cho
요 약
이 연구는 홍수, 허리케인, 위험물질 누출에 대한 과학적으로 측정된 환경위험지수와 가계의 특성간의 상관관계를 조사하였다. 이 연구는 인구적 특성(연령, 가족 수, 결혼 상태, 거주 기간)과 두 가지 자연재해(홍수와 허리케인)의 위험지수 사이에는 통계적으로 유의미한 관계가 없음을 보여주었다. 이 결 과는 Drabek의 연구 결과를 지지하는 바, 사람들은 그들의 나이, 성별, 가족수, 결혼 상태, 거주기간과 관 련 없이 그들의 주거를 선택하는데 자연재해의 가능성을 과소평가하거나 무시하는 경향이 있음을 보여주 고 있다. 대조적으로, 위험물질 누출에 대한 환경위험지수는 위에 열거한 인구적 특성과 통계적으로 유의 미한 상관관계를 보여주었다. 이는 가난하고 학력 수준이 낮은 사람들이 인적 재난에 더 노출된 지역사회 에 사는 경향이 있음을 보여주고 있다.
키워드
:GIS, 방재, 환경재해, 홍수위험, 도시계획
Abstract
This research examined relationships between Scientifically Estimated Environ- mental Risks (SEERs) of floods, hurricanes and hazardous material releases, and household characteristics. This research showed that there were no statistically significant relationships be- tween most of the demographic characteristics (age, household size, tenure at the present home) and SEERs of the two natural hazards (a flood and a hurricane). These results support Drabek’s findings (1986) that people tend to underestimate or ignore natural hazards in selecting their resi- dence regardless of age, household size, and house tenure. Educational attainment and yearly household income were positively correlated with hurricane risk, but not with flood risk. By con- trast, SEER of hazardous materials was correlated with all demographic characteristics mentioned above. This result may show that those who are relatively poorer and have lower educational lev- el tend to be limited to living in communities more vulnerable to human-made risk.Keywords:GIS, Emergency Management, Environmental Hazard, Flood Risk, Urban Planning
**Dr. Seong-Nam Hwang, Lecturer, Department of Urban and Regional Planning, Dankook University [email protected]
**Dr. Chun-Man Cho, Associate Research Fellow, Korea Research Institute for Human Settlements [email protected](Corresponding Author)
1. Introduction
Extreme natural and technological hazards have continually claimed many deaths and caused enor- mous economic losses. Conard and his colleague[8]
estimate average annual federal expenditure for disaster relief and preparedness at $7 billion. In ad-
dition to the economic and human losses resulting
from environmental hazards, there are significant
social costs, like personal stress from evacuations,
life in temporary emergency shelters, and disruption
of neighborhoods. This increased vulnerability rais-
es questions about people’s perceptions of, and re-
sponse to, these environmental hazards.
This study considers three main hazards (i.e., floods, hurricanes, and technological hazards related with hazardous materials) to examine relationships between environmental hazards (estimated and per- ceived) and household characteristics.
First, flooding is a prominent natural hazard that has continually caused many deaths and enormous economic losses. Furthermore, many urban areas of the United States are intensively developing flood prone areas, causing the human and property vul- nerability to flood hazards to rise. In fact, flood- plains are occupied and utilized due to the economic advantages of level ground for transportation, fertile soils for agriculture, and available water sup- plies[24].
Second, a hurricane is a cyclone that originates in tropical oceans, accompanied by thunderstorms and circulating winds over tropical waters. Tropical storms occur approximately ten times per year between June 1 and November 30 over the Atlantic Ocean, Caribbean Sea, and Gulf of Mexico, and six of these storms usually become hurricanes that pose serious risk to the Atlantic or Gulf coast.
Lastly, technological hazards can be defined as
“the origins of incidents that can arise from human activities such as the manufacture, transportation, storage, and use of hazardous materials”[12], and that can arise from fire, and failure of structures and infrastructure. According to Cutter[10], techno- logical hazards can be referred to as the interaction between technology, society, and the environment.
Technological hazards, unlike natural hazards, were once believed to have little or no potential for caus- ing catastrophic levels of death and property dam- age[22]. However, during recent decades, the growth of chemical and nuclear technologies has been accompanied by the possibility of catastrophic and long‐term harm or damage to people, and property[23]. During recent decades, high‐profile hazardous material accidents stimulating environ- mental concern and research activity have included the 1984 Bhopal, India toxic chemical release; The 1979 Three Mile Island, Pennsylvania nuclear power
plant accident; the 1986 Chernobyl, Soviet Union nuclear power plant accident; and the 1989 Exxon Valdez oil spill, Alaska[6, 19, 21].
Compared to natural hazards, technological haz- ards have several distinctive attributes. First, tech- nological hazards are different from natural hazards, wars, and terrorism because they result from hu- man error or mismanagement of technology.
Technological hazards are products of our society that result from failures in technological systems as well as failures in the political, social, and economic systems that manage the use of those technological systems[10]. Technological hazards are interwoven with the elements of complexity, surprise, and interdependence. Therefore, technological hazards should be understood in terms of political, economic, social, and historical contexts within which they occur[10]. Second, some technological hazards can lead to insidious diseases that may not become evi- dent until many years later[15]. For example, Hoetmer[15] mentions that high toxic radioactive leaks that occurred from 1944 to 1947 at the Hanford Nuclear Reservation, Washington are now being re- garded as the cause of high incidences of cancer and heart problems among residents of the area. Third, many technological hazards are highly related to certain geographical areas. Geography helps us identify which areas are subject to the potential im- pacts of technological hazards, and who bears the risk of technological hazards[10]. Fourth, unlike most natural hazards, technological hazards such as invisible leaks and releases of hazardous materials can be preceded by little or no warning[15]. Finally, technological hazards are induced by industry and the widespread use of science[10]. The occurrence of technological events is increasing, as the creation of hundreds of new substances each year causes more chances for human error[15].
In the present study, environmental risk associ-
ated with floods, hurricanes, and technological(or
chemical) hazards will be scientifically estimated,
based upon location of a house within an area that
is expected to be affected by an extreme event with
a specified recurrence interval or intensity. For ex- ample, being located within the 100‐year flood plain means that the property has a chance of get- ting flooded once per 100 years. This will be re- garded as the highest flood risk area, a 500‐year flood as the second highest, and the other areas as essentially flood risk free areas. Similarly, the risk of a hazardous material release is measured by the likelihood of a major release; the nearer to a hazard- ous material facility, the higher likelihood of an event severe enough to threaten the residents’
health and safety. Finally, the risk of a hurricane is measured by being located in an area that is vulner- able to one of the five different categories of hurri- cane intensity. That is, hurricane risk is defined di- rectly in terms of intensity rather than recurrence interval. To examine the spatial distribution of the three risks, the risk area for each of the hazards will be defined and described in the section of methods and data. The study objective is to test whether scientifically estimated risk of multiple hazards is related to residents’ household characteristics.
2. HYPOTHESIS
In deciding on their residences, households em- phasize three attributes, given their budget and time constraints. These are space, accessibility, and en- vironmental amenities[13]. Assuming these non- marketed attributes to be normal goods, we can ex- pect that more affluent households will purchase more positive externalities instead of avoiding more negative externalities[18]. This implies that there will be a relationship between the spatial dis- tribution of environmental risk and social/econom- ic/demographic characteristics because there is em- pirical evidence that the more affluent put a higher value on environmental amenities, whereas the poor choose their homes in the communities more vul- nerable to environmental risk[18]. In regard to chemical risk, Hamilton (1995) provides several ar- guments to explain why the level of exposure to the
chemical risk may vary by ethnicity. Namely, own- ers of chemical facilities try to locate in commun- ities with disadvantaged ethnic minorities, where compensation due to economic loss is unlikely, and where heterogeneous income and ethnic groups have different propensities for political participation.
These arguments are supported by several studies showing that technological hazards such as toxic‐
waste sites and industrial pollution are more likely to be found in areas with high proportions of minor- ity households[6, 4].
Hypothesis:Scientifically estimated environ- mental risks of floods, hurricanes, and toxic chem- ical releases are related to household characteristics.
3. METHODS AND DATA
The study consists of: 1) mail survey data on re- spondents’ perceptions of environmental risks, their hazard mitigation measures, and their socio/eco- nomic/demographic characteristics; and 2) spatial data on three types of environmental risks (i.e., flood, hurricane, and chemical risk). Correlational analyses were implemented to empirically test rela- tionships of household characteristics with scien- tifically estimated environmental risk(SEER) The target population for this research consisted of single‐family dwelling owners residing within Harris County in 2002. The unit of analysis used to test the hypothesis was the single‐family housing unit and the household that owned it.
To randomly sample the required number of re-
spondents, a list of countywide single‐family resi-
dential property records (the sample frame of this
study) was obtained from the Harris County
Appraisal District. Based upon the residential parcel
records, stratified random sampling was employed
to select 800 households. There were four strat-
ification variables that were defined by the three
environmental hazards(floods, hurricanes and
chemical releases) and a no‐risk area. Two hun-
dred households were selected that were vulnerable
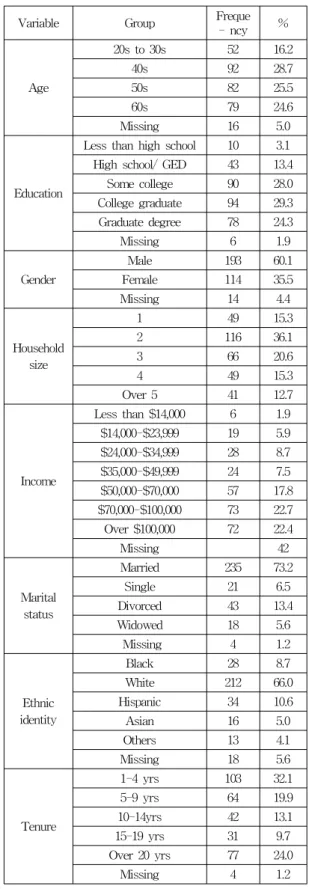
Variable Group Freque - ncy %
Age
20s to 30s 52 16.2
40s 92 28.7
50s 82 25.5
60s 79 24.6
Missing 16 5.0
Education
Less than high school 10 3.1 High school/ GED 43 13.4
Some college 90 28.0 College graduate 94 29.3 Graduate degree 78 24.3
Missing 6 1.9
Gender
Male 193 60.1
Female 114 35.5
Missing 14 4.4
Household size
1 49 15.3
2 116 36.1
3 66 20.6
4 49 15.3
Over 5 41 12.7
Income
Less than $14,000 6 1.9
$14,000-$23,999 19 5.9
$24,000-$34,999 28 8.7
$35,000-$49,999 24 7.5
$50,000-$70,000 57 17.8
$70,000-$100,000 73 22.7 Over $100,000 72 22.4
Missing 42
Marital status
Married 235 73.2
Single 21 6.5
Divorced 43 13.4
Widowed 18 5.6
Missing 4 1.2
Ethnic identity
Black 28 8.7
White 212 66.0
Hispanic 34 10.6
Asian 16 5.0
Others 13 4.1
Missing 18 5.6
Tenure
1-4 yrs 103 32.1
5-9 yrs 64 19.9
10-14yrs 42 13.1
15-19 yrs 31 9.7
Over 20 yrs 77 24.0
Missing 4 1.2
Table 1. Descriptive characteristics of SEERs to each hazard. In the cases selected for flood risk,
the FEMA’s flood insurance map for Harris County was used to randomly select 100 households in the 100 year flood plain and 100 households in the 500 year flood plain. In the cases selected for hurricane risk, 40 cases were selected from households located in each of the five hurricane risk areas. In the cases selected for chemical risk, 40 cases were randomly selected at increments of 0.5 mile from zero to 2.5 miles from the nearest hazardous material facility.
The remaining 200 households were randomly se- lected from an area comparatively free from these three types of hazards. Statistical power analysis showed that a sample size of 800 would have a 95%
confidence interval with 0.035 sampling error. A to- tal of 321 out of the sampled 800 single homeowners returned questionnaires for a gross response rate of 40.1%. However, one household was no longer at its original address, and two households turned out to live outside the study area. Because these three households were not replaced, this yielded an ad- justed response rate of 40.4%. The household char- acteristics (namely, social, economic, and demo- graphic characteristics) of the respondents (single family residential owners) are shown in Table 1. By age, respondents were broken into five groups.
Because the number of 20 and 29 year‐old re- spondents was small, they were combined with the group of 30‐and 39 year‐olds to produce a group of 20s and 30s. Ages 40‐49 accounted for 28.7% of the respondents, followed by 50 and‐59 year‐olds (25.5%).
The majority of the respondents were over 40
years old (about 80%; arithmetic mean, M=51.6
years). Educational attainment consisted of five
groups. The group with less than high school diplo-
mas had the smallest number (3.7%), whereas
13.4% had high‐school diplomas and 28.0% had
some college. The group with college degrees had
the highest number, accounting for 29.3% of the
sample, whereas the group with graduate school
degrees accounted for 24.3%. About 60% of the re-
spondents were male, while about 36 % were fe-
Figure 1. Map of Flood Risk male, and 4% of the respondents did not indicate
their gender. A plurality (36.1%) of the respondents was in households composed of two persons, and 20.6% were in households composed of three persons. The most frequent category of marital sta- tus was ‘Married’ (73.2%) whereas the least fre- quent was ‘Widowed’ (5.6%). For yearly household income, the respondents were divided into seven groups. 62.9% had an income of more than $50,000 whereas 7.8% of the participants had income of less than $23,999. The distribution of ethnicity was White (66.6%), Hispanic (10.6%), Black (8.7%), Asian (5.0%), and Others (4.1%). Others included American Indians and persons who declined to re- port their ethnicity. About 47% lived at the current residence for more than ten years.
3.1 Variables and Measurement
GIS techniques were used to delineate the spatial distribution of risk from flood, hurricane, and haz- ardous material facilities, and then to overlay each of the risk maps onto the parcel map that contained the locations of sampled housing units. Flood risk was assessed using the Federal Emergency Management Agency’s (FEMA) Flood Insurance Rate Map (FIRM) for year 1996 in Harris County.
This map identified areas most susceptible to flood- ing, which correspond to the 100‐ and 500‐year flood plains. The 100‐year flood plain (YFP) is the area that has an expected recurrence interval of 100 years, whereas the 500‐YFP has an expected re- currence interval of 500 years. Flood risk areas were overlapped with the parcel map of the survey re- spondents’ housing units to determine the level of flood risk at the housing unit level (see Figures 1).
The 100‐YFP areas were given an indexk of “5”
since they were the most susceptible to flooding, while the 500‐YFP areas were indexed as “1” since they are less susceptible to flood damage. The areas outside the 500‐YFP were indexed “0”.
To identify the hurricane risk areas, the hurricane risk area boundary map was used that was devel- oped at the Hazard Reduction & Recovery Center at
Texas A&M University for the Texas Division of
Emergency Management. Using the Saffir/Simpson
scale, this map divides hurricane risk areas into five
categories that correspond to a hurricane's
intensity. Specifically, hurricane risk areas were es-
timated using a computer program, called SLOSH
(Sea, Lake, and Overland Surges from Hurricanes)
to define risk areas from storm surge and the Inland
Wind Decay Model to define risk areas from hurri-
cane‐driven wind. The most susceptible areas are
those that lie along the shoreline, at low elevations,
or close to the waterfront. Thus, populations living
in hurricane Risk Area 1 would be most vulnerable
to surge and wind damage in the event of all cat-
egory hurricanes. As one moves farther inland, pop-
ulations become less vulnerable to wind and surge
action from a hurricane. With the exception of areas
free from hurricane hazard, the area identified as
Risk Area 5 is least subject to a hurricane and
would only be affected by flooding and wind dam-
age in the event of a Category 5 hurricane. The
hurricane risk area map was superimposed upon the
parcel map to decide each housing unit’s hurricane
risk level (see Figures 2). Hurricane Risk Area 1
was given a index of “5” since the area was the
most susceptible to all categories of hurricanes,
while hurricane Risk Area 5 was rated as “1” since
the area was susceptible only to a Category 5
hurricane. Areas outside these hurricane categories
were indexed as “0”.
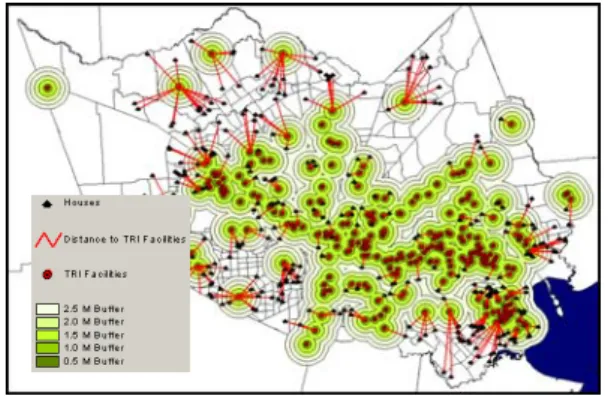
Figure 3. Map of Chemical Risk
Variable M SD N Min. Max.
Flood risk .84 1.698 321 0 5 Hurricane risk .83 1.535 321 0 5 Chemical risk 2.26 1.41 321 0.18 7.73 Table 2. Descriptive characteristics of SEERs Figure 2. Map of hurricane risk
The measure of chemical risk was based upon Toxic Release Inventory (TRI) facility data for 2000. This data base was developed and published on the Internet by the U.S. Environmental Protection Agency. As of 2000, there were 2206 TRI sites in Harris County. The data base has in- formation on the locations, types and quantities of nearly 650 chemicals being stored on‐site, the types and amounts of toxic chemical annually being released into the environment, and other waste management activities from various industries that use, store, and produce hazardous chemicals or materials.
GIS made it possible to geocode the TRI sites by means of their latitudes and longitudes. The TRI lo- cation map was overlapped with the parcel map to measure the distance from each respondent housing unit to its nearest TRI site (see Figures 3). Multiple TRI sites except for only a TRI site had to be dis- regarded even if a housing unit was located in an area where there were more than a TRI site. One of the reasons is that it is very difficult to identify the number of the hazardous materials, its amount and its quantity, and to investigate the extent and intensity of their danger in this research.
4. RESULTS
4.1 Scientifically Estimated Environmental Risks
As noted in the previous chapter, three types of
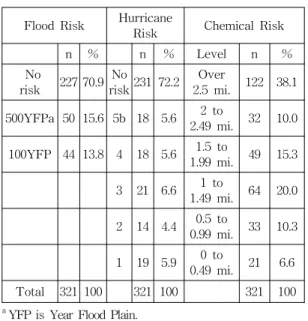
environmental risks – floods, hurricanes, and haz- ardous materials – were scientifically measured by using GIS techniques. Meanwhile, respondents were asked to report their social, economic, and house- hold characteristics in a survey questionnaire. Table 2 shows descriptive characteristics including the means, standard deviations, and minimum and maximum values of SEERs. Table 3 indicates the number and frequency for each level of SEERs. For SEER of floods, respondents’ homes were catego- rized into three groups: 100‐year flood plain (YFP), 500‐YFP and the no‐risk areas. Among single‐
family residents who returned their questionnaires, there were 227 houses (70.9 %) outside the two flood plain areas, 50 houses (15.6%) in 500‐YFP areas, and 44 houses (13.8%) in 100‐YFP areas.
Overall, 29.4% were located in an area with an iden- tifiable level of flood risk. The mean for flood risk was 0.84.
For SEER of hurricanes, the respondents’ homes
were divided into six groups, with the first group
residing outside hurricane risk areas, and the re-
maining five groups residing in areas with an iden-
tifiable level of hurricane risk. There were 231
houses (72.2%) with no hurricane risk, and the re-
maining 90 houses (27.8%) were almost equally
Flood Risk Hurricane
Risk Chemical Risk
n % n % Level n %
No
risk 227 70.9 No
risk 231 72.2 Over
2.5 mi. 122 38.1 500YFPa 50 15.6 5b 18 5.6 2 to
2.49 mi. 32 10.0 100YFP 44 13.8 4 18 5.6 1.5 to
1.99 mi. 49 15.3 3 21 6.6 1 to
1.49 mi. 64 20.0 2 14 4.4 0.5 to
0.99 mi. 33 10.3 1 19 5.9 0 to
0.49 mi. 21 6.6
Total 321 100 321 100 321 100
a
YFP is Year Flood Plain.
b
Hurricane Risk Area 5 corresponds to the least vulnerable area except “No‐Risk” area, whereas Hurricane Risk Area 1 corresponds to the most vulnerable area.
c
Miles.
Table 3. Number and frequency for each level of SEERs
M SD 1 2 3 4 5 6 7 8
1. AGE 51.57 12.88 1.00
2. EDU 3.59 1.10 ‐0.03 1.00
3. HSIZE 1.79 1.38 ‐0.30** ‐0.06 1.00
4. INCOME 5.20 1.65 ‐0.27** 0.42** 0.12 1.00 5. TENURE 153.5 139.1 0.62** ‐0.13* ‐0.23** ‐0.31** 1.00
6. FR 0.84 1.70 0.07 0.01 0.03 0.03 0.10 1.00
7. HR 0.83 1.54 0.00 0.13* 0.09 0.14* 0.02 ‐0.02 1.00 8. CR 2.26 1.41 ‐0.11* 0.15** 0.12* 0.24** ‐0.23** ‐ 0.14* ‐0.18** 1.00 1. age on last birthday; 2: educational attainment; 3: household size; 4: yearly household income; 5: tenure; 6: flood risk; 7: hurricane risk; 8: chemical risk
*. p < 0.05. **. p < 0.01. N = 279 to 321
Table 4. Correlation coefficients of household characteristics with SEERs spread over different hurricane risk areas. The
mean for hurricane risk was 0.83.
For SEER of hazardous materials, 122 houses (38.1%) were found to be comparatively safe, be- cause they were located over 2.5 miles away from any TRI facilities. The mean for chemical risk was 2.26 (miles). The minimum and maximum distances from TRI facilities were 0.18 and 7.73, respectively.
Table 4 shows the correlations among social, economic, and demographic variables, and the three types of SEERs. Not surprisingly, AGE was neg- atively correlated with INCOME (r = 0.28), whereas EDU was positively correlated with yearly house- hold income (r = 0.42). Additionally, AGE was pos- itively correlated with TENURE (r = 0.62), while HSIZE (household size) was negatively correlated with TENURE (r = 0.23).
Contrary to the hypothesis, there were no stat- istically significant relationships between most of the household characteristics (AGE, HSIZE, and TENURE) and scientifically estimated environ- mental risks of the two natural hazards (flood risk – FR and hurricane risk – HR). Only two house- hold characteristics (EDU and INCOME) were pos- itively correlated with HR (r = 0.13 and r = 0.14 each), but none were correlated with FR. These re- sults indicate that the greater the yearly household income and educational attainment, the greater the hurricane risk. These unanticipated results suggest that households with higher education level and higher income are likely to choose to locate their property at the hurricane risk areas, which usually command beautiful scenery and spectacular views.
Consistent with the hypothesis, scientifically es-
timated chemical risk (CR) was correlated with all
of the household characteristics. It should be noted
that a negative relationship between any household
characteristic (e.g., AGE) and CR means that the older they are, the greater the chemical risk, be- cause chemical risk, (which was measured by dis- tance), decreases with increments of distance.
Specifically, AGE and TENURE were negatively correlated with chemical risk (r = ‐0.11, and r =
‐0.23, respectively), whereas EDU, HSIZE, and INCOME were positively correlated with CR (r = 0.15, r = 0.12, r = 0.24, and r = 0.15, respectively).
In sum, the study hypothesis was partially sup- ported regarding the relationship between the risk of natural hazards and household characteristics, but was fully supported regarding the relationship between chemical risk and household chara- cteristics.
5. Conclusion
Previous research has found that people, regard- less of their’ race, and age tend to ignore their vul- nerability to natural hazards (Drabek, 1986), and to choose their residence with little or no consideration of the presence of natural hazards. One fundamental reason for neglecting the risk from natural hazards is that people do not have enough knowledge on how hazardous their natural environment is[9].
Meanwhile, other research has consistently docu- mented significant relationships between household characteristics and environmental risk from techno- logical hazards. For instance, empirical findings in- dicate that Afro‐Americans, other minority groups, and low‐income households are more likely to live in health‐threatening environmental conditions[7, 20]. Adeola[1, 2] also indicated that ethnicity (i.e., Blacks) was significantly related to households’
proximity to hazardous waste dumpsites or pet- rochemical facilities in the Baton Rouge Standard Metropolitan Statistical Area, Louisiana. Another study found that about 60% of Blacks and over 53%
of Hispanics lived and worked in neighborhoods with one or more hazardous waste sites[17].
The hypothesis of the present research is that scientifically estimated environmental risks
(SEERs) of natural and technological hazards are related to household characteristics. This hypoth- esis is based upon findings from past research that the affluent tend to choose their home in commun- ities with environmental amenities, whereas the poor tend to be limited to living in communities more vulnerable to environmental risk[18, 14].
The results of this research showed that there were no statistically significant relationships be- tween most of the household characteristics (age, ethnicity, household size, tenure at the present home) and the SEERs of the two natural hazards (a flood and a hurricane). These results support Drabek’s findings[11] that people tend to under- estimate or ignore natural hazards in selecting their residence regardless of age, household size, and house tenure. Educational attainment and yearly household income were positively correlated with hurricane risk, but not with flood risk.
Consistent with the hypothesis, SEER of hazard- ous materials was correlated with all household characteristics such as age, educational attainment, household size, yearly household income, and tenure at present home. Specifically, those at greatest risk from chemical hazards are older, have lived longer in their communities, all less educated, have smaller households and lower incomes, and are unmarried.
One of the main reasons the elderly have become long-term risk-area residents, it seems, is that they can't afford to move out though their property is vulnerable to risk of flooding, hurricane and chem- ical hazards.
References
[ 1 ] F. O. Adeola, 1995, Demographic and socio- economic differentials in residential propinquity to hazardous waste sites and environmental illness, Journal of the Community Development Society, vol. 26, pp. 15-40.
[ 2 ] F. O. Adeola, 2000, Endangered community, en-
during people: Toxic contamination, health and
adaptive responses in a local context, Environment
and Behavior, vol. 32, pp. 209-249.
[ 3 ] A. Baum, Fleming, R., and Singer, J. E, 1983, Coping with victimization by technological dis- aster, Journal of Social Issues, vol. 39, pp. 117-138.
[ 4 ] B. J. L. Berry, 1977, The social burdens of environ- mental pollution: A comparative metropolitan data source. Cambridge, MA: Ballinger Publishing Company.
[ 5 ] L. Bong-Kyu, 1999, A Study on Developing Environmental Information Systems for Present- ing Air Pollution Emission Data Using GIS, Jour- nal of Korea Spatial Information Society, vol. 1, no. 1, pp. 39-48.
[ 6 ] R. D. Bullard, 1983, Solid waste sites and the Houston Black community, Sociological Inquiry, vol. 53, pp. 273-288.
[ 7 ] R. D. Bullard, 1990, Dumping in Dixie: Race, class and environmental quality. Boulder, CO: Westview Press.
[ 8 ] D. R. Conard, B. McNitt and M. Stout, 1998, Higher ground: A report on voluntary property buyouts in the Nation’s floodplains, a common ground solution serving people at risk, taxpayers, and the environment. Washington, DC: National Wildlife Federation.
[ 9 ] V. T. Covello, 1983, The perception of techno- logical risks: A literature review. Technological Forecasting and Social Change, vol. 23, pp.
285-297.
[10] S. L. Cutter, 1993, Living with risk: The geography of technological hazards. London: Edward Arnold.
[11] T. Drabek, 1986, Human system responses to dis- aster: An inventory of sociological findings. New York: Springer Verlag.
[12] Federal Emergency Management Agency, 2002, State and local mitigation planning: How to guides.
Washington, D.C: Federal Emergency Manage- ment Agency.
[13] M. Fujita, 1989, Urban economic theory: Land use and city size. Cambridge, England: Cambridge University Press.
[14] J. T. Hamilton, 1995, Testing for environmental racism: Prejudice, profits, political power, Journal
of Policy Analysis Management. vol. 14, pp.
107-132.
[15] G. J. Hoetmer, Introduction. In T. Drabek & G. J.
Hoetmer (Ed.), 1991, Emergency management:
principles and practice for local government.
Washington D. C.: ICMA.
[16] W. Jae-Yoon, 2003, Development of Environ- mental Impact Assessment System Using Geographic Information System for Environment- friendly Construction, Journal of Korea Spatial Information Society, vol. 5, no. 2, pp. 33-53.
[17] W. Kriesel, 1996, J. C. Terence and A. Keeler, Neighborhood exposure to toxic releases: Are there racial inequities? Growth and Change, vol.
27, pp. 479-499.
[18] F. Liu, 1996, Environmental equity: Linking pop- ulation distribution with environmental risk distribution. Ph. D. Dissertation, the University of Pennsylvania.
[19] J. D. Maser and S. D. Solomon, 1990, Psychosocial and psychological consequences of exposure to extreme stressors, Journal of Applied Social Psychology, vol. 20, pp. 1725-1732.
[20] P. Mohai and B. Bryant, 1992, Environmental rac- ism: Reviewing the evidence. In B. Brayant & P.
Mohai (Ed.), Race and the incidence of environ- mental hazards: A time for discourse (pp.
163-176). Boulder, CO: Westview Press.
[21] S. J. Picou and D. A. Gill, 1996, The Exxon Valdez oil spill and chronic psychological stress. American Fisheries Symposium, vol. 18, pp. 879-893.
[22] E. L. Quarantelli, 1984, Sociobehavioral responses to chemical hazards: preparations for and re- sponses to acute chemical emergencies at the local community level. The Disaster Research Center Book and Monograph Series 17. Newark, Delaware: Disaster Research Center, University of Delaware.
[23] P. Slovic, 1987, Perception of risk. Science, vol.
236, pp. 280-285.
[24] Texas Division of Emergency Management, 2000,
Hazard analysis. Austin, TX: Texas Department
of Public Safety.
Manuscript received:2011.02.23 Revised:1차 2011.06.17 / 2차 2011.08.01 Accepted:2011.08.08
Seong-Nam Hwang
1994 Dept. of English Language and Literature, Dankook University(B.A.) 1999 Dept. of Landscape Architecture and Urban Planning, Texas A&M University(MUP)
2003 Dept. of Landscape Architecture and Urban Planning, Texas A&M University(Ph.D.)
2006~2007, 2010~2011 Instructor, Dept. of Urban and Regional Planning, Dankook University
2010~Present Visiting Professor, Wonkwang University 1998~2003 Graduate Research Assistant, Hazard Reduction & Recover Center, Texas A&M University, College Station, TX
2000~2000 Emergency Communication Intern, State of Alaska Division of Emergency Services (ADES), Fort Richardson, AL
Research Expertise ∙Emergency Management ∙Hazard Planning
∙GIS and spatial analysis for urban application and land use
Chun-Man Cho