A COMPARATIVE STUDY BETWEEN DEGREE OF CONVERSION AND FLEXURAL STRENGTH OF COMPOSITE RESINS
Seong-Hee Lee1, D.D.S., M.S.D., Ahran Pae2, D.D.S., M.S.D., Sung-Hun Kim3, D.D.S., Ph.D.
1Graduate School of Clinical Dentistry, Ewha Womans University
2Assistant Professor, Department of Dentistry, Ewha Womans University
3Assistant Professor, Department of Prosthodontics, Seoul National University
Statement of problem.Although many studies have been carried out to investigate the cor- relation between the degree of conversion and the flexural strength of composite resins, there is minimal information in the literature attempting to compare degree of conversion, flex- ural strength and their correlation between restorative composite resins and flowable composite resins.
Purpose. The purposes of this study were to measure the degree of conversion and flexural strength of composite resins with different rheological behavior and to correlate the two properties.
Materials and methods. Four restorative (Vit-l-escence, Z-250, Tetric ceram, Esthet-X) and four flowable (Aeliteflo, Admiraflow, Permaflo, Revolution) light-curing composite resins were inves- tigated. The degree of conversion(DC) was analyzed with Fourier transfer infra-red spec- troscopy(FTIR) spectrum by a potassium bromide(KBr) pellet transmission method. The spectrum of the unpolymerized specimen had been measured before the specimen was irradiated for 60s with a visible light curing unit. The polymerized specimen was scanned for its FTIR spec- trum. The flexural strength(FS) was measured with 3-point bending test according to ISO 4049 after storage in water at 37℃ for 24 hours. The data were statistically analyzed by an independent sample t-test and one-way ANOVA at the significance level of 0.05. The dependence of flexural strength on the degree of conversion was also analyzed by regression analysis.
Results.Mean DC and FS values ranged from 43% to 61% and from 84.7MPa to 156.7MPa respectively. DC values of the flowable composite resins were significantly higher than those of restorative composite resins (P < 0.05). The FS values of restorative composite resins were greater than those of flowable composite resins. No statistically significant correlation was observed between the DC and the FS tested in any of the composites. The dependence of FS on DC in restorative or flowable composite resins was not significant.
Conclusion.It can be concluded that radical polymerization of the organic matrix is not a major factor in determining flexural strength of the commercially available composite resins.
Key Words
Degree of conversion, Flexural strength, Restorative composite resin, Flowable composite resin J Korean Acad Prosthodont : Volume 44, Number 3, 2006
T
he application of Bis-GMA monomer and dental composites to restorative dentistry was so successful that it was soon adopted and dental composite has been successfully used as an esthetic filling material. Dental composite resins essentially comprise of resin matrix (organic phase), inorganic filler particles (dispersed phase), filler-matrix coupling agent (interphase) and minor additions including polymerization initiators, stabilizers and coloring pigments.1,2A number of factors influence the properties and the clinical per- formance of the polymerized composite resins.Such factors are molecular weight and viscosity of the resin matrix, the size and distribution of filler particles, the intensity and duration of curing light and the temperature of the resin at the moment of curing.3
Research on composites is being directed towards the development of much stronger sys- tems for better mechanical and physical char- acteristics.4Flexural strength (FS) is one of the important properties of composite resins when used in areas where heavy masticatory force occurs, especially in posterior regions. Thus, high flexural strength is desirable where stress is significant.1The other important characteristic of composite resins is the degree of conversion (DC). This is of great importance for the ulti- mate success of the restoration and clinical longevity of the restoration.5The results of microstructural analysis suggest that crack prop- agation in the experimental composite resins is mainly in the resin matrix. It is suggested that a possible approach to improvement of the strength of dental composite resins is to increase the strength of the resin matrix itself.6As physical and mechanical properties associated with dental composites are influenced by the level of con- version, it is desirable for all of its monomer to con- vert to polymer during the polymerization reac-
tion. However, with high molecular weight monomers, such as Bis-GMA or UDMA, there is always an incomplete and significant concen- tration of unreacted carbon-carbon double bonds remaining in the final product.7
There are two types of composite resins used in dentistry, restorative composite resins and flow- able composite resins. The difference is dependent on their viscosity. The viscosity of composite resins is a critical factor for the success of adhesion and manipulation. Although many studies have been carried out to investigate the correlation between the degree of conversion and the flexural strength of composite resins, there is little infor- mation in the literature attempting to compare the degree of conversion, flexural strength and their correlation between restorative composite resins and flowable composite resins.
The purposes of this in vitro study were to investigate the degree of conversion and the flexural strength of several commercially available composite resins with different rheological behav- ior and to correlate between the two properties.
The null hypothesis to be tested in this study was that there was no significant correlation between the degree of conversion and the flexural strength of the composite resins with different rhe- ological behavior.
MATERIAL AND METHODS
Eight commercially available light-cured com- posite resins were investigated. The brand names and manufacturers are listed in Table I. Vit-l- escence, Z-250, Tetric ceram and Esthet-X were restorative composite resins, and Aeliteflo, Admiraflow, Permaflo and Revolution were flowable composite resins. The intensity of cur- ing light was verified during the test using a radiometer (Curing Radiometer Model 100, Demetron Research Corp., Danbury, CT, USA).
A. Degree of conversion 1. Preparation of the specimen
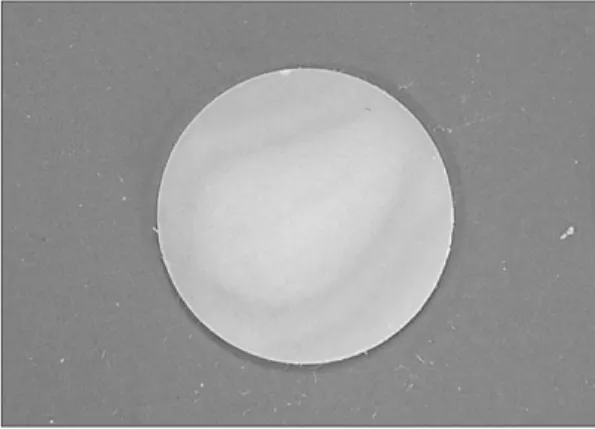
The resin paste was diluted with high purity KBr powder and mixed thoroughly in a pestle and mor- tar.(Fig. 1) The mixture was pressed with sufficient pressure (10 ton) to produce a transparent pel- let,(Fig. 2) which dimension was 0.75 mm in thick- ness and 13mm in diameter. The pellet was placed in the transmission holder for analysis. First, the spec- trum of the unpolymerized resin was measured, and then the resin specimen was irradiated for 60s with a visible light-curing unit (Optilux 360, Demetron Research Corp., Danbury, CT, USA). The poly- merized specimen was scanned for its FTIR spectrum at 5 min after the start of irradiation.8,9
2. Fourier transfer infra-red spectroscopy (FTIR)
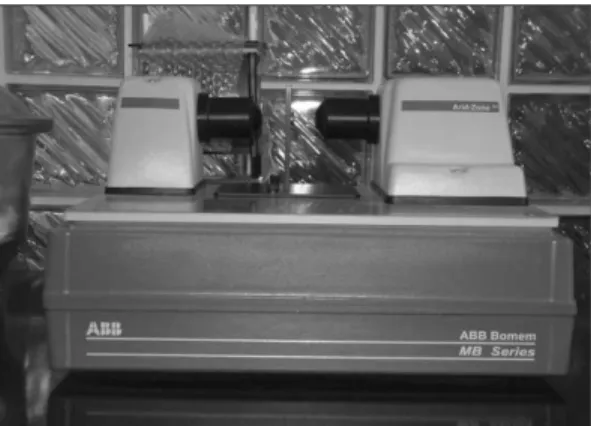
The DC in the bulk of the resin was analyzed by FTIR. The background spectra were collected through pure KBr pellet. For the measurement of DC, FTIR spectra of uncured and cured sam- ples of composite resins were analyzed on a FTIR spectrometer (Fig. 3, MB100, ABB Bomem, Canada) operating with 16 scans at a resolution
of 4 cm-1within a wave length of 400-2000 cm-1and then the range from 1560-1670 cm-1was expand- ed. From the FTIR spectra obtained, the ratio of peak intensities of aliphatic C=C to aromatic C=C (1640 and 1610 cm-1, respectively) were evaluated before and after irradiation to determine the percentage of unsaturated aliphatic C=C bonds remaining in the test material. To determine the percentage of reacted double bonds, the spec- tra, recorded initially as the transmission mode, were converted to the absorbance mode. The intensities of the aliphatic C=C absorbance peak at 1640 cm-1and the aromatic C=C reference peak at 1610 cm-1were measured. The DC was cal- culated by using the baseline method.
3. Calculation of the degree of conversion.
The DC of each specimen was equal to 100 minus (% C=C) (Equation 1).
100 - (% C = C) ………… (Equation 1) where,
(aliphatic C = C/aromatic C = C) polymcer
(% C = C) = ───────────────×100 (aliphatic C = C/aromatic C = C)
monomer Table I. Resin systems investigated in this study
Product Lot No. Manufacturer Characteristics
Vit-l-escence 1-800-552-5512 Ultradent, South Jordan, Utah, USA Bis-GMA
Z-250 4LAJ 3M-ESPE, St. Paul, MN, USA Bis-GMA,UDMA,Bis-EMA
Tetric ceram F50402 Ivoclar-Vivadent AG, Bis-GMA,UDMA,TEGDMA
Schaan / Liechtenstein
Esthet-X 309052 Dentsply Caulk, Milford, DE, USA Urethane modified Bis-GMA, TEGDMA
Aeliteflo 400004867 Bisco, Schaumburg, IL, USA Ethoxylated Bisphenol-A DMA, TEGDMA
Admiraflow 360729 Voco, Cuxhaven, Germany Ormocer
(anorganic-organic co-polymers), Permaflo 1-800-552-5512 Ultradent, South Jordan, Utah, USA Methacrylate-based
Revolution 402380 Kerr, Orange, CA, USA Bis-GMA
B. Flexural strength
1. Preparation of the specimen
For flexural strength testing, a stainless steel mold (Fig. 4) was used for preparation of the specimen (25 mm × 2 mm × 2 mm). Light-cured composite resin was condensed into the mold and the mid- dle third of the specimen was first activated for 40s with 400 mW/cm2, and then the remaining thirds were activated at the same intensity and curing time as the middle third. The illuminated areas overlapped. The light intensity of the lamp was tested regularly with a radiation meter and was at the same level during all tests. Following a pos- sible post-cure, the specimens were placed in water at 37℃ for 24 hours. After storage, the specimens were ground on a wet sand paper (grit 600) and measured using a digital vernier caliper. Measurements were taken from two locations for length, width and height. The aver- age of the two values was taken to calculate the flexural strength.10,11
2. Calculation of flexural strength
The flexural strength of the polymerized resins
was measured with the three point bending test according to the ISO 4049. Flexural strength test- ing was carried out with an Instron Universal test- ing machine (Model 4201, Norwood, MA, USA) at a crosshead speed of 0.5 mm/min until the spec- imen was fractured. The maximum load exerted on the specimen was recorded, and flexural strength (MPa) was calculated using the follow- ing equation (Equation 2);
3FL
FS = ──── (Equation 2) 2bh2
where F is the maximum applied load, L is the supporting span length (20 mm), b is the width of the test specimen, h is the height of the test specimen. Seven specimens were tested for each material.
C. Statistical analysis
A mean value and standard deviation were computed in each experimental group.
Independent sample t-test, one-way ANOVA and multiple-comparison Scheffe′test were per- formed at the significance of 0.05.(SPSS ver. 11.0, SPSS Inc., Chicago, IL, USA) Dependence of the flexural strength on the degree of conversion
Fig. 1.Mix thoroughly in a pestle and mortar. Fig. 2.Transparent pellet.
between materials was also analyzed by regres- sion analysis.
RESULTS
A. Degree of conversion
Fig. 5 shows the spectra obtained for the pre- and post- irradiation of the Aeliteflo. The aromatic C=C stretching mode at 1610 cm-1(internal standard) and the aliphatic C=C stretching mode at 1640 cm-1 are clearly detected. The ratio of aliphatic C=C after polymerization was decreased obviously as com- pared with the ratio of aromatic C=C. Since aro- matic C=C, which is used as an internal standard, does not change during the polymerization, infrared absorption ratio of residual unpoly- merized aliphatic C=C to aromatic C=C was compared by baseline method.
Table II and Fig. 6 present that the degree of con- version values ranged from 43 % to 61 %. Z-250 showed the lowest DC (43%) and Aeliteflo showed the highest DC (61%). Table II also shows that sta- tistically significant differences between two experimental groups (P<0.05) were found. The DC values of the flowable composite resins are sig- nificantly greater than those of restorative com-
posite resins. Inter-material comparisons of DC pre- sented that the value of Z-250 was lower than that of Vit-l-escence, Aeliteflo and Permaflo and the val- ue of Esthet-X was lower than that of Aeliteflo and Permaflo.(P < 0.05) With the restorative com- posite, the value of Z-250 was lower than that of Vit-l-escence and Tetric ceram and the value of Vit- l-escence was higher than that of Esthet-X and Z- 250. With the flowable composite resin, the val- ue of Aeliteflo was significantly higher than that of Admiraflow.
Fig. 3.FTIR spectrometer. Fig. 4.Stainless steel mold.
Fig. 5.FTIR spectrum of Aeliteflo. Before (red) and after (blue) polymerization.
0 2 4 6 8
10
1660 1640 1620 1600 1580 1560
wave number (cm -1)
Absorbance
B. Flexural strength
Table III and Fig. 7 present that the mean flex- ural strength ranged from 84.7MPa to 156.7MPa.
Z-250 showed the highest FS (156.7MPa) among the test materials but significantly lower DC than all the other brands. On the other hand, Revolution showed the lowest FS (84.7MPa).
The comparison of FS between restorative and flowable composite resins is also presented in Table III. As expected, statistically significant differences (P<0.05) were found between two experimental
groups. Flowable composite resins showed low- er FS than restorative composite resins. In the flex- ural strength test, through ANOVA multiple comparisons, the restorative composite resin presented the flexural strength from highest to low- est as follows; Z-250 > Vit-l-escence > Tetric cer- am = Esthet-X. The flexural strength of the flow- able composite resin presented from highest to low- est as follows; Permaflo > Aeliteflo = Admiraflow
> Revolution. Significant difference was observed between the brands.
Fig. 6.Mean of the degree of conversion value. Fig. 7.Mean of the flexural strength.
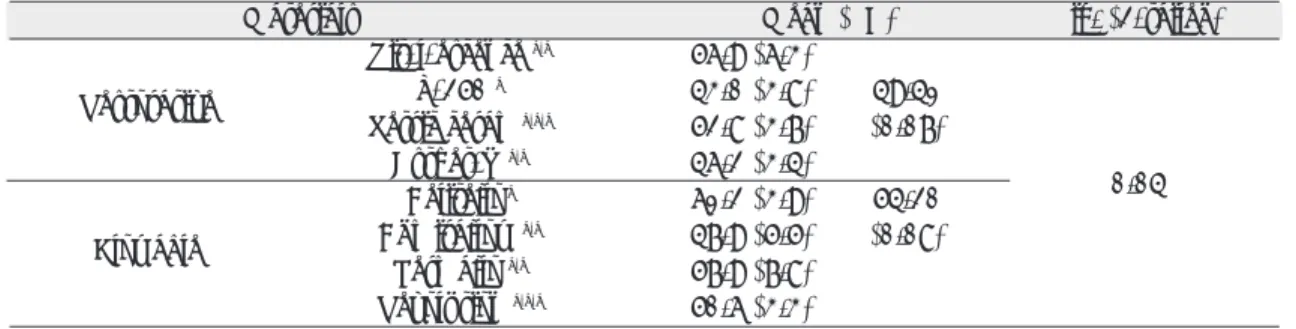
Table II. Mean, SD and Independent Samples t-Test of the DC value
Materials Mean (SD) Sig. (2-tailed)
Vit-l-escence b,c 56.9 (6.3)
Restorative Z-250 a 43.0 (3.8) 49.41
Tetric cerama,b,c 52.8 (3.7) (0.07) Esthet-X a,b 46.2 (3.4)
Aelitefloc 61.2 (3.9) 54.20 0.04
Flowable Admiraflow a,b 47.9 (5.5) (0.08)
Permaflo b,c 57.9 (7.8) Revolution a,b,c 50.6 (3.3) (Letters indicate statistically similar groups.)
60 50 40 30 20 10
0
Vit-l-esc Z-250 Tetric ce Esthet-X Aeliteflo Admiraf Permaf Revolution Materials
Vit-l-esc Z-250 Tetric ce Esthet-X Aeliteflo Admiraf Permaf Revolution Materials
Mean DC
180 160 140 120 100 80 60 40 20 0
Mean FS
C. Regression analysis
Regression analyses were performed on the relationship between the DC and the FS. The plots in Fig. 8 to 10 show the correlation between the DC and the FS of the commercially avail-
able composite resins. In restorative and flowable composite resins respectively, direct linear rela- tionship was not present between the DC and the FS (Table IV). In this study, no statistically sig- nificant correlation was observed between the DC and the FS tested in any of the resins.
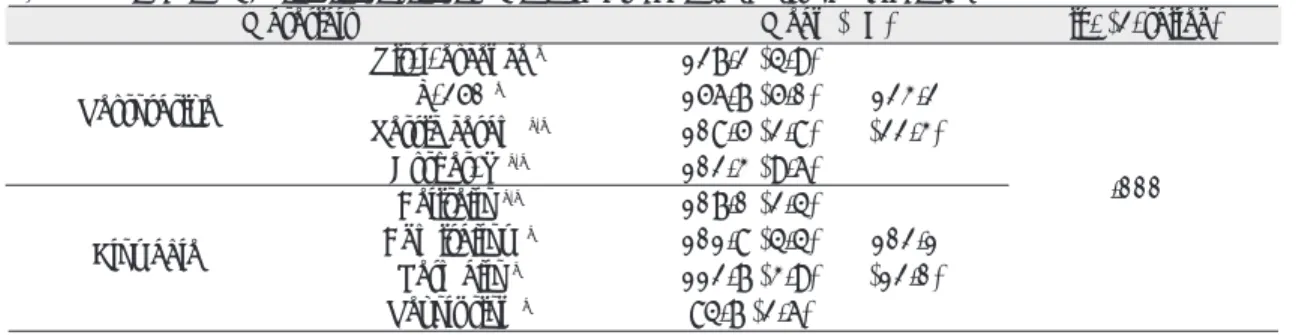
Table III. Mean, SD and Independent Samples t-Test of the flexural strength
Materials Mean (SD) Sig. (2-tailed)
Vit-l-escence d 127.2 (4.9)
Restorative Z-250 e 156.7 (5.0) 123.2
Tetric ceram b,c 108.5 (2.8) (22.3) Esthet-X b,c 102.3 (9.6)
Aeliteflo b,c 107.0 (2.4) .000
Flowable Admiraflow b 101.8 (4.4) 102.1
Permaflo c 112.7 (3.9) (12.0) Revolution a 84.7 (2.6)
(Letters indicate statistically similar groups.)
Table IV. Regression analysis. Dependent Variable: FS (P<0.05)
Model Sig.
Total Restorative Flowable
(Constant) 067 268 601
DC 549 634 383
Fig. 8. The correlation between the DC and the FS of the investigated composite resins.
Fig. 9. The correlation between the DC and the FS of the restorative composite resins.
MATERIAL
DC
42.96 47.86 52.76 57.85 46.18 50.55 56.85 61.19 180
160
140
120
100
80
160
150 140
130
120
110 100 vit-l-escence
Z-250 tetric ceram esthet-x aeliteflo admiraflow permaflo revolution
Vit-l-escence Tetric ceram Esthet-x Z-250
Mean FS FS
DC
42 44 46 48 50 52 54 56 58 RESTORAT
DISCUSSION
Among several methods8,12-19for the determination of DC of dental resins, FTIR was used in this study as a reliable method.8,20It has been widely used as it detects the C=C stretching vibrations directly before and after curing of composite resins. FTIR spectroscopy is based on the absorp- tion of radiation in the infrared frequency range due to molecular vibrations of the functional groups contained in the polymeric chain.13,16
Ferracane and Greener studied the unfilled Bis-GMA-based resins and found that the degree of conversion for the experimental resins var- ied between 55 % and 72 %.8Chung and Greener reported that the degree of conversion of seven light-cured posterior composites ranged from 43.5 % to 73.8 %.4The DC of composite resins inves- tigated in this study ranged from 43.0 to 61.2 %.
This is very much in agreement with the results of previous studies.4,8,14,21The DC of the low viscosity materials, flowable resins, which ranged from 47.9 to 61.2 %, exhibited significantly higher than that of the high viscosity materials, restorative com- posite resins, which ranged from 43.0 to 56.8 %.
It is suggested that the higher value of DC of flow-
able composite resins was related to the increased molecular movement due to increased rheolog- ical effect when the filler volume is reduced.
And another possible explanation might be due to the difference of composition of the monomer in the resin matrix system. Flowable resins were added with more amount of diluent or thinner with low molecular size than restorative composite resins in order to reduce their viscosity. The monomers with lower molecular weight were freer to move than those with higher molecular weight. As a result, more three-dimensional net- work was formed in the flowable resins during polymerization.
Contrary to the results of DC, in this study the flexural strength of flowable composites was significantly lower than that of restorative com- posites. Flexural strength can be attributed to the filler content of the composite resins. Previous studies have reported a positive correlation between the mechanical properties and volu- metric fraction of fillers.22-24Highly filled composite resin is expected to be stronger than that with low- er filler loading. Dental clinicians should keep in mind this variety when they decide on cavity design and materials to use. Low FS would be impractical for clinical placement in load bearing posterior cavities.
Z-250, which has a high filler volume, exhibit- ed highest flexural strength, even though its DC was the lowest. A blend of UDMA and Bis-EMA, which is diluent of Z-250, has large molecular weight, so their molecular movement may have been decreased and they have fewer double bonds per unit of weight than TEGDMA. High resin viscosity restricted the mobility of reactive radicals and reduced the frequency and probability of random encounters, which led to a decrease in polymerization propagation. Due to these reasons, the DC of Z-250 is low.9
DC of composite resin system significantly Fig. 10. The correlation between the DC and the FS of
the flowable composite resins.
Aeliteflo Permaflo Revolution Admiraflow 120
110
100
90
80
46 48 50 52 54 56 58 60 62 DC
FLOWABLE
FS
affects its material properties, especially mechan- ical strength.6,19,25It is generally accepted that this strength is increased with the increase of DC.
In the lower DC case, unreacted monomers remaining in the material may break the integri- ty of polymer structure. This jeopardizes the clinical serviceability of composite through accel- erated wear and discoloration of the materials.26 Thus, the higher the conversion of double bonds, the greater the mechanical strength.25,27However, a direct linear relationship was not present between the DC and FS of the tested materials. This no correlation was similar to the Ferracane’s study,24which tried to make a correlation between hardness and degree of conversion. The reason why there was no correlation between the DC and FS of the composite resins investigated in this study was that each composite has different organic matrix compositions and different filler load- ings. Direct comparison could not be used to predict the correlation of the DC and the FS when comparing different brands. Varying the rel- ative amounts of UDMA, Bis-GMA and TEGDMA in the matrix could have a varying effect on the mechanical properties of the composites.18,28 The lack of correlation between DC and FS can be explained by multi-factorial determinants of mechanical property, such as formulation of diluents, filler composition, morphology and concentration. Generally, these various factors do not individually provide the composite with all the desirable characteristics. They should always be improved together.
FS is related more to the amount of inorganic filler in highly-filled composite, so as to com- pare the DC and the FS, experimental composite resins have to contain the same amount of filler.
But all the tested materials have different com- position according to their manufacturers. The lim- itations of this study may be the small sample size and the usage of composites with different monomer composition and filler loading.
Polymerization shrinkage is a critical short- coming of dental resins and may contribute to microleakage. An increase in the filler content of composite resin lessens the polymerization shrink- age. As the composite resin becomes more flow- able, the restoration will shrink more. High DC brings about increased polymerization shrinkage, so to compensate it clinically, the clinician has to add composite with small amount using layering technique in the prepared cavity. The choice of composite resin depends upon various clinical sit- uations. To improve the properties of the composite materials, further investigations are needed to search for the filler composition which best suits all clinical situations. Modifying the inorganic phase and the monomer composition of the composite resins to achieve higher degree of conversion should also be focused on in further research.
CONCLUSION
Within the limitations of this study, the fol- lowing conclusions were drawn;
1. The degree of conversion of the restorative composite resins was significantly lower than that of the flowable composite resins.(P <
0.05)
2. The flexural strength of the restorative composite resins was significantly higher than that of the flowable composite resins.(P < 0.05) Flexural strength of the composite resins in the same class was significantly different between brands.
3. No significant correlation was found between the degree of conversion and the flexural strength of the materials investigated.
REFERENCES
1. Yap AU, Chandra SP, Chung SM, Lim CT. Changes in flexural properties of composite restoratives after aging in water. Oper Dent 2002;27:468-74.
2. Yap AU, Teoh SH. Comparison of flexural prop-
erties of composite restoratives using the ISO and mini-flexural tests. J Oral Rehabil 2003;30:171-7.
3. Li J, Nicander I, von Beetzen M, Sundstrom F.
Influence of paste temperature at curing on con- version rate and bending strength of light-cured den- tal composites. J Oral Rehabil 1996;23:298-301.
4. Chung K, Greener EH. Degree of conversion of sev- en visible light-cured posterior composites. J Oral Rehabil 1988;15:555-60.
5. Ferracane JL, Ferracane LL, Musanje L. Effect of light activation method on flexural properties of dental composites. Am J Dent 2003;16:318-22.
6. Kawaguchi M, Fukushima T, Horibe T. Effect of monomer structure on the mechanical properties of light-cured composite resins. Dent Mater 1989;8:40-5.
7. Chung KH. The relationship between composition and properties of posterior resin composites. J Dent Res 1990;69:852-6.
8. Ferracane JL, Greener EH. FTIR analysis of degree of polymerization in unfilled resins-methods com- parison. J Dent Res 1984;63:1093-5.
9. Palin WM, Fleming GJ, Burke FJ, Marquis PM, Randall RC. Monomer conversion versus flexure strength of a novel dental composite. J Dent 2003;31:341-51.
10. ISO 4049. Dental resin-based restorative materials.
Geneva: International Organization for Standardization;1985.
11. Kim KH, Ong JL, Okuno O. The effect of filler loading and morphology on the mechanical prop- erties of contemporary composites. J Prosthet Dent 2002;87:642-9.
12. Rueggeberg FA, Craig RG. Correlation of parameters used to estimate monomer conversion in a light- cured composite. J Dent Res 1988;67:932-7.
13. Imazato S, McCabe JF, Tarumi H, Ehara A, Ebisu S. Degree of conversion of composites measured by DTA and FTIR. Dent Mater 2001;17:178-83.
14. Silva Soares LE, Martin AA, Barbosa Pinheiro AL. Degree of conversion of composite resin: a Raman study. J Clin Laser Medicine & Surgery 2003;21:357-62.
15. Eliades GC, Vougiouklakis GJ, Caputo AA. Degree of double bond conversion in light-cured com- posites. Dent Mater 1987;3:19-25.
16. Yoon TH, Lee YK, Lim BS, Kim CW. Degree of poly- merization of resin composites by different light sources. J Oral Rehabil 2002;29:1165-73.
17. Stansbury JW. Determination of double bond conversion in dental resins by near infrared spec-
troscopy. Dent Mater 2001;17:71-9.
18. Asmussen E. Factors affecting the quantity of re- maining double bonds in restorative resin polymers.
Scan J Dent Res 1982;90:490-6.
19. Lovell LG, Lu H, Elliott JE, Stansbury JW, Bowman CN. The effect of cure rate on the mechanical properties of dental resins. Dent Mater 2001;17:504- 11.
20. Pianelli C, Devaux J, Bebelman S, Leloup G. The mi- cro-raman spectroscopy, a useful tool to deter- mine the degree of conversion of light-activated composite resins. J Biomed Mater Res 1999;48:675- 81.
21. Rueggeberg FA, Hashinger DT, Fairhurst CW.
Calibration of FTIR conversion analysis of con- temporary dental resin composites. Dent Mater 1990;6:241-9.
22. Chung K, Greener EH. Correlation between degree of conversion, filler concentration and mechanical properties of posterior composite resins. J Oral Rehabil 1990;17:487-94.
23. Braem M, Finger W, van Doren VE, Lambrechts P, Vanherle G. Mechanical properties and filler frac- tion of dental composites. Dent Mater 1989;5:346- 9.
24. Ferracane JL. Variables affecting the fracture toughness of dental composites. J Dent Res 1987;66:1140-5.
25. Ferracane JL, Berge HX, Condon JR. In vitro aging of dental composites in water- effect of degree of conversion, filler volume, and filler matrix cou- pling. J Biomed Mater Res 1998;42:465-72.
26. Sideridou I, Tserki V, Papanastasiou G. Effect of chemical structure on degree of conversion in light cured dimethacrylate-based dental resins.
Biomaterials 2002;23:1819-29.
27. Lovell LG, Newman SM, Donaldson MM, Bowman CN. The effect of light intensity on double bond con- version and flexural strength of a model, unfilled resin. Dent Mater 2003;19:458-65.
28. Peutzfeldt A. Resin composite in dentistry: the monomer systems. Eur J Oral Sci 1997;105:97-116.
Reprint request to:
SUNG-HUNKIM D.D.S., Ph.D.
DEPARTMENT OFPROSTHODONTICS,GRADUATESCHOOL
SEOULNATIONALUNIVERSITY
28-1, YEONGUN-DONG,CHONGNO-GU,SEOUL,10-749, KOREA