http://e-nrp.org
Combined effect of folate and adiposity on homocysteine in children at three years of age
Su Jin Cho
1§, Hye Ah Lee
2, Bo Hyun Park
2, Eun Hee Ha
2, Young Ju Kim
3, Eun Ae Park
1and Hyesook Park
2*
1Department of Pediatrics, Ewha Womans University School of Medicine, 1071 Anyangcheon-ro, Yangcheon-gu, Seoul 07985, Korea
2Department of Preventive Medicine, Ewha Womans University School of Medicine, Seoul 07985, Korea
3Department of Obstetrics, Ewha Womans University School of Medicine, Seoul 07985, Korea
BACKGROUND/OBJECTIVES: Cardiovascular diseases is a major cause of death and is responsible for 23.8% of deaths in Korea.
Clinical symptoms manifest in adulthood, but susceptibility begins in utero. Elevated homocysteine levels and adiposity might be linked to a greater risk in children as well as adults. We hypothesized that those who have simultaneous risk for folate and adiposity would be affected with elevated homocysteine levels at 3 years of age.
SUBJECTS/METHODS: From the ongoing birth cohort at Ewha Womans University Mok-Dong Hospital, we compared adiposity parameters, serum homocysteine, and folate levels in 238 children (118 boys and 120 girls) at three years of age. The relationship between birth outcome, current weight and body mass index (BMI), postnatal growth, and homocysteine level were assessed using correlation and general linear model. Additionally, we assessed the combined effect between blood folate status and adiposity on current homocysteine levels.
RESULTS: Birth characteristics were not correlated with homocysteine. Current weight, BMI, upper-arm circumference, skinfold thickness, waist circumference, and hip circumference were positively correlated with homocysteine at three years of age (P
< 0.05). Folate level was negatively correlated with homocysteine at three years of age (P < 0.0001). A relative high anthropometric measure which is compatible with adiposity and low folate level was associated with high homocysteine levels.
CONCLUSION: We found a combined effect of adiposity and folate levels with homocysteine levels at three years of age. This implicates the beneficial role of folate supplementation in the high-risk population at an early age.
Nutrition Research and Practice 2016;10(1):74-80; doi:10.4162/nrp.2016.10.1.74; pISSN 1976-1457 eISSN 2005-6168
Keywords: Homocysteine, folate, cardiovascular risk, adiposity, children
INTRODUCTION
10)Cardiovascular disease (CVD) is a major cause of death in developed countries [1] and is responsible for 23.8% of deaths in Korea. Adult CVD has a prolonged latent period and atherosclerosis begins early in childhood; fatty streaks in the aorta are common even in 3 year olds [2]. Similar findings were found in autopsies from participants in the Bogalusa Heart Study in whom adiposity and other previously measured risk factors including blood pressure and blood lipids, correlated with the extent of coronary and aortic atherosclerosis [3].
Furthermore the origin of CVD may be found in fetal life. The fetal origins hypothesis suggests that an adverse early life environment has a lasting effect on health in later life [4].
In addition to emphasizing the significance of birth weight and gestational age, the current concept also focuses on postnatal growth and adiposity [4,5]. To assess the impact of
intrauterine life on later life along with adiposity, it is necessary to follow up a group of children longitudinally from fetal period to adulthood via a birth cohort. While atherosclerosis has been clearly shown to begin in childhood, the process is usually subclinical and the rate of progression is slow, but the appro- priate intervention would be preventive of clinical diseases for the high risk population [6].
Homocysteine is a non-proteinogenic, sulphur-containing amino acid derived from the metabolism of methionine [7].
Genetic defects, vitamin deficiencies or renal impairment cause elevated plasma total homocysteine and direct toxic endothelial cell damage generating potent reactive oxygen species that induce oxidative damage and decrease endothelial production of nitric oxide. This impairs the endothelial dependent vascular reactivity and activates platelets to form thrombus [8].
Epidemiological studies have shown that elevated homocys- teine level is related to a higher risk of cardiovascular disease,
This study was supported by the Seoul Development Institute (10621M0207331) This work was supported by the Ewha Womans University Research Grant of 2014
§Corresponding Author: Su Jin Cho, Tel. 822-2650-5275, Fax. 822-2653-3718, Email. [email protected] Received: April 22, 2015, Revised: November 25, 2015, Accepted: November 25, 2015
* This author contributed equally to this work
This is an Open Access article distributed under the terms of the Creative Commons Attribution Non-Commercial License (http://creativecommons.org/licenses/by-nc/3.0/) which permits unrestricted non-commercial use, distribution, and reproduction in any medium, provided the original work is properly cited.
stroke and peripheral vascular disease in adults [9]. Meta-analyses of cohort studies show significant positive associations between serum homocysteine and ischemic heart diseases; a 2.5 times higher risk of subsequent coronary events and each 5 mmol/l increment was associated with a 25% higher risk [10]. Throug- hout life, the level of homocysteine in plasma increases along with aging in both males and females. High plasma total homocysteine in children was related to CVD or death in their parents or close relatives in white and black children and in white children with hypercholesterolemia [11]. Folate level is a well known modifying factor that affects circulating homo- cysteine level [6]. However, the association between adiposity and homocysteine in children is debated [12-14]. Therefore the present study was undertaken to prospectively study the impact of adiposity including characteristics at birth and postnatal growth on homocysteine levels in children at three years of age in an ongoing birth cohort in South Korea. Additionally, we examined whether those with relatively high adiposity with low folate level are associated with high level of homocysteine.
SUBJECTS AND METHODS Study subjects
In order to investigate the correlation between fetal environ- ment and adult diseases, an ongoing birth cohort has been established in 2001 at Ewha Womans University Mok-Dong Hospital. Pregnant women are enrolled in the antenatal period during the second trimester. Detailed description for birth cohorts has already been reported elsewhere [15]. The Institu- tional Research Board on human subjects at Ewha Womans University approved the protocol and informed consents were obtained. Out of 734 children enrolled in the birth cohort, 527 children were contacted from November of 2005 to November of 2007 around their third birthday. Out of the 527 children contacted, 238 children (45.2%) participated in the three year check-up program.
Data
Birth data such as birth date, sex, gestational age, birth weight, and placenta weights were obtained from medical records. As routine definition, < 37 weeks of gestation age and < 2.5 kg of birth weight were defined preterm and low birth weight, respectively. At the three year check-up program, all anthropometric indicators were measured by well-trained examiners. Height and weight were measured to one decimal place while wearing light clothing and without shoes using a stadiometer and calibrated scale (DS-102 model, Dong Sahn Jenix Co. Ltd, Seoul, Korea).
Waist circumferences, upper-arm circumferences, skinfold thickness, and hip circumference were also measured as anthropometric indicators for adiposity. Body mass index was calculated as weight in kilograms divided by height in meters squared (kg/m
2). To convert into z score, age was calculated in months.
The birth weight and current weight were transferred to an age- and gender- specific z score criteria reference source from the 2007 Korean Children and Adolescents Growth Standards [16]. To explain the postnatal growth, the change of weight z score was calculated by subtracting the birth weight z score from the current weight z score. Catch-up growth was defined
as greater than 0.67 (equal to 75
thpercentile) at current weight z score if born preterm or of low birth weight and others with a change of weight z score more than 0.67 [16].
Venous samples were collected after 12 hour fasting and centrifuged within 2 hours. Homocysteine levels was measured by the method previously described by Araki et al. [17] using the high performance liquid chromatography (HPLC) - fluorescence detection method. A HPLC system was equipped with a column (Waters XTerra
TMRP
18, 5-μm particle size, 4.6 × 250 mm column, Waters Co., MA, USA), pumps (Waters 2690, Waters Co., MA, USA), HPLC integrator (Younglin Autochro-win ver 2.0, Younglin, Korea), and Fluorescence Detector (Waters 474, Waters Co., MA, USA), under the condition excitation/emission wave length of 385 nm/515 nm. Folate was measured by radioimmunoassay kit (Diagnostic Products Corporation, Los Angeles, CA, USA). The inter-assay differentiation coefficient was set at 4.0%.
Statistical analysis
Data analysis was performed using the statistical package SAS version 9.3 (SAS Institutes, Cary, NC, USA). As possible indepen- dent variables, we considered characteristics at birth (gestational age, birth weight, placenta weight, preterm, and low birth weight), adiposity-related anthropometric measurements at 3 years of age (weights, BMI, waist, upper-arm circumferences, skin-fold thickness, and hip circumferences), postnatal growth (change of weight z scores from birth to current, catch-up growth) and blood folate level. The outcome variable was the homocysteine level. Homocysteine and folate were used as log-transformed value to meet the normality assumption and then results were presented as back transformed values. Pearson correlation was used to investigate the strength of linearity between homocysteine and possible independent variables above mentioned. The impact of adiposity including charac- teristics at birth and postnatal growth on homocysteine levels were analyzed under controlling for age and sex (model 1), additionally including blood folate level (model 2) using a generalized linear model. Considering the statistical power, we used an operational definition for high risk of obesity and low folate level to assess the combined effect between blood folate level and adiposity on current homocysteine levels. Adiposity- related anthropometric measurements were divided into two groups (< 75
thpercentile or ≥ 75
thpercentile), folate levels were also divided into two groups (< 25
thpercentile or ≥ 25
thpercentile, cut point value: 6.9 ng/ml), and defined as low and high, respectively. Indeed, normal concentration of serum folate suggested by WHO ranges from 6 to 20 ng/ml for all aged person [18]. In turn the subjects were grouped into four groups:
low adiposity measures with high folate (low risk group), low adiposity measures with low folate, high adiposity measures with high folate, and high adiposity measures with low folate (high risk group). Regarding the characteristics at birth and postnatal growth, preterm, low birth weight, and catch-up growth were considered as risk group on the basis of previous studies [2,4-6,8]. Grouping was followed as mentioned above.
After controlling for age and sex, adjusted means differences
of homocysteine among groups was tested using a generalized
linear model. The multiple comparisons were conducted using
Bonferroni method. Statistical significance was noted as P < 0.05
Total (n = 238)
Boys (n = 118)
Girls (n = 120)
Correlation coefficient with homocysteine At Birth
Gestational age (weeks) 37.6 (2.4) 38.0 (2.2) 37.4 (2.6) -0.04
Preterm (< 37 weeks) 61 (25.63%) 25 (21.19%) 36 (30.00%)
Birth weight (kg) 2.90 (0.65) 2.96 (0.65) 2.84 (0.65) 0.01
Low birth weight (< 2.5 kg) 60 (25.21%) 28 (23.73%) 32 (26.67%)
Placenta weight (g) 0.60 (0.08) 0.61 (0.07) 0.59 (0.08) 0.09
At 3 years of age Anthropometric measures
Heights (cm) 98.27 (4.78) 99.43 (4.79) 97.13 (4.50)a 0.03
Weights (kg) 15.12 (2.01) 15.51 (2.21) 14.75 (1.71)a 0.14**
Body mass index (kg/m2) 15.63 (1.46) 15.65 (1.62) 15.61 (1.29) 0.15**
Waist circumferences (cm) 49.14 (3.39) 49.29 (3.56) 48.98 (3.21) 0.13***
Upper-arm circumferences (cm) 16.25 (1.60) 16.25 (1.60) 16.26 (1.61) 0.15**
Skinfold thickness (cm) 11.15 (2.82) 10.89 (2.96) 11.40 (2.65) 0.14**
Hip circumferences (cm) 52.81 (3.42) 52.89 (3.60) 52.73 (3.25) 0.15**
Z scores of weight change from birth to 3yars 1.30 (2.04) 1.20 (1.75) 1.39 (2.29) 0.10
Catch up growth 83 (34.87%) 46 (38.98%) 37 (30.83%)
Serological measures
Homocysteine (μmol/L) 4.73 (1.01) 4.78 (1.02) 4.68 (1.02)
Folate (ng/mL) 9.08 (1.03) 8.68 (1.05) 9.50 (1.04) -0.32*
*P< 0.0001, **P< 0.05, ***P< 0.10
aP< 0.05 in sex difference
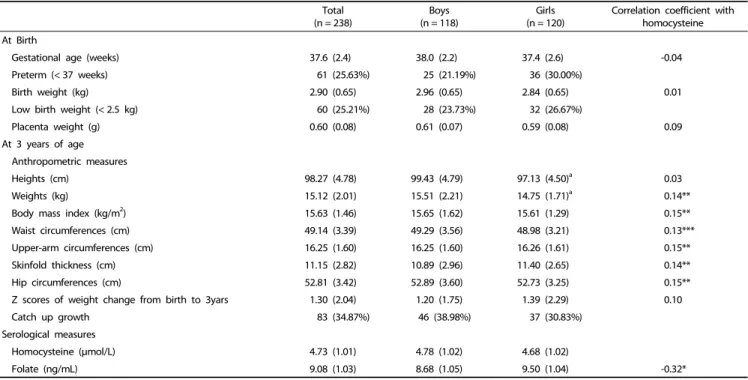
Continuous values are expressed as mean and standard deviation and discontinuous values are presented as n with percent (%).
Catch-up growth was defined as greater than 0.67 (equal to 75th percentile) at current weight z score if born preterm or of low birth weight and others with a change of weight z score more than 0.67, it calculated by subtracting the birth weight z score form the current weight (3 years old) z score.
Table 1. Basic characteristics at birth and at 3 years of age of study subjects (n = 238)
based on a two-tail test.
RESULTS
Basic characteristics of the study population
The overall mean homocysteine and folate level in the study population were 4.85 μmol/L and 9.90 ng/mL (geometric homocysteine mean: 4.73 μmol/L, geometric folate mean: 9.08 ng/mL; each ranged from 2.72 to 11.10 mmol/L and from 1.8 to 38.5 ng/mL) respectively. The levels were similar among boys and girls. The characteristics of study participants are shown in Table 1. About a quarter of subjects was low birth weight and preterm. All anthropometric data were within the normal range for 3 year olds in Korea. We subdivided the group into boys and girls but no difference was found between the genders except for heights and weights. Current weight, BMI, upper arm circumferences, skinfold thickness, and hip circum- ference were positively correlated with homocysteine level with a statistical significance (P < 0.05). On the other hand, current folate level was negatively correlated with homocysteine level (P < 0.001). Gestational age, birth weight, placental weight, and z scores of weight change from birth to three years of age were not correlated with homocysteine.
Analysis of factors related to homocysteine by a generalized linear model
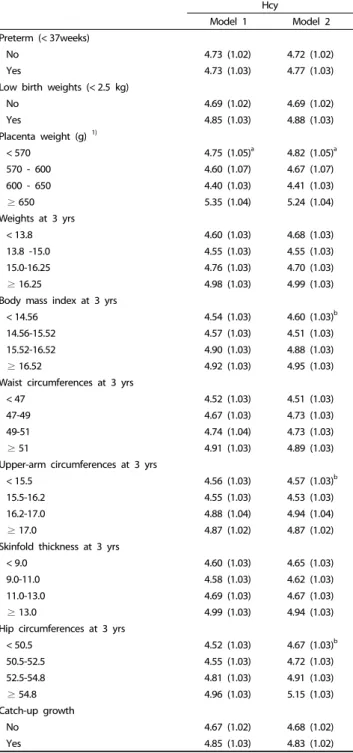
Using a generalized linear model adjusted for sex, age in months, and blood folate level, the adjusted homocysteine levels at 3 years of age by quartile of adiposity measures and
placenta weight including birth outcomes and catch-up growth are presented in Table 2. Placental weight was associated with homocysteine levels at 3 years with a U shape. Those who belong to the highest quartile in weight, BMI, waist circum- ferences, skinfold thickness, and hip circumferences at 3 years of age showed the highest mean of homocysteine, but it was only a significant for group differences in placenta weight under controlling with sex and age. When adding folate level into consideration (model 2), it showed borderline significant in BMI, upper arm circumferences, and hip circumferences. On the contrary, the birth outcomes and postnatal growth in early life were not associated with homocysteine.
Combined effect of folate and adiposity on homocysteine
Table 3 summarizes the combined effect of blood folate and
adiposity measure including birth outcomes and postnatal
growth on homocysteine. Compared with those in the low risk
group with low adiposity and high blood folate, children with
high risk corresponding with weight, BMI, waist circumferences,
skinfold thickness, and hip circumferences showed significantly
high homocysteine levels. In addition, those who belong to low
adiposity and low blood folate also showed higher homocys-
teine levels compared with in low risk group. In case of high
adiposity and high blood folate, children with high upper arm
circumferences and high folate level have higher homocysteine
level compared with in low risk group. For birth features, those
who belong to high placenta weight with low blood folate had
high homocysteine levels compared with low placenta weight
with high folate level. Low birth weight, and preterm, with low
Hcy
Model 1 Model 2
Preterm (< 37weeks)
No 4.73 (1.02) 4.72 (1.02)
Yes 4.73 (1.03) 4.77 (1.03)
Low birth weights (< 2.5 kg)
No 4.69 (1.02) 4.69 (1.02)
Yes 4.85 (1.03) 4.88 (1.03)
Placenta weight (g) 1)
< 570 4.75 (1.05)a 4.82 (1.05)a
570 - 600 4.60 (1.07) 4.67 (1.07)
600 - 650 4.40 (1.03) 4.41 (1.03)
≥ 650 5.35 (1.04) 5.24 (1.04)
Weights at 3 yrs
< 13.8 4.60 (1.03) 4.68 (1.03)
13.8 -15.0 4.55 (1.03) 4.55 (1.03)
15.0-16.25 4.76 (1.03) 4.70 (1.03)
≥ 16.25 4.98 (1.03) 4.99 (1.03)
Body mass index at 3 yrs
< 14.56 4.54 (1.03) 4.60 (1.03)b
14.56-15.52 4.57 (1.03) 4.51 (1.03)
15.52-16.52 4.90 (1.03) 4.88 (1.03)
≥ 16.52 4.92 (1.03) 4.95 (1.03)
Waist circumferences at 3 yrs
< 47 4.52 (1.03) 4.51 (1.03)
47-49 4.67 (1.03) 4.73 (1.03)
49-51 4.74 (1.04) 4.73 (1.03)
≥ 51 4.91 (1.03) 4.89 (1.03)
Upper-arm circumferences at 3 yrs
< 15.5 4.56 (1.03) 4.57 (1.03)b
15.5-16.2 4.55 (1.03) 4.53 (1.03)
16.2-17.0 4.88 (1.04) 4.94 (1.04)
≥ 17.0 4.87 (1.02) 4.87 (1.02)
Skinfold thickness at 3 yrs
< 9.0 4.60 (1.03) 4.65 (1.03)
9.0-11.0 4.58 (1.03) 4.62 (1.03)
11.0-13.0 4.69 (1.03) 4.67 (1.03)
≥ 13.0 4.99 (1.03) 4.94 (1.03)
Hip circumferences at 3 yrs
< 50.5 4.52 (1.03) 4.67 (1.03)b
50.5-52.5 4.55 (1.03) 4.72 (1.03)
52.5-54.8 4.81 (1.03) 4.91 (1.03)
≥ 54.8 4.96 (1.03) 5.15 (1.03)
Catch-up growth
No 4.67 (1.02) 4.68 (1.02)
Yes 4.85 (1.03) 4.83 (1.02)
aP< 0.05; bP< 0.10
Results represented as least squares means with standard error and P value for mean differences by groups obtained from generalized linear model.
All anthropometric indicators and placenta weight were classified into the quartile groups.
Model 1: adjusted for sex, life month Model 2: adjusted for sex, life month, and blood folate level
1)Sample size differ due to missing data (n = 119; Q1 = 30, Q2 = 11, Q3 = 47, Q4
= 31).
Catch-up growth was defined as greater than 0.67 (equal to 75th percentile) at current weight z score if born preterm or of low birth weight and others with a change of weight z score more than 0.67, it calculated by subtracting the birth weight z score form the current weight (3 years old) z score.
Table 2. The relations between the birth outcomes and anthropometric measures and homocysteine levels at 3 years of age using a generalized linear model
Folate
< 25th percentile ≥ 25th percentile P combined Low birth weight
No 5.12 (1.03)b 4.57 (1.02) < 0.001
Yes 5.69 (1.06)a 4.65 (1.03)
Preterm
No 5.22 (1.03)a 4.59 (1.02) < 0.01
Yes 5.31 (1.07) 4.59 (1.03)
Placenta weight (g)1)
< 75th percentile 5.16 (1.05)b 4.40 (1.03) < 0.0001
≥ 75th percentile 5.95 (1.07)a 5.06 (1.05) Weights at 3 years
< 75th percentile 5.11 (1.03)b 4.52 (1.02) < 0.001
≥ 75th percentile 5.67 (1.06)a 4.80 (1.03) Body mass index at 3 years
< 75th percentile 5.18 (1.03)a 4.52 (1.02) < 0.001
≥ 75th percentile 5.43 (1.06)b 4.79 (1.03) Waist circumferences at 3 years
< 75th percentile 5.11 (1.04)b 4.51 (1.02) 0.001
≥ 75th percentile 5.40 (1.05)a 4.78 (1.03) Upper-arm circumferences at 3 years
< 75th percentile 5.33 (1.04)a 4.45 (1.02) 0.0001
≥ 75th percentile 4.98 (1.05) 4.85 (1.03)b Skinfold thickness at 3 years
< 75th percentile 5.07 (1.04) 4.52 (1.02) < 0.001
≥ 75th percentile 5.40 (1.05)a 4.83 (1.03) Hip circumferences at 3 years
< 75th percentile 5.11 (1.03)a 4.50 (1.02) < 0.001
≥ 75th percentile 5.53 (1.06)b 4.83 (1.03) Catch-up
No 5.28 (1.04)a 4.52 (1.02) < 0.001
Yes 5.18 (1.05) 4.74 (1.03)
Results represented as least squares means and standard error after adjusting for sex and life months. For multiple comparison test, Bonferroni method was used.
1)Sample size differ due to missing data (n = 119; < 75th percentile n = 88 and ≥ 75th percentile n = 31).
aP value < 0.01 when compared with low risk group (folate ≥ 25th with anthropometric measure < 75th)
bP value < 0.05 when compared with low risk group
Catch-up growth was defined as greater than 0.67 (equal to 75th percentile) at current weight z score if born preterm or of low birth weight and others with a change of weight z score more than 0.67, it calculated by subtracting the birth weight z score form the current weight (3 years old) z score.
Table 3. The combined effect between the birth outcomes and anthropometric measures and blood folate level on homocysteine levels at 3 years of age using generalized linear model
folate level also showed higher level of homocysteine than normal birth outcomes with high folate level, although it was only significant in low birth weight children.
DISCUSSION
As part of the ongoing birth cohort study, this study found that homocysteine correlated with several adiposity indicators and those who have simultaneous risk of adiposity and poor folate level demonstrated elevated homocysteine level at 3 years of age.
These results are obtained from younger children than
previous studies except for one study conducted in Spain for subjects aged 2 months to 18 years old [16] . Although the association between homocysteine in the general population as a childhood antecedent of CVD is unclear, several studies reported that homocysteine in children was associated with parental CVD risk [19]. In addition, the Homocysteine Studies Collaboration analyzed results of 12 prospective and 18 retros- pective studies covering 16,786 healthy adults and demons- trated a 25% increase in the serum homocysteine is associated with a 12% higher risk of ischemic heart in the retrospective studies and a 20% increase in the prospective studies [20]. In another meta-analysis on homocysteine and cardiovascular risk by Humphrey et al. [21] concluded that high homocysteine levels may be independently and moderately increased by about 20% for the risks for developing cardiovascular diseases.
Barker et al. [22] published that intrauterine malnutrition might program cardiovascular health several decades after the original insult. This has been supported by epidemiological studies demonstrating that low birth weight infants had impaired glucose tolerance, type 2 diabetes, and high blood pressure. These subjects had endothelial dysfunction and increased arterial stiffness even by the end of the first decade of life [23]. In this study, the homocysteine levels were higher in low birth weight than in normal birth weight. Although those who in the highest quartile of placenta weight showed the highest values of the homocysteine levels, those in the lowest quartile of placenta weight also showed an increasing tendency.
In addition, when simultaneously considered with poor folate level, mean difference of homocysteine has become clear. To our knowledge, there was no information for association between placenta weight and offspring’s homocysteine level.
Alternatively, study from population based Netherlands cohort study showed that higher homocysteine level in early pregnancy was related with low placenta weight [24]. Several other studies reported that maternal obesity, higher gestational weight gain, and gestational diabetes were associated with larger placenta weight [25]. Although it was suggested that influences of the placenta may be linked with development of cardiovascular diseases in offspring, mechanisms underlying the placenta origin and disease development remain unclear [26].
Of above mentioned factors influencing placental weight, maternal obesity and gestational weight gain, gestational diabetes were associated with development of offspring obesity. In the present study, weight, BMI, waist, upper-arm circumference, skinfold thickness and hip circumference at 3 year of age were positively correlated with the homocysteine levels. In addition, the highest quartile in BMI and hip circumferences showed high level homocysteine even adjusted for blood folate levels, although the high level of homocysteine was of borderline significant.
When simultaneously controlling with preterm or low birth weight, the trend of the association was similar to the presented results of model 2 in Table 2 (data not shown). An effects of adiposity quartile groups on current homocysteine levels in BMI, upper arm circumferences and hip circumference still showed a borderline significance level, while birth outcomes were not significant. These findings suggest that those who were vulnerable to development of obesity have the risk of increased
homocysteine levels. Children who have a greater risk for obesity as defined by various anthropometric measurements along with poor folate level showed significantly high homocys- teine levels. Some studies [13,27] reported the positive association between homocysteine and adiposity but not others [12,16].
Generally, homocysteine level is determined by genetic, dietary [28] or secondary diseases. Although C677T mutation for MTHFR enzyme is well known that it greatly contributes to current homocysteine level [28], variation by genetic polymor- phisms is random due to the law of independent assortment of gene. Thus, it didn’t seem to have great influence on these results.
Homocysteine is a modifiable factor [14] and it is controlled by folate level [29]. However, folate is involved in homocysteine metabolism and the potential role in lowering homocysteine is still much debated. Homocysteine in children is inversely related to serum folate levels [11]. If dietary changes could decrease the elevated homocysteine, an independent risk factor for cardiovascular disease, and decrease the rate of CVD as well, it would be of great interest as a preventive measure [8]. One study by Wald et al. suggested that a 3 μmol/l decrease in serum homocysteine achievable with 0.8mg/day folic acid lowers the risk of myocardial infarction by 15% and stroke by 24% after adjustment for other confounding risk factors [30]. However, some reports indicate that folate does not lower the risk of recurrent CVD or reduce the risk of major cardiovascular events in preexisting vascular diseases [31]. Nonetheless, children at young age are relatively free from preexisting vascular diseases and thus may be the potential candidate for such intervention.
Taken together the evidence supports a modest protective effect of folic acid supplementation to lower the homocysteine levels [30] especially in the high risk subjects starting at an early age.
This study carries a few limitations. The sample size is small,
a possibility of selection bias exists due to follow up loss, and
it was not allowed for generalization of results since the birth
cohort is based in the tertiary hospital. Being a follow up study
always carries a risk of selection bias and a further study will
address these shortcomings. Our study subjects are composed
higher proportion of preterm (25.6%) and low birth weight
(25.2%) than national statistics. Thus, characteristics of study
subjects need to be considered when interpreting results from
our study. However, as this was a prospective cohort study, the
data are subject to less recall bias of old measurements, and
may thus elucidate a true cause-and-effect association. Despite
the paucity of information about possibility of correlation of
homocysteine levels between childhood and adulthood, it is
necessary to track homocysteine levels from childhood to
prevent further CVD risks [32]. Therefore, further study of tracking
homocysteine and the change of homocysteine resulting from
the change of folate level is needed to suggest the strategy
of intervention. Although this study did not cover dietary
factors, blood folate level was considered as a biomarker. Some
studies reported that the correlation between homocysteine
and folate was stronger than vitamin B12 [27,33]. In addition,
because study subjects are still young, the variation by diet was
relatively lower than older children or adults. Finally, this study
was conducted in general children and study subjects are young and therefore we alternatively defined as low and high level based on value of 75
thpercentile as adiposity status and 25
thpercentile as poor folate status. This approach followed a previous study [34]. In addition, it was similar with the 2007 Korean Children and Adolescents Growth Standards and growth chart recommended by WHO [18], respectively.
In summary, our data showed that homocysteine is positively associated with adiposity indicators and negatively associated with folate. In addition, combined effect of adiposity and poor folate level influences the vulnerability to CVD as demonstrated by a significant association with increased homocysteine at three years of age early in life. Therefore folate supplementation with weight control to the children with greater body mass in early childhood is speculated to decrease the homocysteine levels and modify the risk status of CVD.
REFERENCES
1. Ross R. The pathogenesis of atherosclerosis: a perspective for the 1990s. Nature 1993;362:801-9.
2. Burke V. Obesity in childhood and cardiovascular risk. Clin Exp Pharmacol Physiol 2006;33:831-7.
3. Berenson GS, Wattigney WA, Tracy RE, Newman WP 3rd, Srinivasan SR, Webber LS, Dalferes ER Jr, Strong JP. Atherosclerosis of the aorta and coronary arteries and cardiovascular risk factors in persons aged 6 to 30 years and studied at necropsy (The Bogalusa Heart Study). Am J Cardiol 1992;70:851-8.
4. Barker DJ, Osmond C, Forsén TJ, Kajantie E, Eriksson JG. Trajectories of growth among children who have coronary events as adults.
N Engl J Med 2005;353:1802-9.
5. Huxley RR, Shiell AW, Law CM. The role of size at birth and postnatal catch-up growth in determining systolic blood pressure: a systematic review of the literature. J Hypertens 2000;18:815-31.
6. American Academy of Pediatrics. Cardiovascular risk reduction in high-risk pediatric populations. Pediatrics 2007;119:618-21.
7. Finkelstein JD. Methionine metabolism in mammals. J Nutr Biochem 1990;1:228-37.
8. Groner JA, Joshi M, Bauer JA. Pediatric precursors of adult cardiovascular disease: noninvasive assessment of early vascular changes in children and adolescents. Pediatrics 2006;118:1683-91.
9. Jakubowski H. Pathophysiological consequences of homocysteine excess. J Nutr 2006;136:1741S-1749S.
10. Haim M, Tanne D, Goldbourt U, Doolman R, Boyko V, Brunner D, Sela BA, Behar S. Serum homocysteine and long-term risk of myocardial infarction and sudden death in patients with coronary heart disease. Cardiology 2007;107:52-6.
11. Tonstad S, Refsum H, Sivertsen M, Christophersen B, Ose L, Ueland PM. Relation of total homocysteine and lipid levels in children to premature cardiovascular death in male relatives. Pediatr Res 1996;40:47-52.
12. Vilaseca MA, Moyano D, Ferrer I, Artuch R. Total homocysteine in pediatric patients. Clin Chem 1997;43:690-2.
13. Shen MH, Chu NF, Wu DM, Chang JB. Plasma homocyst(e)ine, folate and vitamin B(12) levels among school children in Taiwan: The Taipei Children Heart Study. Clin Biochem 2002;35:495-8.
14. Leal AA, Palmeira AC, Castro GM, Simões MO, Ramos AT, Medeiros CC. Homocysteine: cardiovascular risk factor in children and
adolescents? Rev Assoc Med Bras 2013;59:622-8.
15. Min JW, Kong KA, Park BH, Hong JH, Park EA, Cho SJ, Ha EH, Park H. Effect of postnatal catch-up growth on blood pressure in children at 3 years of age. J Hum Hypertens 2007;21:868-74.
16. Korea Center for Disease Control and Prevention; Korean Pediatric Society. 2007 Korean Children and Adolescents Growth Standard;
2008 [cited 2013 July 10]. Available from: http://www.cdc.go.kr/
CDC/notice/CdcKrInfo0301.jsp?menuIds=HOME001-MNU0004-MNU 0036-MNU0037&cid=12103.
17. Araki A, Sako Y. Determination of free and total homocysteine in human plasma by high-performance liquid chromatography with fluorescence detection. J Chromatogr B Biomed Sci Appl 1987;422:
43-52.
18. World Health Organization (CH). Serum and Red Blood Cell Folate Concentrations for Assessing Folate Status in Populations. Vitamin and Mineral Nutrition Information System. Geneva: World Health Organization; 2012.
19. Fukagawa NK, Martin JM, Wurthmann A, Prue AH, Ebenstein D, O'Rourke B. Sex-related differences in methionine metabolism and plasma homocysteine concentrations. Am J Clin Nutr 2000;72:22-9.
20. Klerk M, Verhoef P, Clarke R, Blom HJ, Kok FJ, Schouten EG, Group MS; MTHFR Studies Collaboration Group. MTHFR 677C-->T polymor- phism and risk of coronary heart disease: a meta-analysis. JAMA 2002;288:2023-31.
21. Humphrey LL, Fu R, Rogers K, Freeman M, Helfand M. Homocysteine level and coronary heart disease incidence: a systematic review and meta-analysis. Mayo Clin Proc 2008;83:1203-12.
22. Barker DJ, Gluckman PD, Godfrey KM, Harding JE, Owens JA, Robinson JS. Fetal nutrition and cardiovascular disease in adult life. Lancet 1993;341:938-41.
23. Leeson CP, Whincup PH, Cook DG, Donald AE, Papacosta O, Lucas A, Deanfield JE. Flow-mediated dilation in 9- to 11-year-old children:
the influence of intrauterine and childhood factors. Circulation 1997;96:2233-8.
24. Bergen NE, Jaddoe VW, Timmermans S, Hofman A, Lindemans J, Russcher H, Raat H, Steegers-Theunissen RP, Steegers EA. Homocy- steine and folate concentrations in early pregnancy and the risk of adverse pregnancy outcomes: the Generation R Study. BJOG 2012;119:739-51.
25. Ouyang F, Parker M, Cerda S, Pearson C, Fu L, Gillman MW, Zuckerman B, Wang X. Placental weight mediates the effects of prenatal factors on fetal growth: the extent differs by preterm status. Obesity (Silver Spring) 2013;21:609-20.
26. Thornburg KL, O’Tierney PF, Louey S. Review: the placenta is a programming agent for cardiovascular disease. Placenta 2010;31 Suppl:S54-9.
27. Papandreou D, Mavromichalis I, Makedou A, Rousso I, Arvanitidou M. Total serum homocysteine, folate and vitamin B12 in a Greek school age population. Clin Nutr 2006;25:797-802.
28. Wald DS, Law M, Morris JK. Homocysteine and cardiovascular disease:
evidence on causality from a meta-analysis. BMJ 2002;325:1202-6.
29. Osganian SK, Stampfer MJ, Spiegelman D, Rimm E, Cutler JA, Feldman HA, Montgomery DH, Webber LS, Lytle LA, Bausserman L, Nader PR. Distribution of and factors associated with serum homocysteine levels in children: Child and Adolescent Trial for Cardiovascular Health. JAMA 1999;281:1189-96.
30. Wald DS, Wald NJ, Morris JK, Law M. Folic acid, homocysteine, and cardiovascular disease: judging causality in the face of inconclusive
trial evidence. BMJ 2006;333:1114-7.
31. Lonn E, Yusuf S, Arnold MJ, Sheridan P, Pogue J, Micks M, McQueen MJ, Probstfield J, Fodor G, Held C, Genest J Jr; Heart Outcomes Prevention Evaluation (HOPE) 2 Investigators. Homocysteine lowering with folic acid and B vitamins in vascular disease. N Engl J Med 2006;354:1567-77.
32. Berdanier CD, Feldman EB, Dwyer J. Ch10. Potential benefits for the use of vitamin and mineral supplements. In: Cotter R, Moreines J, Ellenbogen L, editors. Handbook of Nutrition and Food, Second
Edition. Boca Raton (FL): CRC Press; 2007. p.200.
33. Delvin EE, Rozen R, Merouani A, Genest J Jr, Lambert M. Influence of methylenetetrahydrofolate reductase genotype, age, vitamin B-12, and folate status on plasma homocysteine in children. Am J Clin Nutr 2000;72:1469-73.
34. Hong J, Lee HA, Park EA, Kim YJ, Lee H, Park BH, Ha EH, Kong KA, Chang N, Park H. Association of mid-pregnancy antioxidative vitamin and oxidative stress levels with infant growth during the first 3 years of life. Food Nutr Res 2014;58:20207.