http://e-nrp.org
Anti-diabetic effect of purple corn extract on C57BL/KsJ db/db mice
Bo Huang
1, Zhiqiang Wang
3, Jong Hyuk Park
2, Ok Hyun Ryu
4, Moon Ki Choi
4, Jae-Yong Lee
2,5, Young-Hee Kang
3and Soon Sung Lim
2,3§1College of Food Science and Engineering, Liaoning Medical University, Jinzhou 121000, China
2Institute of Natural Medicine, Hallym University Medical School, Gangwon 200-702, Korea
3Department of Food Science and Nutrition and Center for Aging and HealthCare, Hallym University, 1 Hallymdaehak-gil, Chuncheon, Gangwon 200-702, Korea
4Division of Endocrinology and Metabolism, Department of Internal Medicine, Hallym University, Gangwon 200-702, Korea
5Department of Biochemistry, School of Medicine, Hallym University, Gangwon 200-702, Korea
BACKGROUND/OBJECTIVES: Recently, anthocyanins have been reported to have various biological activities. Furthermore, anthocyanin-rich purple corn extract (PCE) ameliorated insulin resistance and reduced diabetes-associated mesanginal fibrosis and inflammation, suggesting that it may have benefits for the prevention of diabetes and diabetes complications. In this study, we determined the anthocyanins and non-anthocyanin component of PCE by HPLC-ESI-MS and investigated its anti-diabetic activity and mechanisms using C57BL/KsJ db/db mice.
MATERIALS/METHODS: The db/db mice were divided into four groups: diabetic control group (DC), 10 or 50 mg/kg PCE (PCE 10 or PCE 50), or 10 mg/kg pinitol (pinitol 10) and treated with drugs once per day for 8 weeks. During the experiment, body weight and blood glucose levels were measured every week. At the end of treatment, we measured several diabetic parameters.
RESULTS: Compared to the DC group, Fasting blood glucose levels were 68% lower in PCE 50 group and 51% lower in the pinitol 10 group. Furthermore, the PCE 50 group showed 2- fold increased C-peptide and adiponectin levels and 20% decreased HbA1c levels, than in the DC group. In pancreatic islets morphology, the PCE- or pinitol- treated mice showed significant prevention of pancreatic β-cell damage and higher insulin content. Microarray analyses results indicating that gene and protein expressions associated with glycolysis and fatty acid metabolism in liver and fat tissues. In addition, purple corn extract increased the phosphorylation of AMP-activated protein kinase (AMPK) and decreased phosphoenolpyruvate carboxykinase (PEPCK), glucose 6-phosphatase (G6pase) genes in liver, and also increased glucose transporter 4 (GLUT4) expressions in skeletal muscle.
CONCLUSIONS: Our results suggested that PCE exerted anti-diabetic effects through protection of pancreatic β-cells, increase of insulin secretion and AMPK activation in the liver of C57BL/KsJ db/db mice.
Nutrition Research and Practice 2015;9(1):22-29; doi:10.4162/nrp.2015.9.1.22; pISSN 1976-1457 eISSN 2005-6168
Keywords: Purple corn, diabetes, insulin, microarray assay, AMPK
INTRODUCTION
4)Diabetes mellitus is a chronic metabolic disease that now affects 3% of the world’s population. The disease is charac- terized by chronic hyperglycemia, disorders of carbohydrate and lipid metabolism, and microvascular pathology in the retina, renal glomeruli and peripheral nerves [1].
Recently, here has been a growing interest in hypoglycemic agents from natural products, especially those derived from plants, because compared to synthetic sources, plant sources are usually considered to be less toxic, and to have fewer side effects [2]. Many traditional remedies for diabetes mellitus involve the use of plant sources, and over 200 pure phyto-
chemicals are currently known to have hypoglycemic properties.
However, most of them have been shown to exert little or no effect on glycemic control in experimental studies [3]. Purple corn (Zea mays L.), is rich in anthocyanins and bioactive phenolics.
It has been cultivated and used for centuries to prepare drinks and desserts in South America, mainly in Peru and Bolivia [4].
The anthocyanins present in the flowers, leaves, cobs, and seeds of Andean purple corn have previously been characterized, and the major anthocyanins identified were cyanidin-3-dimalonyl- glucoside, cyandin-3-glucoside, pelargonidin-3-glucoside, peonidin- 3-glucoside, and their respective malonated counterparts [5].
Recently, anthocyanins have been reported to have various biological activities, such as antioxidant, anti-inflammatory,
This work was supported by the grant from the Ministry for Food, Agriculture, Forestry and Fisheries through Korea Institute of Planning and Evaluation for technology of Food, Agriculture, Forestry and Fisheries (No. 109163-3) and the Inter-ER Cooperation Projects funded by the Ministry of Knowledge Economy (MKE) and Korea Institute for Advancement of Technology (KIAT) and Priority Research Centers Program and Hallym University Specialization Fund (HRF-S-12) and Basic Science Research Program through the National Research Foundation of Korea (NRF) funded by the Ministry of Education (NRF- 2012R1A1A2008842)
§Corresponding Author: Soon Sung Lim, Tel. 82-33-248-2133, Fax. 82-33-251-0663, Email. [email protected] Received: December 27, 2013, Revised: September 30, 2014, Accepted: October 8, 2014
This is an Open Access article distributed under the terms of the Creative Commons Attribution Non-Commercial License (http://creativecommons.org/licenses/by-nc/3.0/) which permits unrestricted non-commercial use, distribution, and reproduction in any medium, provided the original work is properly cited.
anti-mutagenic, and anticancer activities [6-9]. Furthermore, anthocyanin- rich purple corn extract (PCE) ameliorated insulin resistance and reduced diabetes-associated mesanginal fibrosis and inflammation, suggesting that it may have benefits for the prevention of diabetes and diabetes complications [10,11].
In this study, we determined the anthocyanins and non- anthocyanin component of PCE by high-performance liquid chromatography electrospray tandem mass spectrometry (HPLC- ESI-MS) and investigated its anti-diabetic activity and mecha- nisms using C57BL/KsJ db/db mice, a type 2 diabetes animal model.
MATERIALS AND METHODS Materials
Purple corn kernels were provided by the Corn Research Institute in Gangwon Province, Korea. The voucher specimen (No. RIC-2329) was deposited and maintained at the center for efficacy assessment and development of functional foods and drugs (Regional Innovation Center), Hallym University, Chuncheon, Korea. Dried purple corn kernels (5 kg) were ground and mixed with 30 L of 30% ethanol-water solution in a glass chamber, which was used to perform the extraction at room temperature for 20 h. The extracts were combined and concentrated under reduced pressure by using a Model EYELA N-1000 rotary evaporator (Tokyo Rikakikai, Tokyo, Japan) and freeze-dried (yield: 410 g, 8.2%). The dried extract was stored at -20°C until used for the following experiments.
Animals
Six-week old C57BL/KsJ db/db mice were purchased from Central Lab Animal (SLC, Japan). All animals were acclimatized to the laboratory environment for 1 week before the experi- ment. Mice were allowed free access to drinking water and food under constant room temperature (22 ± 2°C) and humidity (50%
± 10%) under an automatic 12 h light/12 h dark cycle. The mice were cared for and treated in accordance with the guidelines of the Committee on Care and Use of Laboratory Animal Resources, National Research Council, USA. The mice were randomly divided into 4 groups: diabetic control (DC), PCE 10 mg/kg (PCE 10), PCE 50 mg/kg (PCE 50), pinitol 10 mg/kg (Pinitol 10). Each group was treated with drugs by oral administration once per day for 8 weeks. During the experiment, body weights and blood glucose levels of the mice were measured once every week. All animal experiment procedures conducted in accor- dance with guidelines and approval of the Institutional Animal Care and Use Committees (IACUC) of Hallym University (Hallym- 2012-37).
High performance liquid chromatography-mass spectrometry Separation of anthocyanins and non-anthocyanins was cond- ucted on a reverse-phase Capcell Pak C18 UG 120 S5 column (4.6×150 mm I.D., 4 μm; Shiseido Co., Ltd, Tokyo, Japan) using a Finnigan Surveyor high-performance liquid chromatography (HPLC) system (Thermo Quest, San Jose, CA, USA) at an ambient temperature. The mobile phase was a binary elution of 5%
formic acid solution (A) and 100% methanol (B) under the following gradient conditions: initial, 20% B; 7 min, 20% B; 15
min, 25% B; 32 min, 50% B; 36 min, 100% B; 38 min, 100%
B; 40 min, 20% B and 45 min, 20% B. The flow rate was 700 μl/min, and the injection volume was 10 μl. Eluted substances were detected at 280 nm and 570 nm by using a photodiode- array detector between 200 and 600 nm with a bandwidth of 1 nm. For the identification of major components, the column elute was split, and 0.2 ml·min
-1was directed to a Finnigan LCQ Advantage ion-trap MS (Thermo Quest, San Jose, CA, USA) equi- pped with an electrospray ionization (ESI) interface after passing through the flow cell of the photodiode-array detector. Analysis was carried out using positive ion monitoring at a capillary temperature of 280°C, spray voltage of 5.5 kV, capillary voltage of 10 V and tube lens offset of -5.0 V. Spectral data were recorded using He gas as a collision gas. Anthocyanins and non-anthocyanins were detected using m/z value following MS/MS. The MS/MS collision energy was set to 35%. Data were collected using dual analysis in fullscan mode from 100 to 1000 atomic mass units and MS/MS modes. Data were processed using the Xcalibur 2.0 version software program (Thermo Electron Corporation, San Jose, CA, USA).
Oral glucose tolerance test
The mice were fasted for 12 h prior to the experiment, and PCE was administered orally 30 min prior to the glucose challenge. Glucose (1.5 g/kg) was orally administered at 0 min, and blood was withdrawn from the orbital venous plexus at 0 min, 30 min, 60 min, 90 min and 120 min after glucose administration. Blood glucose levels were determined by the glucose oxidase method [12].
Blood biomarker
Blood samples were drawn from an antecubital vein. Serum was separated immediately by centrifugation (2000 × g at 4°C for 3 min) and stored at -70°C. Serum concentrations of trigly- cerides (TG), total cholesterol and high-density lipoprotein (HDL) were analyzed using commercial kits (971769, 981771 and 971656, respectively, Thermo Electron Corporation, Vantaa, Finland) and Thermo Fisher Konelab 20XTi Analyzer (Thermo Electron Corporation, SeoKwang LABOTECH, Seoul, Korea).
Blood glycated hemoglobin (HbA1c) was measured on an HbA1c Analyzer (HLCr-723GHb G7; Tosoh, Aarhus V, Denmark).
Serum insulin, adiponectin, C-peptide, and glucagon concen- trations were determined using a mouse insulin ELISA kit, C-peptide ELISA kit, and Glucagon ELISA kit, respectively (all from Shibayagi Co.,Ltd., Shibukawa, Japan).
Western blot analysis
After sacrificing the mice, adipose tissues were immediately
removed, instantly placed in liquid nitrogen, and subsequently
stored at -70°C. Protein extracts were prepared using a protein
extraction kit (Intron Biotechnology Inc., Seoul, Korea). Lysates
(30 μg) were electroblotted onto a nitrocellulose membrane
following separation using 10% SDS-polyacrylamide gel electro-
phoresis. Blotted membranes were incubated for 1 h with
blocking solution (tris-buffered saline with Tween 20. [TBST])
containing 5% skim milk (w/v) at room temperature, followed
by incubation overnight at 4°C with 1 : 1000 dilution of AMP
activated protein kinase (AMPK), phosphor-AMP-activated protein
Peak Rt
(min) UV/Vis
λMax
(nm)
LC-ESI-MS
Compoundsa [M]+
(m/z) Fragments (m/z)
1 4.03 259, 274 154 protocatechuic acid
2 7.56 260, 292 168 vanillic acid
3 10.53 242, 293 170 2,4,6-tribenzoic acid 4 13.07 243, 309 164 p-hydroxycinnamic acid
5 12.36 251, 326 194 ferulic acid
6 13.07 256, 353 464 303 hirsutrin 7 15.19 254, 353 478 317 3'-methoxyhirsutrin 8 5.38 515, 279 449 287 cyanidin 3-glucoside 9 7.38 504, 278 433 271 pelargonidin 3-glucoside 10 8.22 515, 279 463 301 peonidin 3-glucoside
11 9.66 517, 280 535 449, 287 cyanidin 3-(6"-malonyl-glucoside) 12 11.29 517, 279 549 301 peonidin 3-(6"-malonyl-glucoside)
aCompounds 1-12 were identified based on photodiode-array absorbance and mass fragmentation pattern. Rt, retention time; UV/Vis, ultraviolet-visible spectroscopy;
LC-ESI-MS, liquid chromatography-electrospray ionization-mass spectrometry.
Table 1. Identification of the major components detected of PCE (A)
(B)
Fig. 1. HPLC chromatography of major components of PCE. Non-anthocyanins (A) and anthocyanins (B) were detected at 280 nm and 570 nm, respectively.
kinase (p-AMPK), acetyl-coA carboxylase (ACC), phosphor-acetyl- coA carboxylase (p-ACC) primary antibody (Cellsignaling, Danvers, MA, USA). Membranes were washed 4 times with 0.1% TBST and incubated with 1 : 3000 dilution of horseradish peroxidase- conjugated goat anti-rabbit or donkey anti-rabbit IgG secondary antibody for 1 h at room temperature. Membranes were washed four times in TBST and then developed by WEST-ZOL
®PLUS (Intron Biotechnology Inc., Seoul, Korea).
RNA isolation and reverse transcription-polymerase chain reaction (RT-PCR)
Total mRNA was isolated from db/db mice liver using an Easy-Blue kit (Intron Biotechnology Inc, Seoul, Korea) according to the manufacture’s instructions. From each sample, total RNA (10 μg) was reverse transcribed into cDNA using the Moloney murine leukemia virus transcriptase and Oligo (dT) 15 primers (Promega, Medison, WI, USA) as primers. Sequence of primers are following: PEPCK (phosphoenolpyruvate carboxykinase) sense ATG CCT CCT CAG CTG CAT A, anti-sense TTA CAT CTG CGT GAT TCT CTG TT; G6pase (glucose 6-phosphatase) sense ACC CTG GTA GCC CTG TCT TT, anti-sense GGG CTG TGT CTT CTG TGT CG; actin sense GTC GTA CCA CTG GCA TTG TG, anti-sense GCC ATC TCC TGC TCA AAG TC; GLUT4 (glucose transpoter 4) sense CAA CGT GCC TGG GTA GGC A, anti-sense GCC ATC TCC CCC GCG CGG T; CPN (cyclophilin) sense ATG GTC AAC CCC ACC GTG, anti-sense TTA GAG TTG TCC ACA GTC GGA GA. The primers were added at a final concentration of 0.5 μM to a 25 μL reaction mixture containing 20 mM Tris-HCL (pH 8.4), 50 mM KCl, 1.5 mM MgCl
2, 0.5 mM each dNTP, 5 μL of cDNA, and 2.5 units of Taq DNA polymerase (Takara Korea Biomedical Inc., Seoul, Korea). The PCR conditions were dena- turation at 95°C for 1min, annealing at 57°C for 1 min, and extension at 72°C for 1 min. The RT-PCR products were electro- phoresed in 1% agarose gels under 100 V and stained with 0.5 μg/mL ethidium bromide.
Microarray analysis
For gene expression profiling, the synthesis of target cRNA probes and hybridization were performed using Agilent’s Low RNA Input Linear Amplification Kit (Agilent Technnology, Santa Clara, CA, USA) according to the manufacturer’s instructions.
Fluorescent-labeled cRNA target was quantified using ND-1000 spectrophotometer (NanoDrop Technologies, Inc., Wilmington, DE, USA). The hybridization images were analyzed by Agilent DNA microarray Scanner (Agilent Technology, Santa Clara, CA, USA) and the data quantification was performed using Agilent Feature Extraction software 9.3.2.1 (Agilent Technology, Santa Clara, CA, USA). The average fluorescence intensity for each spot was calculated and local background was subtracted. All data normalization and selection of fold-changed genes were performed using GeneSpringGX 7.3.1 (Agilent Technology, Santa Clara, CA, USA).
Pancreas histology and immunohistochemistry
The pancreas was removed and fixed in 10% (v/v) neutral buffered formalin, processed routinely, and embedded in paraffin wax. Paraffin sections were cut at 4 μm thickness and deparaffinized in xylene for 5 min, and rehydrated through
graded ethanol solutions. The sections were stained with hema- toxylin and eosin (H&E). For immunohistochemistry, rehydrated sections were treated with 3% (v/v) H
2O
2in methanol for 30 min to block endogenous peroxidase, washed with 0.01 mM phosphate buffer for 10 min, and then immunostained with the monoclonal mouse anti-insulin primary antibody. The antigen- antibody complex was visualized by an avidin-biotin peroxidase complex solution using an ABC kit (Vector Laboratories, Burlin- game, CA, USA) with 3, 3-diamino benzidine (Zymed Labora- tories, San Francisco, CA, USA).
Statistical analysis
Data were expressed as mean values ± SE and comparisons of data were carried out using Student’s unpaired t-test or one-way ANOVA, as appropriate. Mean values were considered significantly different when P < 0.05.
RESULTS
Identification of anthocyanins and non-anthocyanins from PCE by LC-MS
HPLC spectra at λ = 280 nm showed that 7 non-anthocyanins
DC PCE 10 PCE 50 Pinitol 10
Body weight (g) 56.4 ± 7.3 56.2 ± 4.3 60.2 ± 2.3 56.8 ± 4.6
Food intake (g/n, 8 week) 425.9 376.3 375.8 393.1
Water intake (mL/n, 8 week) 1373 927 874 736
Blood glucose (mM) 29.4 ± 1.1 14.2 ± 1.9*** 9.4 ± 1.2*** 14.3 ± 0.6***
Insulin (μU/mL) 244.5 ± 42.8 446.0 ± 27.0*** 226.5 ± 41.7 381.2 ± 44.8**
C-peptide (ng/mL) 3.5 ± 1.0 5.1 ± 1.4 6.8 ± 1.3* 6.8 ± 1.8
HbA1c (%) 9.8 ± 0.7 8.6 ± 1.0 7.8 ± 0.8* 8.0 ± 0.5
Adiponectin (ng/mL) 1739.7 ± 326.4 2765.5 ± 277.5* 2662.7 ± 415.8* 2036.2 ± 311.3
Glucagon (pg/mL) 246.3 ± 44.8 201.9 ± 33.9 148.8 ± 35.3* 185.7 ± 39.8
Plasma lipids
Triglyceride (mg/dL) 222.0 ± 29.4 116.0 ± 30.4** 105.1 ± 28.6** 131.8 ± 25.7**
Total cholesterol (mg/dL) 190.3 ± 24.8 197.3 ± 21.6 205.6 ± 33.8 171.8 ± 20.0
HDL-cholesterol (mg/dL) 70.0 ± 7.3 87.3 ± 10.3 90.8 ± 8.0* 78.2 ± 11.1
Data are mean ± SE (n = 6)
*P< 0.05, **P< 0.01, ***P< 0.001 compared to diabetic control (DC) group
Table 2. Metabolic parameters on administration of purple corn extract in db/db mice (A)
(B)
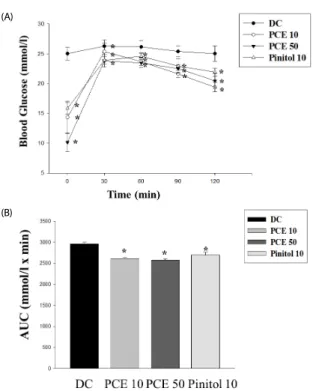
Fig. 2. Oral glucose tolerance test (A) after 12 h of food deprivation in db/db mice. (B) Area under the blood-glucose concentration curve was measured over the next 120 min (AUC-120 min). Values represent mean ± SE (n = 6). *P< 0.05 vs.
Cont.
were identified by their HPLC retention times, elution order, spectroscopic characteristics and fragmentation pattern by comparison with previously reported literature (Fig. 1A). The 7 major non-anthocyanins were identified as protocatechuic acid, vanillic acid, 2, 4, 6-tribenzoic acid, p-hydroxycinnamic acid, ferulic acid, hirsutrin, and 3' -methoxyhirsutrin. Fig. 1B shows the chromatograms of anthocyanins identified in PCE. The 5 major anthocyanins were identified as cyanidin 3-glucoside, pelargonidin 3-glucoside, peonidin 3-glucoside, cyanidin 3-(6"- malonyl-glucoside), and peonidin 3-(6"-malonyl-glucoside) by using LC-ESI-MS (Table 1). The MS/MS spectra of the antho- cyanins provided clear and characteristic fragmentation data.
The aglycones of anthocyanins were cyanidin (molecular weight [MW; 287]), peonidin (MW; 301) and pelargonidin (MW; 271).
Effect of PCE on metabolic parameters
Table 2 shows the effects of PCE (10, 50) and pinitol 10 on metabolic parameters in diabetic db/db mice treated for 8 weeks. Compared to DC group, there were no significant diffe- rences in body weight between DC and PCE (10, 50) and pinitol 10 groups. PCE (10, 50) and pinitol 10 groups showed decrease in food and water intake but not significant. Plasma glucose levels were significantly decreased by 52% (P < 0.001) in PCE 10, 68% (P < 0.001) in PCE 50 and 52% (P < 0.001) in Pinitol 10 compared to DC. The serum insulin level in the PCE 10 and Pinitol 10 treated db/db mice was significantly increased by 1.8 fold (P < 0.001), 1.5 fold (P < 0.001) as compared to the control groups, respectively.
The level of serum C-peptide increased by 1.4 and 1.9 (P <
0.05) fold in the PCE 10 and PCE 50 groups, respectively. HbA1c levels in the PCE 50 mice were decreased by 20% (P < 0.05), when compared to DC group. In the PCE 10 and PCE 50 groups, adiponectin levels were enhanced by 59% (P < 0.05) and 53%
(P < 0.05), respectively, compared with the DC group. In this experiment, glucagon levels in PCE 50 treated mice were decreased by 40% (P < 0.05) when compared to DC group, and these data revealed a similar trend in serum insulin levels. In the PCE 10, 50 and pinitol 10 groups, triglyceride (TG) levels were lowered by 48% (P < 0.01), 53% (P < 0.01) and 41% (P <
0.01) compared with the DC group, respectively. The total cholesterol (TC) level in the PCE treated groups showed no significant differences, but the HDL-cholesterol level in the PCE 50 group was significantly higher (by 28%) than those in the DC group.
Effect of PCE on oral glucose tolerance test
Oral glucose tolerance tests were performed to determine the
effect of a single oral dose of PCE on glucose tolerance using
the db/db mice (Fig. 2). Glucose challenge dramatically increased
blood glucose levels in control mice, whereas PCE-treated
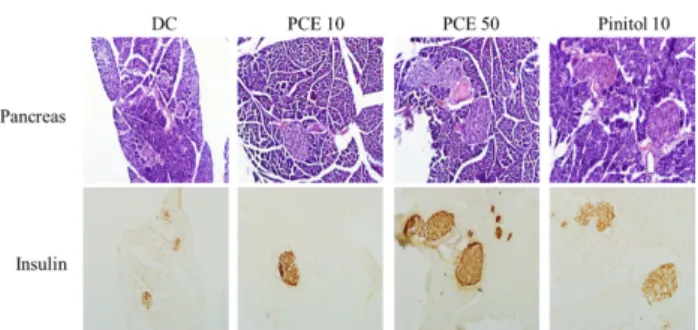
Fig. 3. Microscopic view of pancreas sections and immunostaining of insulin Control, PCE 10, PCE 50 and pinitol 10 group. H & E, magnification × 200.
(A)
(B)
Fig. 4. Effects of PCE on phosphorylations of hepatic AMPK and ACC protein (A), PEPCK, G6pase, or GLUT4 (B) mRNA levels in liver, muscle. The amount of RNA loaded in each lane was confirmed by RT-PCR of CPN or Actin mRNA.
Tissues Accession no. Gene name Fold change Function
Liver
Up-regulated
NM_010292 Glucokinase 2.78 Glycolysis
NM_011099 Pyruvate kinase, muscle 2.29 Glycolysis
Adipose
Up-regulated
NM_015729 Acyl-Coenzyme A oxidase 1, palmitoyl 2.16 Fatty acid metabolism
NM_007760 Carnitine acetyltransferase 3.95 Fatty acid metabolism
Down-regulated
NM_027976 Acyl-CoA synthetase long-chain family member 5 0.49 Fatty acid metabolism
Table 3. Differentially expressed genes in the liver and adipose tissue of PCE 50 treated db/db mice
groups had suppressed blood glucose levels 30, 60, and 90 min after glucose load (Fig. 2A). When the area under the curve (AUC) was compared between groups, the PCE 10 and PCE 50 groups showed 12% and 13% reduction, respectively, compared to the control group (Fig. 2B).
Morphology and insulin immunostaining in pancreas
Typical H&E staining results obtained upon histological exami- nation were shown in Fig. 3. The diabetic islets in control mice
were atrophied, indicating β-cell damage. PCE treatment pre- vented islet destruction and resulted in significantly preserved insulin levels (brown in the cytoplasm of pancreatic tissue sections) in a concentration-dependent manner.
Liver and adipose tissue molecular profiles
To compare the gene expression profiles of PCE treated and control db/db mice, we used microarray assay in the liver and adipose tissue (Table 3). Among 25,262 genes expressed in liver and 27,730 genes expressed in adipose tissue, we found 2 genes significantly up-regulated in liver and 3 genes in adipose tissue showing significant up-or down-regulation, compared to the DC group.
AMPK, GLUT4 and gluconeogenesis gene expression
As shown in Fig. 4, PCE markedly phosphorylated AMPK and
ACC compared to DC group (Fig 4A). In addition, PCE-treated
groups over expressed the mRNA of GLUT4 in the skeletal
muscle, indicating facilitation of glucose uptake into the
insulin-dependent tissue. Interestingly, expression of PEPCK and
G6Pase, a rate-limiting enzyme in gluconeogenesis pathway,
was almost completely decreased compared to DC group (Fig.
4B). As a result, through AMPK activation, PCE reduced hepatic glucose production through inhibiting PEPCK and G6Pase expression and higher mRNA expression of GLUT4 in PCE- treated mice reflects an increase in glucose flux into skeletal muscle.
DISCUSSION
In this study, we demonstrated that PCE significantly ameli- orated hyperglycemia and hyperlipidemia by reducing the blood glucose levels and increasing the serum insulin, C-peptide, HbA1c, and adiponectin concentrations in type 2 diabetic C57BL/KsJ db/db mice. Diabetes mellitus is sub-divided into two main forms. Type 1 diabetes mellitus (T1DM) is mainly due to an auto-immunemediated destruction of pancreatic β-cell islets.
On the other hand, type 2 diabetes mellitus (T2DM) is chara- cterized by insufficient insulin secretion and insulin resistance [13]. Type 2 diabetes is a chronic metabolic disorder affecting approximately 3% of population worldwide. But the conven- tional pharmacological treatments for type 2 diabetes have a number of limitations, such as adverse effects and high rates of secondary failure [14]. Anthocyanins are a subclass of flavo- noids that have been reported to improve insulin resistance and hyperlipidemia in several models of obesity and diabetes in rodents [15]. Interest in anthocyanins as natural colorants and valueadded ingredients has increased due to their color characteristics and potential health benefits. Chinese purple corn extracts were a natural source of anthocyanins and were stable over a wide range of temperatures and times [16]. This study identified 7 major non-anthocyanins and 5 major antho- cyanins in puple corn extracts (Table 1, Fig. 1). Recent studies indicate that diabetic atherosclerosis is not only a disease of hyperlipidemia but also an inflammatory disorder [17]. Existing evidence indicates that obesity-related insulin resistance results in a systemic prothrombotic state and might enhance the progression of atherosclerotic lesions [18]. In our study, we found that PCE 10 and PCE 50 groups showed 52% and 68%
reduction in blood glucose levels, respectively, compared to DC group, but not significantly change body weight, food and water intake (Table 2). The serum insulin level in the PCE 10 and Pinitol 10 treated db/db mice was significantly increased by 1.8 fold, 1.5 fold as compared to the control groups, respe- ctively. Pinitol (
D-3-O-methyl-chiro-inositol) has been reported to exert insulin-like effects. Pinitol extracted from Bougainvillea spectabilis reduced blood glucose in animal models of diabetes [19]. And also administration of PCE for 8 weeks resulted in significantly increased serum insulin, C-peptide, and adiponectin concentrations as compared to the DC group (Table 2). Similarly, Hong et al. [20] had reported that insulin level increased after treatment of purple corn anthocyanins in pancreatic β-cell. In the present study was also a significant increase in the levels of serum insulin and less destructed β-cells after administration of PCE to db/db mice. PCE less destructed β-cells and increased insulin secretion by decreasing blood glucose (Fig. 3).
OGTT is one of the most critical criteria for evaluating the effectiveness of hypoglycemic drugs [21]. PCE might enhance glucose utilization because they significantly reduced the blood glucose level in db/db mice. In glucose-fed mice, the elevated
blood glucose levels remained higher after 120 min. PCE signifi- cantly inhibited increases in the blood glucose level during the OGTT in db/db mice (Fig. 2). PCE significantly improved glucose tolerance and this fact could be attributed to the potentiation of the insulin effect of plasma by increasing the pancreatic secretion of insulin from existing β-cells or its release from bound insulin.
GK, G6pase, and glucose-6-phosphate dehydrogenase (G6PD) are important enzymes in carbohydrate metabolism [22].
Analysis of liver enzyme activity in the present study indicated that GK activity was also increased following PCE 50 treatment, by 37% as compared to the DC group (data not shown). Acyl- Coenzyme A oxidase 1 (ACOX1) and carnitine acetyltransferase (Cpt) are important proteins involved in fatty acid β-oxidation [23-27] and acyl-CoA synthetase long-chain family member 5 (ACSL5) is involved in lipogenesis [28, 29]. Microarray analysis identified 2 genes with increased liver expression levels and 3 genes with altered adipose expression in PCE-treated db/db mice (Table 3). These results indicated that PCE may affect expression of some genes involved in carbohydrate and lipid metabolism and promote fatty acid oxidation in adipose tissue.
AMPK belongs to the family of energy sensing enzymes that are activated by cellular stresses resulting in ATP depletion, thus acting like a ‘fuel gauge’ [30]. Upon activation, AMPK functions to restore cellular ATP by inhibiting ATP consumption processes as well as accelerating ATP generation processes [31]. This cascade is activated by stresses such as prolonged exercise, electrical stimulation of skeletal muscle, heart muscle ischemia, and through inhibition of the tricarboxylic acid cycle or oxidative phosphorylation [32,33]. As shown in Fig. 4A, PCE significantly phosphorylated AMPK and ACC compared to DC group. The phosphorylation of ACC decreases its activity and the concentration of malonyl CoA, the resulting product from the reaction, was decreased so that the activity of carnitine palmitoyltransferase (CPT1), which delivers fatty acid by using mitochondrial for acid oxidation was promoted [34]. In general, activation of AMPK down-regulates biosynthetic pathways such as fatty acid and cholesterol biosynthesis, yet switches on catabolic pathways that generate ATP, such as fatty acid oxidation, glucose uptake and glycolysis. In this study, we founded that PCE reduced hepatic glucose production through AMPK activation and ACC inactivation and decreased PEPCK or G6Pase gene expression (Fig. 4B). The AMPK pathway is a major mechanism enhancing glucose transport into skeletal muscle [35]. Skeletal muscle is the main site for glucose disposal in the body and there are two ways to stimulate glucose uptake into skeletal muscle: insulin dependent and insulin independent. Insulin resistance is one of the early defects detected in the muscle of diabetes patients and insulin resistance is mainly caused by insulin signaling pathway defects. Activation of AMPK by AICAR in rat or muscle cells overexpressing constitutively active AMPK increases glucose uptake and causes translocation of the glucose transporters GLUT1 and GLUT4 from microvesicles to the plasma membrane, esta- blishing the link between AMPK activation, glucose transport and the translocation of glucose transporters [35]. As shown in Fig. 4B, PCE markedly stimulated GLUT4 gene expression.
Our results suggest that PCE significantly decreased blood
glucose levels by increasing the levels of insulin, C-peptide,
adiponectin and also activating AMPK, decreased PEPCK, G6pase genes in liver, and GLUT4 expressions in skeletal muscle. Since PCE, controlled hyperglycemia and hyperlipidemia in db/db mice, it may be a successive candidate for treatment of type 2 diabetes. The extensive in vivo studies and clinical evaluation of PCE have to carry out to validate the previous observations.
ACKNOWLEDGMENTS
We thank Jong Bin Ji, Se Jin Choi, Set Byeol Kim, Jeong Geun Byeon and Soo Kyeong Lee for helpful experiments in this study.
REFERENCES
1. Vinik AI, Vinik E. Prevention of the complications of diabetes. Am J Manag Care 2003;3:S63-80.
2. Goldfrank L, Lewin N, Flomenbaum N, Howland MA. The pernicious panacea: herbal medicine. Hosp Physician 1982;10:64-9.
3. Bailey CJ, Day C. Traditional plant medicines as treatments for diabetes. Diabetes Care 1989;8:553-64.
4. Jing P, Giusti MM. Characterization of anthocyanin-rich waste from purple corncobs (Zea mays L.) and its application to color milk.
J Agric Food Chem 2005;22:8775-81.
5. Fossen T, Slimestad R, Andersen OM. Anthocyanins from maize (Zea mays) and reed canarygrass (Phalaris arundinacea). J Agric Food Chem 2001;5:2318-21.
6. Hagiwara A, Miyashita K, Nakanishi T, Sano M, Tamano S, Kadota T, Koda T, Nakamura M, Imaida K, Ito N, Shirai T. Pronounced inhibition by a natural anthocyanin, purple corn color, of 2-amino-1-methyl- 6-phenylimidazo[4,5-b]pyridine (PhIP)-associated colorectal carcino- genesis in male F344 rats pretreated with 1,2-dimethylhydrazine.
Cancer Lett 2001;1:17-25.
7. Tsuda T, Horio F, Osawa T. Dietary cyanidin 3-O-beta-D-glucoside increases ex vivo oxidation resistance of serum in rats. Lipids 1998;
6:583-8.
8. Tsuda T, Shiga K, Ohshima K, Kawakishi S, Osawa T. Inhibition of lipid peroxidation and the active oxygen radical scavenging effect of anthocyanin pigments isolated from Phaseolus vulgaris L. Biochem Pharmacol 1996;7:1033-9.
9. Yoshimoto M, Okuno S, Yoshinaga M, Yamakawa O, Yamaguchi M, Yamada J. Antimutagenicity of sweetpotato (Ipomoea batatas) roots.
Biosci Biotechnol Biochem 1999;3:537-41.
10. Li J, Lim SS, Lee JY, Kim JK, Kang SW, Kim JL, Kang YH. Purple corn anthocyanins dampened high-glucose-induced mesangial fibrosis and inflammation: possible renoprotective role in diabetic nephropathy. J Nutr Biochem 2012;4:320-31.
11. Tsuda T, Horio F, Uchida K, Aoki H, Osawa T. Dietary cyanidin 3-O-beta-D-glucoside-rich purple corn color prevents obesity and ameliorates hyperglycemia in mice. J Nutr 2003;7:2125-30.
12. Trinder P. Determination of blood glucose using an oxidase- peroxidase system with a non-carcinogenic chromogen. J Clin Pathol 1969;2:158-61.
13. Goldstein BJ. Insulin resistance as the core defect in type 2 diabetes mellitus. Am J Cardiol 2002;90:3-10.
14. Liu F, Kim J, Li Y, Liu X, Li J, Chen X. An extract of Lagerstroemia speciosa L. has insulin-like glucose uptake-stimulatory and adipocyte differentiation-inhibitory activities in 3T3-L1 cells. J Nutr 2001;9:
2242-7.
15. Guo H, Guo J, Jiang X, Li Z, Ling W. Cyanidin-3-O-b-glucoside, a typical anthocyanin, exhibits antilipolytic effects in 3T3-L1 adipocytes during hyperglycemia: Involvement of FoxO1-mediated transcrip- tion of adipose triglyceride lipase. Food chem Toxicol 2012;9:
3040-7.
16. Zhao X, Corrales M, Zhang C, Hu X, Ma Y, Tauscher B. Composition and thermal stability of anthocyanins from chinese purple corn (Zea mays L.). J Agric Food Chem 2008;22:10761-6.
17. Libby P, Plutzky J. Diabetic macrovascular disease: the glucose paradox? Circulation 2002;22:2760-3.
18. Nishina PM, Naggert JK, Verstuyft J, Paigen B. Atherosclerosis in genetically obese mice: the mutants obese, diabetes, fat, tubby, and lethal yellow. Metabolism 1994;5:554-8.
19. Narayanan CR, Joshi DD, Mudjumdar AM, Dhekne VV. Pinitol, a new anti-diabetic compound from the leaves of Bougainvillea spectabilis.
Curr Sci 1987;56:139-41.
20. Hong S, Heo J, Kim J, Kwon S, Yeo K, Bakowska-Barczak A, Kolodziejczyk, P, Ryu O, Choi M, Kang Y, Lim S, Suh H, Huh S, Lee J. Antidiabetic and Beta Cell-Protection Activities of Purple Corn Anthocyanins. Biomolecules & Therapeutics 2013;21:284-9.
21. Alberti KG, Zimmet PZ. New diagnostic criteria and classification of diabetes--again? Diabet Med 1998;7:535-6.
22. Scott DK, O'Doherty RM, Stafford JM, Newgard CB, Granner DK. The repression of hormone-activated PEPCK gene expression by glucose is insulin-independent but requires glucose metabolism. J Biol Chem 1998;37:24145-51.
23. Bressler R, Brendel K. The role of carnitine and carnitine acyltrans- ferase in biological acetylations and fatty acid synthesis. J Biol Chem 1966;17:4092-7.
24. Kelly DP, Gordon JI, Alpers R, Strauss AW. The tissue-specific expression and developmental regulation of two nuclear genes encoding rat mitochondrial proteins. Medium chain acyl-CoA dehydrogenase and mitochondrial malate dehydrogenase. J Biol Chem 1989;32:18921-5.
25. Ling B, Aziz C, Alcorn J. Systematic Evaluation of Key L-Carnitine Homeostasis Mechanisms during Postnatal Development in Rat.
Nutr Metab (Lond) 2012;1:66.
26. Nemali MR, Usuda N, Reddy MK, Oyasu K, Hashimoto T, Osumi T, Rao MS, Reddy JK. Comparison of constitutive and inducible levels of expression of peroxisomal beta-oxidation and catalase genes in liver and extrahepatic tissues of rat. Cancer Res 1988;18:5316-24.
27. Tsuchida T, Fukuda S, Aoyama H, Taniuchi N, Ishihara T, Ohashi N, Sato H, Wakimoto K, Shiotani M, Oku A. MGAT2 deficiency ameliorates high-fat diet-induced obesity and insulin resistance by inhibiting intestinal fat absorption in mice. Lipids Health Dis 2012;
11:75.
28. Jiang Z, Michal JJ, Chen J, Daniels TF, Kunej T, Garcia MD, Gaskins CT, Busboom JR, Alexander LJ, Wright RW Jr, Macneil MD. Discovery of novel genetic networks associated with 19 economically important traits in beef cattle. Int J Biol Sci 2009;6:528-42.
29. Wu XL, Macneil MD, De S, Xiao QJ, Michal JJ, Gaskins CT, Reeves JJ, Busboom JR, Wright RW Jr, Jiang Z. Evaluation of candidate gene effects for beef backfat via Bayesian model selection. Genetica 2005;
1:103-13.
30. Hardie DG. The AMP-activated protein kinase pathway--new players upstream and downstream. J Cell Sci 2004;23:5479-87.
31. Towler MC, Hardie DG. AMP-activated protein kinase in metabolic control and insulin signaling. Circ Res 2007;3:328-41.
32. Kemp BE, Mitchelhill KI, Stapleton D, Michell BJ, Chen ZP, Witters LA. Dealing with energy demand: the AMP-activated protein kinase.
Trends Biochem Sci 1999;1:22-5.
33. Rutter GA, Da Silva Xavier G, Leclerc I. Roles of 5'-AMP-activated protein kinase (AMPK) in mammalian glucose homoeostasis.
Biochem J 2003;1:1-16.
34. Velasco G, Geelen MJ, Guzmán M. Control of hepatic fatty acid
oxidation by 5'-AMP-activated protein kinase involves a malonyl- CoA-dependent and a malonyl-CoA-independent mechanism. Arch Biochem Biophys 1997;2:169-75.
35. Merrill GF, Kurth EJ, Hardie DG, Winder WW. AICA riboside increases AMP-activated protein kinase, fatty acid oxidation, and glucose uptake in rat muscle. Am J Phys 1997;1:1107-12.