Utilizing the Health Belief Model to predicting female middle school students’
behavioral intention of weight reduction by weight status
Dong-Yean Park
§Department of Home Economics Education, College of Education, Dongguk University, 707 Sekjang-dong, Gyeongju 780-714, Korea
Abstract
Weight reduction behavior is common among adolescent girls. The present study examined the status of weight reduction behavior and factors affecting the behavioral intention of weight reduction using the Health Belief Model (HBM) for female middle school students by weight category.
Survey data was collected from three girl’s middle schools in Gyeongju, Korea. A total of 299 female middle school students participated in this study. The questionnaire had questions about general characteristics, weight reduction behavior, and variables of HBM (perceived threat, perceived benefits, perceived barriers, cues to action, self-efficacy in dietary life and exercise, and behavioral intention of weight reduction). Descriptive statistics, Chi-square tests, ANOVA, and multiple regression analysis were applied to analyze the variables. A higher percentage of students in the overweight group attempted weight reduction than those in the underweight and the normal weight groups (P < 0.001). Among students who had attempted weight reduction, 73% tried diet therapy, while 78% tried exercise. Students in the normal and overweight groups showed significantly higher threat (P < 0.01) and cues to action (P < 0.001) than those in the underweight group. As for perceived benefits, barriers, and self-efficacy in dietary life and exercise, there were no significant differences among weight groups. Students in the overweight group showed the strongest intention of weight reduction and there were significant differences among the three weight groups (P < 0.001). Perceive threat (P < 0.01), cues to action (P < 0.001), and perceived self-efficacy (P < 0.01) were significantly associated to behavioral intention of weight reduction for all respondents. For the underweight group, perceived threat (P < 0.05) and perceived self-efficacy (P < 0.01) were the significant variables. For the overweight group, cue to action was the significant variable (P < 0.05).
Key Words: Health Belief Model, weight reduction, female middle school students
Introduction
9)Weight reduction behavior is common among adolescent girls.
It occurs in not only overweight or obese girls, but also normal weight and underweight girls [1-7]. For weight reduction, the majority of adolescent girls adopted healthy strategies such as moderate dieting by reducing their meal sizes and snacks, and exercise, which can provide benefits to overweight and obese girls. However, at the same time, some female adolescents used unhealthy strategies to lose weight like skipping meals, fasting, vomiting, or taking diet pills [1,2,5,6,8].
For both overweight and underweight adolescents, attempting to lose weight over the long-term can cause serious consequences for physical and psychological development. Being overweight during adolescence tends to track into adulthood and is associated with a variety of chronic diseases and risk of adult mortality [9,10] and psychosocial problems [11]. Underweight and extensive weight reduction is also associated with negative health consequences such as nutritional deficiency, growth retardation, mental functioning,
and reproductive capacity [12], and psychological problems like depression [13]. In addition, dieting is associated with the development of eating disorders [14]. Therefore, it is necessary to teach healthful strategies for weight reduction to overweight girls, and to prevent normal weight and underweight girls from unnecessary weight reduction.
For effective nutrition education about weight reduction, understanding factors affecting weight reduction behavior is important. Many studies investigated body-related factors leading weight reduction. Several motives for dieting were found in the studies with adolescents. Self-perception of overweight [2,3,5, 7,15], lower body satisfaction [6,16-18], and an inaccurate perception of their weight [19] were the motives which drove them to go on a diet.
Socio-cultural factors, such as a value on thinness and friends’
influences were associated with weight-related behaviors. Levine
et al. [20] reported that 10 to 14 year old girls were concernedwith being slender, and were prompted by parents, peers, and magazines in regard to weight management techniques and the
This work is supported by the research program of Dongguk University.
§Corresponding Author: Dong-Yean Park, Tel. 82-54-770-2267, Fax. 82-54-770-2527, Email. [email protected] Received: July 1, 2011, Revised: August 17, 2011, Accepted: August 17, 2011
ⓒ2011 The Korean Nutrition Society and the Korean Society of Community Nutrition
This is an Open Access article distributed under the terms of the Creative Commons Attribution Non-Commercial License (http://creativecommons.org/licenses/by-nc/3.0/) which permits unrestricted non-commercial use, distribution, and reproduction in any medium, provided the original work is properly cited.
importance of slenderness. Einsenberg et al. [21] reported that social norms of adolescent girls, particularly peer groups, had influenced unhealthy weight control behaviors. Hutchinson and Rapee [22] reported that friendship networks and peer influences were associated with a concern for body image, dietary restraint, extreme weight loss behaviors and binge eating, in a large community sample of young female adolescents. Leahey et al.
[23] found that social contacts and normative beliefs had an influence on weight status and intentions for weight control in young adults.
Due to health implications of weight reduction behavior, it is important to explore the factors that predict the occurrence of them. The Health Belief Model (HBM) has been applied to explain weight control behavior among adolescents. The HBM is a psychological model that attempts to explain and predict health behaviors. This model suggests that changes in health behaviors are predicted by perceived susceptibility, perceived severity, perceived benefits, and perceived barriers, cues to action and self-efficacy. Perceived susceptibility is a belief about the likelihood of getting a disease or condition. Perceived severity is a belief about the seriousness of the condition. Perceived threat is a sum of severity and susceptibility. Perceived benefit is a belief that a certain action will reduce risk of impact and perceived barriers is a belief about costs of the action. Cue to action is a motive to readiness and self-efficacy is one's confidence in the ability to successfully perform an action.
Several Studies have been conducted which focused on weight control using the HBM. Kang et al. [24] studied factors affecting obese adolescents’ intention to control their weight as measured by the elements of the HBM in the Seoul metropolitan area. She found that among the HBM variables, perceived benefit was the most important variable to explain female students’ intention to control their weight. Lee [25] examined the effect of health belief (which consisted of perceived susceptibility, perceived severity, perceived benefits, and perceived barriers, and cues to action) and self-efficacy on weight control behavior and intention to control obesity among elementary school students. She also found that health belief included dietary self-efficacy was a significant predicting variable for weight control behavior and intention to control obesity.
O’Connell et al. [26] studied how to predict dieting among obese and non-obese adolescents. They found that benefits of dieting were the most powerful predictors of dieting behavior for obese adolescents, whereas susceptibility to the causes of obesity best explained the present dieting behavior of non-obese adolescents. In another study, with female college undergraduate students [27,28], perceived benefits and susceptibility were the significant predictors of weight reduction behavior.
Students had an inaccurate perception about their weight. For Korean female adolescents, independent of actual BMI categories, they were likely to consider themselves heavier than their actual weight. A considerable proportion of the underweight adolescents perceived themselves as normal weight, even as overweight. A
substantial proportion of the normal weight girls perceived themselves as overweight or obese [2,4]. On the other hand, for American girls, a considerable proportion of students who were classified as overweight perceived themselves as normal weight, even as underweight. Some of the normal weight girls perceived themselves as overweight or underweight [15,19].
Perceived threats to obesity negatively predicted healthy eating behavior [29]. Perceived threat of obesity increases with an increase of weight, so they might feel a different level of threat according to their weights. If students perceived their weight inaccurately, they might underestimate (in case of overweight people) or overestimate (in case of underweight people) their threat to become obese. According to Moore et al. [30], overweight and obese women underestimated their weight categories and overweight women perceived the same threat to obesity as normal weight women. In addition, if students have misperceptions about their weights, they might perceive social pressure to be thin and friends’ influences on weight reduction behavior (cues to action in the HBM) differently. Therefore, it is essential to investigate the HBM variables by weight status.
Female middle school girls are an important demographic for studying weight reduction behavior because many of them already have had experience with weight reduction. Moreover, the rate of weight reduction might increase with age. However, there has been little research conducted using the HBM with this demographic.
The purpose of this study was to examine the status about weight reduction behavior, and to explore the factors affecting behavioral intention of weight reduction by applying the HBM for female middle school students by weight status. The HBM variables examined in this study included perceived threat (a sum of severity and susceptibility), perceived benefits, perceived barriers, cues to action, self-efficacy in dietary life and exercise, and behavioral intention of weight reduction. The results of this study will be useful in planning nutrition education about weight reduction by providing different approaches for different weight groups.
Subjects and Methods
Subjects
The subjects of this study were recruited from three girl’s
middle schools in Gyeongju, Korea in May, 2011. From two
of the schools, a classroom from the first, second, and third grade
was chosen. For the other school, one classroom from the first
and second grade was chosen, along with, two classrooms from
the third grade, to obtain enough overweight students for
statistical analysis, because there were more overweight students
in the third grade according to a report by the Korean Ministry
of Education, Science and Technology [31]. This decision was
also recommended by a teacher at the sampled middle school.
As a result, students were recruited from three first grade and second grade classrooms, and four third grade classrooms. The surveys were distributed to 335 participants. Surveys with missing data on key variables were excluded from analysis.
Therefore, 299 surveys out of 335 were analyzed.
Questionnaire development and contents
The first version of the questionnaire was developed based on literature search of similar studies [16,25,32-34]. The first draft was modified for this sample and checked by a middle school teacher for students’ understanding. After a pilot test with 10 students, some statements were rephrased and modified. The final questionnaire had three sections: general characteristics, experiences of weight reduction behaviors, and constructs of the HBM.
The general characteristics portion of the questionnaire consisted of questions about students’ grade, height, weight, parents’ obesity, parents’ education and occupation, and family economic status. The experiences of weight reduction behaviors section consisted of questions about satisfaction with body weight and experience, frequency, methods, and reason for weight reduction behavior. Finally, the questions about constructs of the HBM consisted of perceived threat, perceived benefits, perceived barriers, cues to action, perceived self efficacy in dietary life, perceived self-efficacy in exercise, and behavioral intentions of weight reduction.
All of the variables of the HBM, except behavioral intention, consisted of 4-point Likert scales. The Perceived threat scale consisted of eleven items about susceptibility (possibility of becoming obese) and severity of obesity (severity of disease resulting from obesity), the perceived benefits scale with 11 items, the perceived barriers scale with 12 items, the cues to action scale with 6 items, the perceived self-efficacy in dietary life scale with 16 items, and the perceived self-efficacy in exercise scale with 9 items. The items for each scale are presented in Table 4~9. Possible responses for each variable were
“completely disagree”, “disagree”, “agree”, and “completely agree”.
A score was given for each response from 1 to 4, whereby higher scores indicated a stronger feeling of each variable. Cronbach’s α of the perceived threat scale was 0.761, 0.859 for the perceived benefits scale, 0.805 for the perceived barriers scale, 0.764 for the cues to action scale, 0.843 for the perceived self-efficacy in dietary life scale, and 0.831 for the perceived self-efficacy in exercise scale.
Behavioral intention of weight reduction was measured using a 5-point Likert scale on five items. The results are presented in Table 10. Possible responses were “completely agree”, “agree”,
“don’t know”, “disagree”, and “completely disagree”. “don’t know” was added because intention could be undecided. A score of 1 to 5 was given to each response, whereby higher scores indicated a stronger intention. Cronbach’s α of this scale was 0.843.
Statistical analysis
Weight groups were divided into three categories: underweight (BMI < 18.5 kg/m
2), normal weight (18.5 < BMI < 22.9 kg/m
2), and overweight (BMI > 23 kg/m
2). There were few obese students, who were put into the overweight group. All statistical analyses were conducted according to the three weight groups.
The SAS software program version 9.2 was used for analysis.
Descriptive statistics were calculated for all relevant variables.
Chi-square tests were applied to analyze categorized variable.
The differences among the means were determined by ANOVA, followed by the Tukey test. Stepwise multiple regression analysis was completed to determine the factors associated with behavioral intention of weight reduction.
Results
General characteristics
The mean height, weight, and body mass index (BMI) of students were 158 cm, 50 kg, and 20, respectively. The height of respondents was not significantly different among weight groups. The mean weight of the students in the overweight group was about 63 kg, 52 kg in the normal weight group, and 43 kg in the underweight group, respectively. There was a 20 kg difference between the underweight group and the overweight group. The weight of respondents was significantly different among weight groups (P < 0.001). The mean BMI of students in the overweight group was about 24.7 kg/m
2, 20.5 kg/m
2the normal weight group, and 17.3 kg/m
2in the underweight group, respectively. The mean BMI was significantly different among weight groups (P < 0.001).
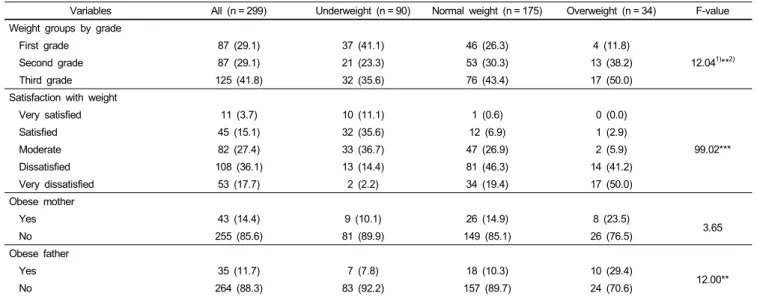
The subjects’ weight groups by grade and weight-related characteristics are presented in Table 1. The distribution of weight groups was significantly different by grades (P < 0.01).
Forty-one percent of the first grade students belonged to the underweight group, compared to 23% of the second grade students and 36% of the third grade students. On the other hand, 50% of the third grade students belonged to the overweight group, compared to 12% of the first grade students and 38%
of the second grade students. As a whole, about 60% of the students had a normal weight, while 30% were underweight, and 11% were overweight.
Data revealed that many students were not satisfied with their weight. Only about 20% of the students were satisfied with their weight, while about 50% of students were not. Students’
satisfaction with their weights showed significant differences
according to weight groups (P < 0.001). About half of the
students in the underweight group were satisfied with their
weight, while only 3% of students in the overweight group were
satisfied. Almost all of the students in the overweight group were
dissatisfied with their weight, while about 17% of the students
Variables All (n = 299) Underweight (n = 90) Normal weight (n = 175) Overweight (n = 34) F-value Weight groups by grade
First grade 87 (29.1) 37 (41.1) 46 (26.3) 4 (11.8)
12.041)**2)
Second grade 87 (29.1) 21 (23.3) 53 (30.3) 13 (38.2)
Third grade 125 (41.8) 32 (35.6) 76 (43.4) 17 (50.0)
Satisfaction with weight
Very satisfied 11 (3.7) 10 (11.1) 1 (0.6) 0 (0.0)
99.02***
Satisfied 45 (15.1) 32 (35.6) 12 (6.9) 1 (2.9)
Moderate 82 (27.4) 33 (36.7) 47 (26.9) 2 (5.9)
Dissatisfied 108 (36.1) 13 (14.4) 81 (46.3) 14 (41.2)
Very dissatisfied 53 (17.7) 2 (2.2) 34 (19.4) 17 (50.0)
Obese mother
Yes 43 (14.4) 9 (10.1) 26 (14.9) 8 (23.5)
No 255 (85.6) 81 (89.9) 149 (85.1) 26 (76.5) 3.65
Obese father
Yes 35 (11.7) 7 (7.8) 18 (10.3) 10 (29.4)
12.00**
No 264 (88.3) 83 (92.2) 157 (89.7) 24 (70.6)
1)χ2-test
2)Significantly different at **P< 0.01 and ***P< 0.001
Table 1. Weight groups by grade, satisfaction of weight, and parents’ obesity in the respondents N (%)
Family environment All Underweight Normal weight Overweight F-value
Father's education
≤ Middle school 17 (5.8) 4 (4.6) 11 (6.7) 2 (6.3)
1.191)
High school 123 (42.0) 34 (38.6) 75 (43.4) 14 (43.8)
≥ College 153 (52.2) 50 (56.8) 87 (50.3) 16 (50.0)
Mother's education
≤ Middle school 16 (5.4) 1 (1.1) 15 (8.7) 0 (0.00)
11.89*2)
High school 155 (52.7) 42 (47.7) 92 (53.2) 21 (63.6)
≥ College 123 (41.8) 45 (51.1) 66 (38.2) 12 (36.4)
Father's occupation
Professional 13 (4.4) 6 (6.7) 7 (4.0) 0 (0.0)
13.54
Office worker 129 (43.3) 44 (48.9) 75 (43.1) 10 (29.4)
Production worker 71 (23.8) 13 (14.4) 49 (28.2) 9 (26.5)
Service․self-employed 58 (19.5) 19 (21.1) 29 (16.7) 10 (29.4)
Others 27 (9.1) 8 (8.9) 14 (8.1) 5 (14.7)
Mother's occupation
Professional 32 (10.7) 8 (8.9) 21 (12.0) 3 (8.8)
10.84
Office worker 39 (13.0) 14 (15.6) 22 (12.6) 3 (8.8)
Production worker 14 (4.7) 2 (2.2) 9 (5.1) 3 (8.8)
Service․self-employed 55 (18.4) 14 (15.6) 30 (17.1) 11 (32.4)
Housewife 133 (44.5) 44 (48.9) 79 (45.1) 10 (29.4)
Others 26 (8.7) 8 (8.9) 14 (8.0) 4 (11.8)
Economic condition
Affluent 33 (11.1) 7 (7.9) 23 (13.1) 3 (9.1)
Moderate 230 (77.4) 74 (83.2) 131 (74.9) 25 (75.7) 3.07
Poor 34 (11.5) 8 (9.00) 21 (12.0) 5 (15.2)
1)χ2-test
2)Significantly different at *P< 0.05
Table 2. Family environment of respondents N (%)
in the underweight group were dissatisfied with their weight.
Even in the normal weight group, only about 8% of the students were satisfied with their weight, while two-thirds of the students
were not satisfied. Fourteen percent of the students answered that
their mothers were obese, whereas 12% of the students answered
that their fathers were obese. The rate of obesity for mothers
Variables All Underweight Normal weight Overweight F-value Experience in weight reduction behavior
Yes 139 (46.5) 22 (24.4) 93 (53.1) 24 (70.6)
28.631)***2)
No 160 (53.5) 68 (75.6) 82 (46.9) 10 (29.4)
Frequency of weight reduction behavior/year
Once 25 (18.5) 7 (36.8) 15 (16.1) 3 (13.0)
40.11***
2-3 times 79 (58.5) 11 (57.9) 55 (59.1) 13 (56.5)
4-5 times 15 (11.1) 1 (5.3) 11 (11.8) 3 (13.0)
≧ 6 times 16 (11.9) 0 (0.00) 12 (12.9) 4 (17.4)
Experience of diet therapy
Yes 99 (73.3) 11 (50.0) 68 (75.6) 20 (87.0)
36.08***
No 36 (26.7) 11 (50.0) 22 (24.4) 3 (13.0)
Experience of exercise therapy
Yes 106 (77.9) 19 (86.4) 70 (76.9) 17 (73.9)
30.63***
No 30 (22.1) 3 (13.6) 21 (23.1) 6 (26.1)
Experience of medical treatment
Yes 5 (3.7) 0 (0.00) 1 (1.1) 4 (17.4)
50.96***
No 130 (96.3) 22 (100) 89 (98.9) 19 (82.6)
Reason of weight reduction behavior
Health 30 (25.6) 6 (30.0) 20 (25.6) 4 (21.1)
38.21***
Better appearance 74 (63.2) 12 (60.0) 48 (61.5) 14 (73.7)
Others 13 (11.1) 2 (10.0) 10 (12.8) 1 (5.3)
1)χ2-test
2)Significantly different at ***P< 0.001
Table 3. Experience, frequency, methods, and reason of behavior of weight reduction of respondents who had experience N (%)
was not significantly different, but was significantly different for fathers (P < 0.01). A higher percentage of students in the overweight group answered that their fathers were obese compared to those of in the underweight and normal weight groups.
The results related to the family environment of the respondents are presented in Table 2. Regarding the education level of the students’ parents, 42% of fathers and 53% of mothers graduated from high school, and 52% of fathers and 42% of mothers graduated from college or above. The education level of the students’ fathers was not significantly different among weight groups. On the other hand, the education level of the students’
mothers was significantly different among weight groups (P <
0.05). A higher percentage of mothers in the underweight group finished more than a college level of education than those in the normal and overweight groups. As for jobs, office worker was the most popular occupation for fathers (43%) and housewife the most common for mother (45%). There was no significantly difference among weight groups. Most students answered their economic conditions were moderate, while 11% were affluent, and 12% were poor. There was no significant difference among weight groups.
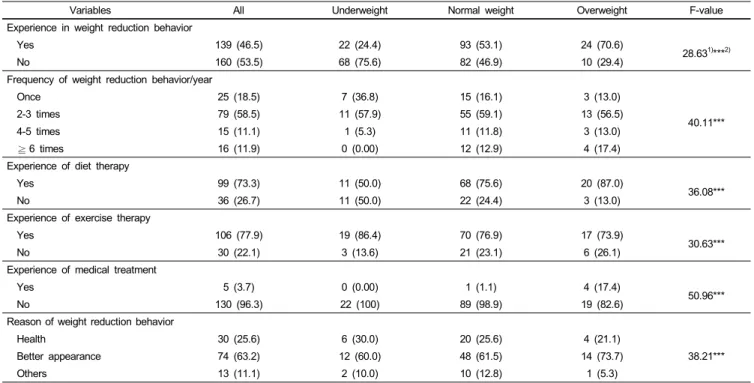
Behavior about weight reduction
Experience, frequency, methods, and reason of attempting weight reduction of respondents who had experience with weight reduction are presented in Table 3. About half of the students had experience trying to reduce their weight, and there were
significant differences among weight groups (P < 0.001). A higher percentage of students in the overweight group (71%) attempted to reduce their weight compared to the underweight (24%) and normal weight group (53%). The frequency of weight reduction behavior was significantly different among the weight groups (P < 0.001). Overall, about 60% of the students attempted to reduce their weight 2-3 times a year. This was similar among all three weight groups. However, 24% of the students in the normal weight group and 30% of the students in the overweight group tried to reduce their weight more than four times a year.
On the other hand, only 5% of the students in the underweight group attempted to reduce their weight more than four times a year.
Many students controlled their diet and exercised to reduce their weight. Among the students who had experience attempting to reduce their weight, 73% of them tried diet therapy, 78%
exercised, and only 4% underwent medical treatment. The methods
which students employed for weight reduction were significantly
different among the three weight groups (P < 0.001). A higher
percentage of students in the overweight group tried diet therapy
and medical treatment compared to the underweight group and
the normal weight group. However, a higher percentage of
students in the underweight group exercised compared to the
normal and overweight groups. About two-thirds of the students
responded that they attempted to reduce their weight to improve
their appearance, while 26% did so for health. There were
significant differences in the reasons for weight reduction among
the weight groups (P < 0.001). Compared to students in the
Perceived threat All Underweight Normal weight Overweight F-value If leave me the way I am, I will be obese. 2.51 ± 0.84 1.96 ± 0.78a1) 2.63 ± 0.72b 3.35 ± 0.54c 52.022)***3) I am more susceptible to disease than others. 1.87 ± 0.73 1.88 ± 0.74a 1.80 ± 0.69a 2.15 ± 0.82b 3.21*
I am subject to hypertension, diabetes, heart diseases more easily than others.
1.73 ± 0.70 1.58 ± 0.60a 1.71 ± 0.70a 2.21 ± 0.77b 10.72***
Obesity causes various diseases. 3.08 ± 0.70 2.97 ± 0.76 3.12 ± 0.68 3.15 ± 0.61 1.64
Obesity is a causative factor in serious diseases. 2.87 ± 0.76 2.79 ± 0.77 2.92 ± 0.77 2.85 ± 0.70 0.88
Once become obese, it's very difficult to get back to normal weight. 2.49 ± 0.84 2.41 ± 0.91 2.53 ± 0.77 2.50 ± 0.96 0.56
Obesity negatively affects our daily lives. 2.91 ± 0.63 2.84 ± 0.67 2.97 ± 0.60 2.74 ± 0.67 2.63
If obese, one cannot wear clothes one want. 3.14 ± 0.69 3.02 ± 0.71 3.20 ± 0.68 3.18 ± 0.72 1.96
If obese, one cannot exercise because of gasping for breath. 2.72 ± 0.79 2.72 ± 0.79 2.78 ± 0.77 2.44 ± 0.79 2.70
If obese, one will be a target of teasing. 2.69 ± 0.75 2.59 ± 0.76ab 2.79 ± 0.72a 2.41 ± 0.74b 4.82**
If obese, I don't have friends. 2.01 ± 0.72 1.96 ± 0.67ab 2.08 ± 0.73a 1.76 ± 0.74b 3.11*
Total 2.54 ± 0.41 2.42 ± 0.43a 2.59 ± 0.39b 2.61 ± 0.38b 5.81**
Response categories used a 4-point Likert scale (completely disagree = 1, disagree = 2, agree = 3, completely agree = 4). Score was given to each response from 1 to 4 to indicate higher scores strong feeling of threat.
1)Values within a row with different superscript letters are significantly different at P< 0.05 by Tukey test.
2)ANOVA
3)Significantly different at *P< 0.05, **P< 0.01, and ***P< 0.001
Table 4. Perceived threat of obesity Mean ± SD
Perceived benefits All Underweight Normal weight Overweight F-value
Health will be improved. 3.25 ± 0.57 3.19 ± 0.54 3.27 ± 0.59 3.35 ± 0.54 1.161)
Chronic diseases will be prevented. 3.19 ± 0.58 3.09 ± 0.61 3.24 ± 0.57 3.24 ± 0.50 2.16
It is easy to act in daily life. 3.25 ± 0.52 3.22 ± 0.54 3.27 ± 0.53 3.21 ± 0.48 0.35
Confidence will increased on everything 3.22 ± 0.67 3.10 ± 0.67 3.30 ± 0.62 3.18 ± 0.83 2.77
Appearance will be better. 3.15 ± 0.65 3.04 ± 0.62 3.20 ± 0.67 3.15 ± 0.66 1.69
I can get a boyfriend. 2.55 ± 0.76 2.48 ± 0.71 2.59 ± 0.77 2.50 ± 0.86 0.69
I will have wide range of selection for clothes. 3.23 ± 0.63 3.09 ± 0.65a2) 3.31 ± 0.61b 3.21 ± 0.64ab 3.94*3)
I will be attractive to others. 2.77 ± 0.72 2.67 ± 0.65 2.85 ± 0.72 2.62 ± 0.85 2.69
People react favorably to me. 2.69 ± 0.70 2.61 ± 0.65 2.75 ± 0.70 2.59 ± 0.78 1.66
I will save money for food. 2.71 ± 0.78 2.77 ± 0.75 2.71 ± 0.75 2.53 ± 0.99 1.15
I will exercise and play game better with friends. 2.93 ± 0.67 2.97 ± 0.63 2.97 ± 0.64 2.68 ± 0.88 2.83
Total 2.99 ± 0.43 2.93 ± 0.39 3.04 ± 0.43 2.93 ± 0.51 2.44
Response categories used a 4-point Likert scale (completely disagree = 1, disagree = 2, agree = 3, completely agree = 4). Score was given to each response from 1 to 4 to indicate higher scores strong feeling of benefits.
1)ANOVA
2)Values within a row with different superscript letters are significantly different at P< 0.05 by Tukey test.
3)Significantly different at *P< 0.05
Table 5. Perceived benefits of weight reduction Mean ± SD
normal and overweight groups, a higher percentage of students in the underweight group answered that health was their reason for weight reduction. Compared to students in the underweight and normal weight groups, a higher percentage of students in the overweight group answered that a better appearance was the reason for weight reduction.
Perceived threat for obesity
The students’ perceived threat of obesity is presented in Table 4. The mean score of the total perceived threat for all respondents was 2.54 (range 1-4) and showed the highest score (3.14) in the item “If obese, one cannot wear clothes one want.” followed by “Obesity cause various diseases” (3.08). Students in the overweight group showed the highest mean score (2.61).
The mean score of the total perceived threat did not show
significant differences between the normal weight group and overweight group, but showed significant differences between these two groups and the underweight group (P < 0.01). There were significant differences among weight groups in the items
“If leave me the way I am, I will be obese.” (P < 0.001), “I am more susceptible to disease than others.” (P < 0.05), “I am subject to hypertension, diabetes, heart disease more easily than others.” (P < 0.001), “If obese, one will be a target of teasing”
(P < 0.01), and “If obese, I don’t have friends” (P < 0.05).
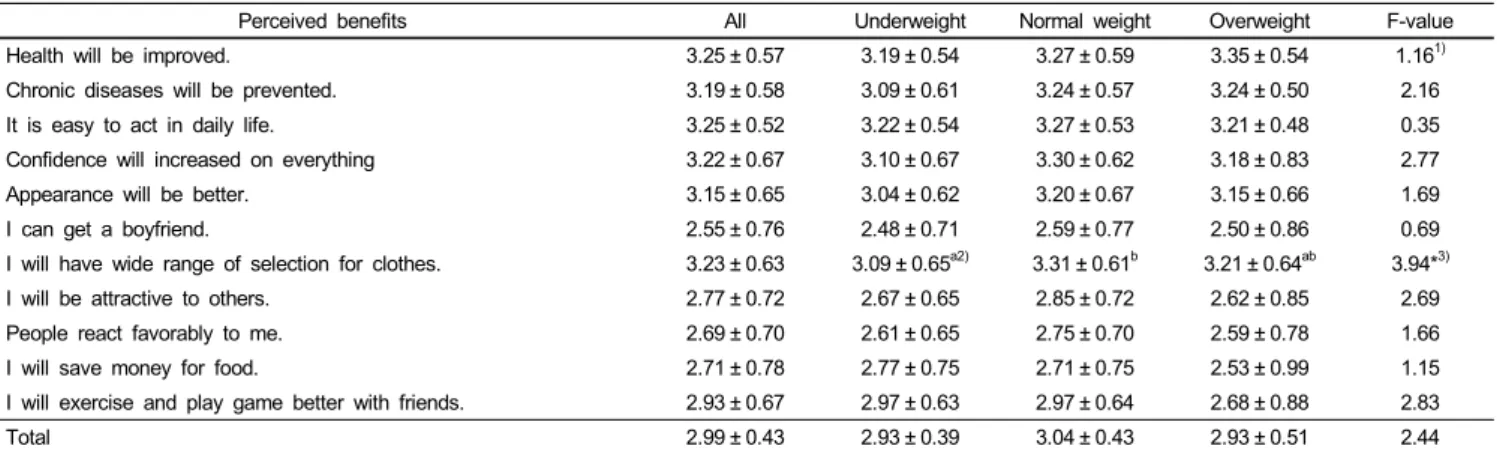
Perceive benefits of weight reduction
Students’ perceived benefits they could get by reducing their weight are presented in Table 5. The mean score of the total perceived benefits for all respondents was 2.99 (range 1-4).
Students in the normal weight group had the highest score (3.04)
Perceived barriers All Underweight Normal weight Overweight F-value I don't know right diet therapy for weight control. 2.44 ± 0.66 2.39 ± 0.67 2.49 ± 0.64 2.32 ± 0.77 1.201)
I don't know desirable snack for weight control. 2.40 ± 0.64 2.32 ± 0.63 2.45 ± 0.63 2.35 ± 0.69 1.21
I don't understand food and nutrition label on processed food. 2.42 ± 0.67 2.40 ± 0.58 2.43 ± 0.71 2.41 ± 0.74 0.08 I cannot make simple good snacks for weight control. 2.65 ± 0.69 2.60 ± 0.68 2.69 ± 0.68 2.56 ± 0.75 0.77 I cannot refuse to eat some food when family and friends ask to try. 2.40 ± 0.78 2.22 ± 0.80a2) 2.48 ± 0.75b 2.50 ± 0.79ab 3.54*3)
My family often eats food delivered. 1.97 ± 0.70 1.93 ± 0.72 2.01 ± 0.71 1.88 ± 0.59 0.62
My family often dines out. 2.00 ± 0.70 1.99 ± 0.77 2.01 ± 0.68 1.97 ± 0.63 0.04
It is difficult to stand when delicious food is in front of me. 2.44 ± 0.80 2.33 ± 0.83 2.47 ± 0.79 2.56 ± 0.75 1.33
I don't have time for dieting or exercise. 2.34 ± 0.73 2.22 ± 0.75 2.38 ± 0.69 2.41 ± 0.86 1.59
I don't know proper way to exercise for weight control. 2.19 ± 0.71 2.10 ± 0.74 2.25 ± 0.67 2.15 ± 0.78 1.45
My family and friends seldom exercise. 2.22 ± 0.76 2.22 ± 0.79 2.21 ± 0.73 2.29 ± 0.84 0.16
It is difficult to practice even though I make a plan. 2.76 ± 0.76 2.61 ± 0.80 2.82 ± 0.73 2.88 ± 0.73 2.77
Total 2.35 ± 0.40 2.28 ± 0.42 2.38 ± 0.39 2.36 ± 0.45 1.99
Response categories used a 4-point Likert scale (completely agree = 1, agree = 2, disagree = 3, completely disagree = 4). Score was given to each response from 1 to 4 to indicate higher scores strong feeling of barriers.
1)ANOVA
2)Values within a row with different superscript letters are significantly different at P< 0.05 by Tukey test.
3)Significantly different at *P< 0.05
Table 6. Perceived barriers to weight reduction Mean ± SD
Cue to action All Underweight Normal weight Overweight F-value
When my friends advise me to control weight 2.72 ± 0.77 2.56 ± 0.88 2.78 ± 0.70 2.82 ± 0.72 2.901)
When my family advise me to control weight 2.78 ± 0.72 2.57 ± 0.82a2) 2.88 ± 0.65b 2.85 ± 0.66b 6.07**3) When I get information about obesity from TV or newspapers 2.67 ± 0.74 2.58 ± 0.79 2.71 ± 0.72 2.68 ± 0.68 0.94
When my friends control their weight 2.69 ± 0.76 2.43 ± 0.81a 2.78 ± 0.73b 2.91 ± 0.67b 8.19***
When I want to have boyfriend 2.59 ± 0.86 2.44 ± 0.88 2.69 ± 0.83 2.50 ± 0.93 2.59
When I want to wear the clothes which I want 3.18 ± 0.71 2.90 ± 0.77a 3.30 ± 0.65b 3.32 ± 0.68b 10.58***
Total 2.77 ± 0.52 2.58 ± 0.61a 2.86 ± 0.43b 2.85 ± 0.51b 9.43***
Response categories used a 4-point Likert scale (completely agree = 1, agree = 2, disagree = 3, completely disagree = 4). Score was given to each response from 1 to 4 to indicate higher scores strong feeling of cue to action.
1)ANOVA
2)Values within a row with different superscript letters are significantly different at P< 0.05 by Tukey test.
3)Significantly different at **P< 0.01 and ***P< 0.001,
Table 7. Cues to action for weight reduction Mean ± SD
but there were no significant differences among the three groups.
With regard to the item “I will have wide range of selection for choosing clothes”, students in the normal weight group showed the highest score (3.31), which was significantly different (P < 0.05) than the other groups.
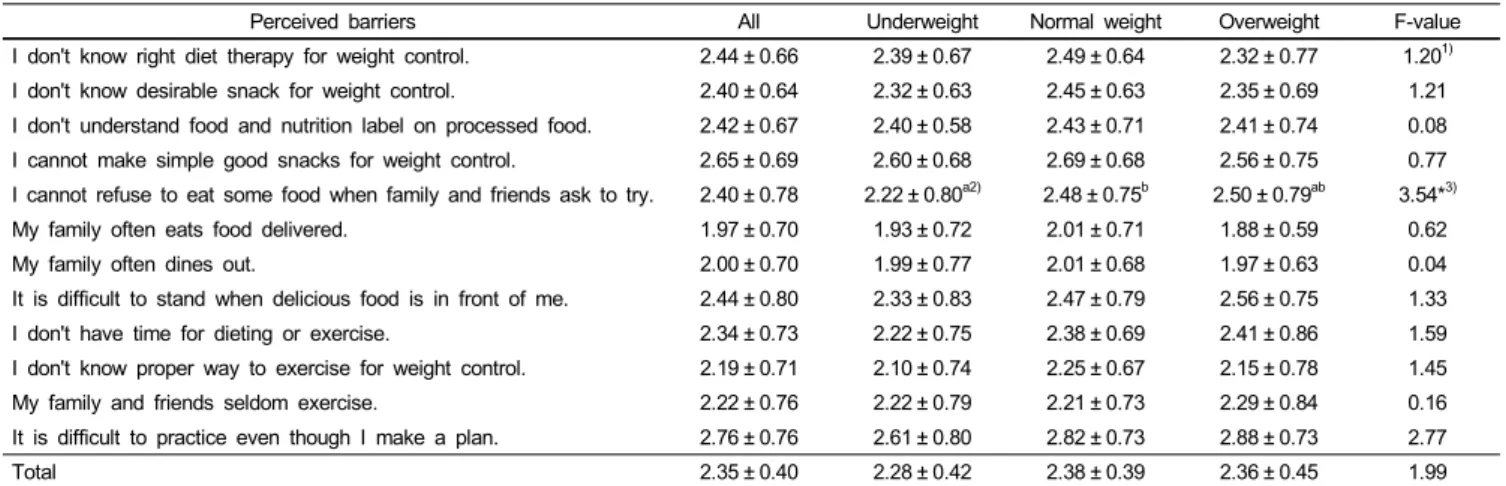
Perceived barriers to weight reduction
Students’ perceived barriers to weight reduction are presented in Table 6. The mean score of the total perceived barriers for all respondents was 2.35 (range 1-4). Students in the normal weight group had the highest score (2.38) but there were no significant differences among the three groups. Students in the normal weight group showed significant differences (P < 0.05) for the item “I cannot refuse to eat some food when family and friends ask to try” compared to students in the underweight group.
Cues to action for weight reduction
Cues to action for weight reduction are presented in Table 7.
The mean score of the total cues to action for all respondents
was 2.77 (range 1-4). Students in the underweight group showed significant differences from the normal and overweight groups (P < 0.001). Students in the underweight group showed a significant lower score than the students in the normal and overweight groups for three items: “when my friends advise me to control weight” (P < 0.01), “when my friends control their weight” (P < 0.001), and “when I want to wear the clothes which I want” (P < 0.001). There were no significant differences between the normal weight group and the overweight group.
Thus, it was found that students in the normal weight group were easily triggered from stimuli for weight reduction as much as students in the overweight group.
Perceived self-efficacy in dietary life and exercise
Self-efficacy in dietary life is presented in Table 8. The mean
score of the total self-efficacy in dietary life for all respondents
was 2.90 (range 1-4). Students in the underweight group had
the highest score (2.94) but did not show significant differences
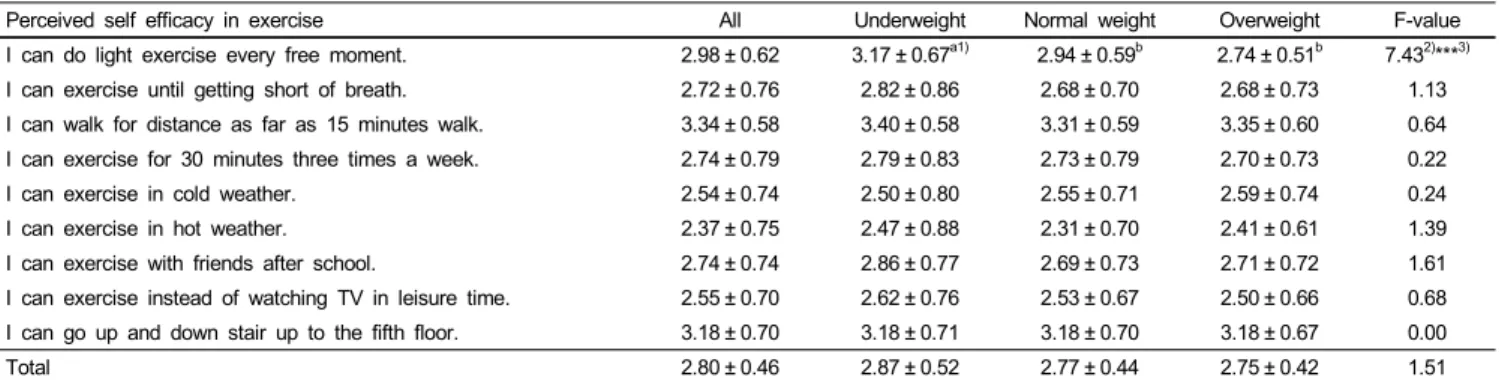
from other weight groups. Self-efficacy in exercise is presented
in Table 9. The mean score of the total self-efficacy in exercise
Perceived self efficacy in exercise All Underweight Normal weight Overweight F-value I can do light exercise every free moment. 2.98 ± 0.62 3.17 ± 0.67a1) 2.94 ± 0.59b 2.74 ± 0.51b 7.432)***3)
I can exercise until getting short of breath. 2.72 ± 0.76 2.82 ± 0.86 2.68 ± 0.70 2.68 ± 0.73 1.13
I can walk for distance as far as 15 minutes walk. 3.34 ± 0.58 3.40 ± 0.58 3.31 ± 0.59 3.35 ± 0.60 0.64
I can exercise for 30 minutes three times a week. 2.74 ± 0.79 2.79 ± 0.83 2.73 ± 0.79 2.70 ± 0.73 0.22
I can exercise in cold weather. 2.54 ± 0.74 2.50 ± 0.80 2.55 ± 0.71 2.59 ± 0.74 0.24
I can exercise in hot weather. 2.37 ± 0.75 2.47 ± 0.88 2.31 ± 0.70 2.41 ± 0.61 1.39
I can exercise with friends after school. 2.74 ± 0.74 2.86 ± 0.77 2.69 ± 0.73 2.71 ± 0.72 1.61
I can exercise instead of watching TV in leisure time. 2.55 ± 0.70 2.62 ± 0.76 2.53 ± 0.67 2.50 ± 0.66 0.68
I can go up and down stair up to the fifth floor. 3.18 ± 0.70 3.18 ± 0.71 3.18 ± 0.70 3.18 ± 0.67 0.00
Total 2.80 ± 0.46 2.87 ± 0.52 2.77 ± 0.44 2.75 ± 0.42 1.51
Response categories used a 4-point Likert scale (completely agree = 1, agree = 2, disagree = 3, completely disagree = 4). Score was given to each response from 1 to 4 to indicate higher scores strong feeling of self efficacy in exercise.
1)Values within a row with different superscript letters are significantly different at P< 0.05 by Tukey test.
2)ANOVA
3)Significantly different at ***P< 0.001
Table 9. Perceived self efficacy in exercise Mean ± SD
Behavioral intention of weight reduction All Underweight Normal weight Overweight F-value
I intend to control diet to reduce weight within six months. 3.63 ± 1.01 3.13 ± 1.15a1) 3.85 ± 0.87b 3.79 ± 0.81b 17.082)***3) I intend to visit clinic to reduce weight within six months. 2.53 ± 1.08 2.00 ± 0.87a 2.67 ± 1.06b 3.18 ± 1.17c 20.77***
I intend to exercise by myself regularly to reduce weight within six months.
3.78 ± 0.89 3.41 ± 1.08a 3.90 ± 0.73b 4.09 ± 0.83b 12.24***
I intend to attend sport center or class to reduce weight within six months.
2.97 ± 1.13 2.59 ± 1.15a 3.05 ± 1.06b 3.62 ± 1.04c 12.00***
I intend to attend obese class if my school opens it. 2.76 ± 1.17 2.17 ± 1.03a 2.96 ± 1.13b 3.29 ± 1.14b 19.99***
Total 3.13 ± 0.83 2.66 ± 0.86a 3.28 ± 0.72b 3.59 ± 0.74c 26.38***
Response categories used a 5-point Likert scale (completely agree = 1, agree = 2, don’t know = 3, disagree = 4, completely disagree = 5). Score was given to each response from 1 to 5 to indicate higher scores strong intention.
1)Values within a row with different superscript letters are significantly different at P< 0.05 by Tukey test.
2)ANOVA
3)Significantly different at ***P< 0.001
Table 10. Behavioral intention of weight reduction of respondents Mean ± SD
Perceived self efficacy in dietary life All Underweight Normal weight Overweight F-value
I cam eat three meals regularly. 3.10 ± 0.82 3.17 ± 0.86 3.10 ± 0.78 2.91 ± 0.87 1.201)
I can eat meals in moderate amounts. 3.02 ± 0.70 3.11 ± 0.79 3.01 ± 0.67 2.88 ± 0.54 1.47
I can eat fresh food rather than processed one. 2.82 ± 0.69 2.88 ± 0.78 2.80 ± 0.66 2.79 ± 0.59 0.42
I can refrain to eat sweets like candy and cookie. 2.82 ± 0.77 2.89 ± 0.83 2.79 ± 0.75 2.76 ± 0.70 0.55
I can refrain to eat fatty food like fried food and fork belly. 2.77 ± 0.73 2.82 ± 0.80 2.73 ± 0.71 2.79 ± 0.64 0.51 I can refrain to drink carbonated drink like cola and cider. 3.00 ± 0.80 3.03 ± 0.88 2.97 ± 0.79 3.06 ± 0.65 0.33
I can eat various foods to avoid unbalance in diet. 2.79 ± 0.93 2.80 ± 0.96 2.78 ± 0.90 2.76 ± 0.99 0.02
I can refrain to eat just before going to bed. 3.02 ± 0.73 2.92 ± 0.80 3.07 ± 0.70 3.00 ± 0.65 1.22
I can eat slowly even when hungry 2.85 ± 0.78 2.80 ± 0.88 2.91 ± 0.74 2.65 ± 0.69 1.82
I can stop to eat before filling stomach even the food is delicious. 2.69 ± 0.79 2.68 ± 0.92 2.71 ± 0.73 2.62 ± 0.74 0.20
I can get up early to eat breakfast. 2.67 ± 0.89 2.73 ± 0.99 2.69 ± 0.84 2.44 ± 0.93 1.34
I can refrain to watch TV or read book when I eat. 2.73 ± 0.83 2.73 ± 0.90 2.73 ± 0.81 2.74 ± 0.79 0.00
I can refuse to eat when my family members or friends offer foods. 2.88 ± 0.74 2.93 ± 0.82 2.89 ± 0.72 2.71 ± 0.63 1.17
I can refrain to eat when I am bored. 2.92 ± 0.75 3.04 ± 0.78 2.88 ± 0.74 2.79 ± 0.69 1.97
I can refrain to eat when I am angry. 3.23 ± 0.75 3.29 ± 0.78 3.23 ± 0.72 3.09 ± 0.79 0.89
I can refrain to eat when I am depressed. 3.19 ± 0.75 3.27 ± 0.78 3.18 ± 0.73 3.03 ± 0.80 1.26
Total 2.90 ± 0.46 2.94 ± 0.54 2.90 ± 0.43 2.81 ± 0.36 0.91
Response categories used a 4-point Likert scale (completely agree = 1, agree = 2, disagree = 3, completely disagree = 4). Score was given to each response from 1 to 4 to indicate higher scores strong feeling of self efficacy in dietary life.
1)ANOVA
Table 8. Perceived self efficacy in dietary life Mean ± SD
for all respondents was 2.80 (range 1-4). Like self-efficacy in a dietary life, students in the underweight group had the highest
score (2.87) but did not show significant differences from other
weight groups. For the item “I can do light exercise every free
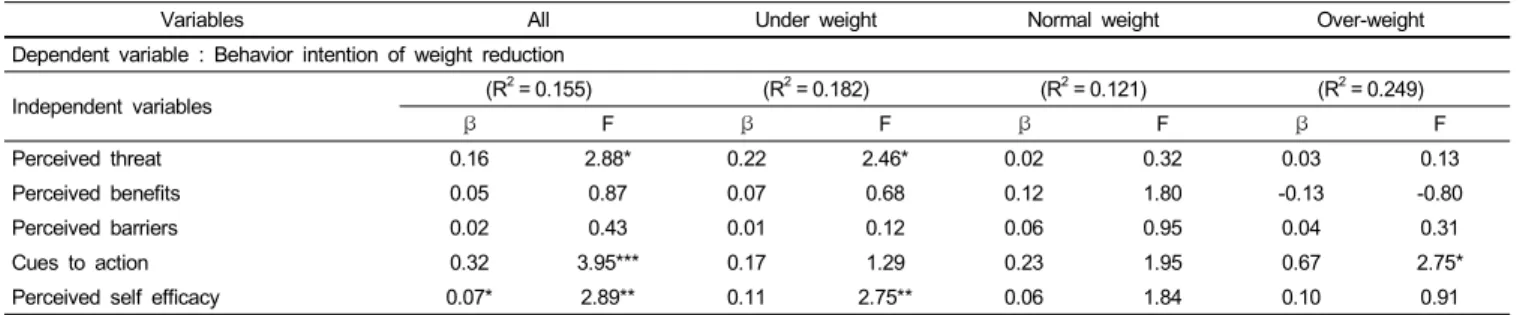
Variables All Under weight Normal weight Over-weight Dependent variable : Behavior intention of weight reduction
Independent variables (R2= 0.155) (R2= 0.182) (R2= 0.121) (R2= 0.249)
β F β F β F β F
Perceived threat 0.16 2.88* 0.22 2.46* 0.02 0.32 0.03 0.13
Perceived benefits 0.05 0.87 0.07 0.68 0.12 1.80 -0.13 -0.80
Perceived barriers 0.02 0.43 0.01 0.12 0.06 0.95 0.04 0.31
Cues to action 0.32 3.95*** 0.17 1.29 0.23 1.95 0.67 2.75*
Perceived self efficacy 0.07* 2.89** 0.11 2.75** 0.06 1.84 0.10 0.91
1)Significantly different at *P< 0.05, **P< 0.01 and ***P< 0.001
Table 11. Multiple regressions on behavior intention of weight reduction
moment”, students in the underweight group had the highest score (3.17) and showed significant differences (P < 0.001) from other groups.
Behavioral intention of weight reduction
The students’ behavioral intention of weight reduction is presented in Table 10. The mean score of the intention was 3.13 (range 1-4) for all respondents. They intended to reduce their weight by controlling their diet and exercising regularly more strongly than visiting a clinic and going to a fitness center.
Students in the overweight group showed the strongest intention (3.59), followed by students in the normal weight group (3.28) and underweight group (2.66). There were significant differences among weight groups (P < 0.001). Different from other variables, all of the items in behavioral intention showed significant differences among groups. Thus, students in the overweight group showed a significantly (P < 0.001) higher score for the intention of visiting a clinic, exercising regularly, going to a fitness center, and attending school obese class than students in the normal and underweight groups. For the intention of controlling their diet, there were no significant differences between the overweight and normal weight groups, but showed significant differences between these two groups and the underweight group.
Predicting behavioral intention of weight reduction