Effects of soybean supplementation on blood glucose, plasma lipid levels, and erythrocyte antioxidant enzyme activity in type 2 diabetes mellitus patients
Ji Ho Chang 1,3 , Min Sun Kim 1 , Tae Wha Kim 2 and Sang Sun Lee 1§
1
Department of Food & Nutrition, Hanyang University, 17 Haengdang-dong, Seongdong-gu, Seoul 133-791, Korea
2
Department of Internal Medicine, College of Medicine, Hanyang University Hospital, 17 Haengdang-dong, Seongdong-gu, Seoul 133-792, Korea
3
Department of Health Promotion Center, Asan Medical Center, 388-1 Pungnap-2 dong, Songpa-gu, Seoul, 138-736, Korea
Received July 18, 2008; Revised August 26, 2008; Accepted September 8, 2008
Abstract
The purpose of this study was to investigate the effect of soybean on blood glucose and lipid concentrations, and antioxidant enzyme activity in type 2 diabetes mellitus (DM) patients. We divided patients into two groups and fed them, respectively, a basal diet (control group) and a basal diet with 69 g/d of soybean (soybean group) for 4 weeks. Pills with roasted soybean powder were provided to the soybean supplementation group three times a day. Macronutrients intake except dietary fiber was similar between the two groups. No significant differences were observed in dietary intakes or body weight before and after the supplementation. Energy composition ratio of C:F:P was 65:19:16 in the control group, 64:20:16 in the soybean group. The blood parameters of subjects before supplementation, such as fasting blood glucose, postprandial glucose level, total cholesterol, triglyceride, LDL-cholesterol and HbA
1C were not different between the two groups. After supplementation, fasting blood glucose (p<0.001), postprandial glucose level (p<0.001) and serum triglyceride level (p<0.05) were significantly reduced in the soybean group in comparison with the control group.
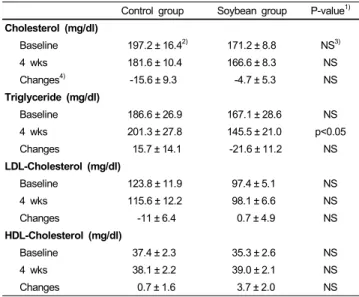
The total cholesterol level was not significantly different between the control and the supplemented group after 4 weeks of treatment. TBARS levels of the soybean group were not significantly different from those of the control group. The activities of catalase (p<0.01) and glutathione peroxidase (p<0.05) were significantly higher in the soybean group compared to the control group. The results of this study suggest that soybean supplementation would be helpful to control blood glucose and serum lipid in diabetic patients. Also, soybean showed an antioxidant activity that may contribute to enhance the effect of antioxidant defense. This activity contributes to protection against oxidative damage in type 2 DM patients. Soybean may have potential use in the disease management of patients with DM.
Key Words: Soybean, glycemic control, blood lipid levels, antioxidant enzyme activities, type 2 DM
Introduction 2)
The prevalence of diabetes mellitus (DM) is increasing worldwide, and it will be a major health problem in the 21st century. Worldwide prevalence of DM was estimated to be 177 million cases in 2000 and is projected to increase to 366 million by 2030, largely owing to an aging population, increased urbani- zation, and more sedentary lifestyles (Wild et al., 2004).
The metabolic characteristics of diabetes patients are abnormally high concentrations of glucose in the blood and lipid metabolic abnormality (Coulston & Hollenbeck, 1988). The serum lipid abnormalities in type 2 DM are characterized by decreased HDL-C level and hypertriglyceridemia, whereas total cholesterol and LDL-C levels are similar to those in nondiabetic subjects (Kjeld et al., 2001). The important goal of DM treatment is to keep blood glucose, lipid and lipoprotein levels close to normal resulting in a reduction of coronary artery disease, a delay in onset and a major slowing in the progression of complications (Venkateswaran & Pari, 2002).
Type 2 DM is associated with increased oxidation stress (McColl et al., 1997). Free radicals, lipid peroxides and oxidation of low-density lipoproteins (LDL) have been suggested to have a role in the increased risk of cardiovascular disease (CVD) associated with type 2 DM. In diabetes, impaired glucose metabolism may lead to an increase in hydroxyl radical production. Some complications of DM are associated with increased activity of free radical-induced lipid peroxidation and accumulation of lipid peroxidation products (Palanduz et al., 2001). Mechanisms that contribute to increased lipid peroxide formation in diabetic patients include : hyperglycemic-induced glucose auto-oxidation, non-enzymatic glycation of proteins and lipids, increased sorbitol pathway activity, oxidation of advanced glycation end-products (AGEs) and cyclooxygenase dependent formation of prostaglandin H2 (PGH
2) (Kesavulu et al., 2001).
A variety of natural antioxidants exist to scavenge oxygen free radicals and prevent oxidative damage to biological membranes.
Soybean contains complex carbohydrates, protein, dietary fiber, oligosaccharides, phytosterol, saponin, lecithin, isoflavone, phytic
§
Corresponding Author: Sang-Sun Lee, Tel. 82-2-2220-1206, Fax. 82-2-2292-1226, Email. [email protected]
acid, trypsin inhibitor, and minerals. Complex carbohydrates and dietary fiber contents contribute to low glycemic indexes, which benefit diabetic individuals (Jenkins et al., 1981) and reduce the risk of developing diabetes. Also, soybean reduces cholesterol levels (Slameron et al., 1997). When diabetic patients were fed diets rich in leguminous seeds, in addition to improved blood glucose control, lower serum TG levels were seen than when other carbohydrate sources were used, especially for individuals with raised serum TG levels (Simpson et al., 1981). It appears from several studies that soy-based diets may provide benefits in conditions associated with impaired glucose tolerance, hyperlipi- demia and reduced insulin sensitivity (Hermansen et al., 2001;
Kang et al., 2006; Lee, 2006). A meta-analysis of 38-controlled clinical trials indicated that consumption of 25-50 g soy protein was effective in lowering serum T-C (Anderson et al., 1995).
Polichetti et al. (1996) indicated that the administration of soybean lecithin (phosphatidylcholine) to animals with experimentally induced hypercholesterolemia decreased the level of plasma T-C, LDL-C and increased that of HDL-C when compared to a similar supply of polyunsaturated fatty acid. It is reported that polyunsaturated soybean phospholipids induce a significant reduction in plasma cholesterol levels in hypercholesterolemic patients (Kurowska et al., 1997). In prospective randomized clinical trials, achieving near-normal glycemic control in patients with DM was associated with sustained, decreased rates of diabetic complications, including CVD (The diabetes control and complications trial research group, 1993). Thus, in the past two decades, investigators have focused on the blood glucose, lipid-lowering effects of soy-based foods (Tonstard et al., 2002).
Accordingly, the purpose of this study was to investigate potential glucose-lowering and hypolipidemic effects of soybean in type 2 DM patients. We also examined the effects of soybean on lipid peroxidation and antioxidant enzymes activity in type 2 DM patients.
Subjects and Methods
Study subjects
This study was approved by the Ethics Committee and the Institutional Review Board for Human Subjects Research at Hanyang University Hospital, Seoul, Korea and all patients signed an informed consent document. Twenty patients with type 2 DM participated in the study. Patients were selected based on the presence of chemistry profiles and OGTT (oral glucose tolerance test). All patients had DM with fasting plasma glucose levels of 150-300 mg/dl. Patients were randomized into either a control group or a soybean group. Exclusion criteria included the presence of active liver disease or hepatic and renal dysfunction, uncontrolled hypertension, hypo-hyperthyroidism, gastrointestinal disease, severe stress, and allergy response to soybean.
Study design
The soybean was washed and dried by hot-air, roasted and ground up. Then the soybean powder was made into pills. Pills were provided to the soybean supplementation group three times a day for 4 weeks. Total daily consumption of soybean equaled 69 g. Soybean supplement of 69 g provided 23.9 g of protein and 18 g of dietary fiber. Diets for DM patients provided 1,800 kcal and 18 g of dietary fiber daily. Accordingly, the amount of dietary fiber intake in the soybean group doubled in comparison with the control group. Twenty subjects were divided into two groups. Control group was provided a diabetes diet used in the hospital. Supplemented group was provided a similar diet with the exception of soybean supplementation. The subjects continued normal daily activities and exercise patterns.
General characteristics of age, sex, dietary patterns, lifestyle, family history, diabetes duration, alcohol intake, smoking and treatment type were collected by questionnaire. During the study, patients remained on usual medications, diets or lifestyles.
Nutritional assessments were performed by 24 hour recall method at the beginning and end of the experiment. Daily nutrient intake was calculated using the Computer Aided Nutritional Analysis software (Can-pro, version 3.0, The Korean Nutrition Society) based on data from Korean food-composition tables. Other health foods or supplement intakes were restricted during the experimental period.
Biochemical analysis
Blood samples were obtained at the beginning and end of the 4-week experiment. We measured blood glucose, lipids (total cholesterol, triglyceride, HDL-cholesterol, LDL-cholesterol), HbA
1C after fasting, and 2 hour postprandial blood glucose levels. Blood values were analyzed by standard methods at the biochemical laboratory of Hanyang University Hospital, a certified clinical laboratory.
Laboratory analysis
For erythrocyte lysates, blood was collected in tubes containing EDTA and then centrifuged at 1,500 g for 10 minutes at 4℃.
The supernatant containing the plasma and buffy coat was discarded. The red blood cell pellet was washed three times with cold saline and frozen immediately at -70℃ until analysis.
Hemoglobin was separated from the blood cells by precipitation with an ethanol/chloroform mixture, followed by continuous shaking for 5 min and centrifugation at 2,500 g for 20 min. The supernatants were used to determine enzyme activity.
The total amount of lipid peroxidation products was measured with the thiobarbituric acid method, which quantifies plasma thiobarbituric acid reactive substances (TBARS) at 532 nm.
Erythrocyte superoxide dismutase (SOD, EC 1.15.1.1) activity
was measured using pyrogallol (Marklund, 1984). Erythrocyte
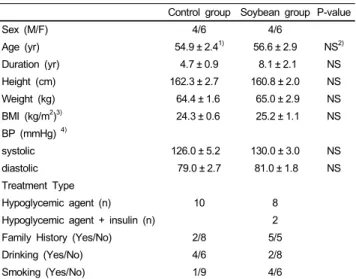
Table 1. The general characteristics of subjects
Control group Soybean group P-value
Sex (M/F) 4/6 4/6
Age (yr) 54.9 ± 2.4
1)56.6 ± 2.9 NS
2)Duration (yr) 4.7 ± 0.9 8.1 ± 2.1 NS
Height (cm) 162.3 ± 2.7 160.8 ± 2.0 NS
Weight (kg) 64.4 ± 1.6 65.0 ± 2.9 NS
BMI (kg/m
2)
3)24.3 ± 0.6 25.2 ± 1.1 NS
BP (mmHg)
4)systolic 126.0 ± 5.2 130.0 ± 3.0 NS
diastolic 79.0 ± 2.7 81.0 ± 1.8 NS
Treatment Type
Hypoglycemic agent (n) 10 8
Hypoglycemic agent + insulin (n) 2
Family History (Yes/No) 2/8 5/5
Drinking (Yes/No) 4/6 2/8
Smoking (Yes/No) 1/9 4/6
1)
Mean ± S.E.
2)
Not Significant at α=0.05 level by independent t-test
3)
BMI : Body Mass Index
4)
BP : Blood Pressure
Table 2. Comparison of nutrients intake in subjects between the two groups during the supplementation
Control group Soybean group P-value
1)Carbohydrate (g) 375.4 ± 26.5
2)351.8 ± 21.6 NS
3)Fat (g) 47.4 ± 8.3 52.7 ± 3.3 NS
Protein (g) 91.8 ± 9.4 93.2 ± 2.9 NS
Fiber (g) 10.3 ± 0.7 31.1 ± 1.7 p<0.001
Calories (kcal) 2295.4 ± 126.2 2340.6 ± 64.3 NS
CFP ratio
4)65:19:16 64:20:16
1)
Statistical significance was calculated by independent t-test.
2)
Mean ± S.E.
3)
Not Significant at α=0.05 level by independent t-test
4)
CFP ratio = Carbohydrate : Fat : Protein ratio
Table 3. Blood glucose levels before and after the supplementation Control group Soybean group P-value
1)FBG (mg/dl)
2)Baseline 183.0 ± 14.7
3)169.7 ± 23.0 NS
4 wks 173.0 ± 9.8 109.9 ± 7.7 p<0.001
Changes
4)-12.2 ± 13.5 -57.3 ± 15.5 p<0.05
PP-2hr (mg/dl)
5)Baseline 278.4 ± 26.1 270.6 ± 33.8 NS
4 wks 258.3 ± 21.5 167.3 ± 21.0 p<0.001
Changes -14.3 ± 17.8 -99.9 ± 15.8 p<0.001
HbA
1C (%)
6)Baseline 8.1 ± 0.3 8.9 ± 0.8 NS
4 wks 7.1 ± 0.2 7.1 ± 0.3 NS
Changes -1.0 ± 0.4 -1.8 ± 0.5 NS
1)
Statistical significance was calculated by an independent t-test between the value of control and soybean groups.
2)
FBG : Fasting Blood Glucose level
3)
Mean ± S.E.
4)
Changes : The differences between baseline and 4wks value
5)
PP-2hr : Postprandial Glucose level
6)
HbA
1C : Glycosylated Hemoglobin A
1C level
catalase (CAT, EC 1.11.1.6) activity was calculated by spectrophotometrically measuring the disappearance of H
2O
2at 240 nm (Aebi, 1984). Erythrocyte glutathione peroxidase (GSH-Px, EC 1.4.1.9) activity was assayed according to the method of Flohe and Gunzler (1984).
The hemoglobin concentration of lysates was determined spectrophotometrically at 546 nm using the cyanomethaemoglobin method of Mahoney et al. (1993). All assays were carried out in triplicate using a spectrophotometer (Beckman-Coulter DU 400, Fullerton, CA, USA).
Statistical analysis
All data were reported as mean ± standard error of the mean.
The results were statistically analyzed by the SPSS/PC computer program (Statistical Package for Social Science 11.0). Differences between the control group and the soybean group were assessed using an independent t-test. Significance was defined as p<0.05.
Results
Table 1 shows the general characteristics of the subjects. The subjects included 8 males and 12 females. The mean age was 54.9 ± 2.4 years in the control group and 56.6 ± 2.9 years in the soybean group. Pharmacological therapy showed that 18 people used oral hypoglycemic agent and 2 people used insulin injection and oral hypoglycemic agent. The rate of alcohol intake was 40%
in the control group and 20% in the soybean group. The rate of smoking was 10% in the control group and 40% in the soybean group. Height, weight, BMI, and blood pressure of both groups at the beginning were not statistically different. The mean BMI of subjects showed 24.3 kg/m
2in the control group and 25.2
kg/m
2in the soybean group. The blood pressure of two groups was in the normal range (130/80 mmHg or less).
Nutrient intake of subjects is given in Table 2. Intakes of macronutrients did not show significant differences between the control group and the soybean group with the exception of dietary fiber intake (p<0.001), which was higher in patients who were fed soybean supplement. Energy composition ratio of C:F:P was 65:19:16 in the control group, 64:20:16 in the soybean group.
Mean protein intake of the soybean group was not different from that of the control group as determined by 24 hour recall including soybean supplement and the mean dietary fiber intake in patients who received soybean supplement was 31 g/d.
Table 3 shows the mean change in the blood glucose level of the subjects before and after the soybean supplementation.
The level of fasting blood glucose (FBG), postprandial glucose
(PP-2hr) and HbA
1C of two groups showed no differences at
the beginning. After soybean supplementation, compared to the
control group, levels of FBG (p<0.001) and PP-2hr (p<0.001)
were significantly lower in the soybean group, but the level of
HbA
1C between the control group and the soybean group showed
no significant differences. The changes of FBG (p<0.05) and
PP-2hr (p<0.001) in the soybean group after 4 weeks of treatment
Table 4. Blood lipids levels before and after the supplementation Control group Soybean group P-value
1)Cholesterol (mg/dl)
Baseline 197.2 ± 16.4
2)171.2 ± 8.8 NS
3)4 wks 181.6 ± 10.4 166.6 ± 8.3 NS
Changes
4)-15.6 ± 9.3 -4.7 ± 5.3 NS
Triglyceride (mg/dl)
Baseline 186.6 ± 26.9 167.1 ± 28.6 NS
4 wks 201.3 ± 27.8 145.5 ± 21.0 p<0.05
Changes 15.7 ± 14.1 -21.6 ± 11.2 NS
LDL-Cholesterol (mg/dl)
Baseline 123.8 ± 11.9 97.4 ± 5.1 NS
4 wks 115.6 ± 12.2 98.1 ± 6.6 NS
Changes -11 ± 6.4 0.7 ± 4.9 NS
HDL-Cholesterol (mg/dl)
Baseline 37.4 ± 2.3 35.3 ± 2.6 NS
4 wks 38.1 ± 2.2 39.0 ± 2.1 NS
Changes 0.7 ± 1.6 3.7 ± 2.0 NS
1)
Statistical significance was calculated by independent t-test between the value of control and soybean groups.
2)
Mean ± S.E.
3)
Not Significant at α=0.05 level by an independent t-test
4)
Changes : The differences between baseline and 4wks value
Table 5. Plasma levels of TBARS and activities of erythrocyte antioxidant enzyme of the subjects after soybean supplementation
Control group Soybean group P-value
1)TBARS
2)(μg/mg protein) 27.2 ± 3.6
3)26.04 ± 7.6 NS
4)SOD
5)(unit/mg protein) 0.21 ± 0.02 0.25 ± 0.02 NS CAT
6)(unit/mg protein) 0.5 ± 0.08 4.8 ± 0.9 p<0.01 GSH-Px
7)(unit/mg protein) 0.03 ± 0.07 0.57 ± 0.1 p<0.05
1)
Statistical significance was calculated by independent t-test.
2)
TBARS : thiobarbituric acid reactive substances
3)
Mean ± S.E.
4)
Not Significant at α=0.05 level by an independent t-test
5)
SOD : superoxide dismutase activity
6)
CAT : catalase activity
7)