Introduction
According to the Student Health Examination Statistics Re- port of the Statistics Korea, the average height of elementary school students residing in Seoul, Korea was 131 cm in 1985 and increased to 136 cm in 2005 [1]. Despite such increase of the average height, the number of cases visiting growth clinics for short stature has gradually increased in Korea as the in- terests on height and socio-psychological pressure related to short stature have heightened [2]. The wide spread of percep- tion that high stature is superior probably also has contributed to the increasing growth clinic visits.
Although short stature is not a disease, individuals with general health but short stature are under physical and psy- chological stress in the modern society. Studies on the char- acteristics of short stature children reported that children with short stature had higher risk being mentally intimidated, less happy, easily frustrated, and introverted [3,4].
Growth is determined by both genetic and environmental
Clin Nutr Res 2012;1:23-29
http://dx.doi.org/10.7762/cnr.2012.1.1.23 pISSN 2287-3732 ∙ eISSN 2287-3740
Differences in Dietary Intakes between Normal and Short Stature Korean Children Visiting a Growth Clinic
Eun Mi Lee
1, Mi Jung Park
2, Hong Seok Ahn
1, Seung Min Lee
1*
1
Department of Food and Nutrition, Sungshin Women’s University, Seoul 147-732, Korea
2
Department of Pediatrics, Sanggye-Paik Hospital, Inje University School of Medicine, Seoul 139-707, Korea
This study compared birth stature, parents’ stature, and food and nutrient intakes between normal and short stature Korean children visiting a growth clinic. A total of 143 growth clinic visitors agreed to participate in the study. Out of the 143 subjects, 37 children with height below the fifth percentile (short stature group) and 58 children with height above the twenty-fifth percentile (normal group) were included in the study analysis. Data were collected through a survey of parents or guardians of children and anthropometric measurements. The ratio of short stature in either parent was significantly higher in short stature group. The mean intakes of protein, fat, calcium, and iron were lower in short stature children compared to normal children.
Among five major food groups, the intake frequency of vegetables and fruits was significantly lower in short stature group and that of meat·fish·egg·legume group was also significantly lower in short stature group. In further analysis categorized into 11 detail food groups, the intake frequency of fruit group and legume group was significantly lower in short stature group. Nu- tritional counseling should be provided to emphasize adequate intake of various food groups including vegetables, fruits, and legumes to short stature children visiting a growth clinic.
Key Words: Children, Food group intake, Growth clinic, Nutrient intake, Short stature
*Corresponding author Seung Min Lee
Address Department of Food and Nutrition, Sungshin Women’s Uni- versity, 55 Dobong-ro 76ga-gil, Gangbuk-gu, Seoul 147-732, Korea Tel +82-2-920-7671 Fax +82-2-920-2076
E-mail smlee@sungshin.ac.kr Received June 8, 2012 Revised July 7, 2012 Accepted July 9, 2012
A part of this research paper has been previously published in the first author’s master’s thesis of Sungshin Women’s University.
This is an Open Access article distributed under the terms of the Creative Commons Attribution Non-Commercial License (http://creativecommons.org/licenses/by-nc/3.0/) which permits unrestricted non-commercial use, distribution, and reproduction in any medium, provided the original work is properly cited.
© 2012 The Korean Society of Clinical Nutrition
factors, such as dietary intake, living environment, and physi- cal activities, among which the influence of genetic factors is known to be about 70-90% [5]. The influence of environ- mental factors is relatively small compared to that of genetic factors. But as environmental factors can be modified through intervention, it is the more important area to maximize the growth potential.
Nutritional management among many environmental fac- tors is the most crucial factor because it plays a key role in maintaining and synthesizing body tissues during the growth period [6]. Thibault et al. [6] observed that short stature group was nutritionally lacking compared to normal group. The in- crease of children with high stature in spite of parents’ short stature was addressed as the result of proper nutrition [7].
Food habits and preferences of a child were shown highly related to those of the child’s mother [8], and the mother’s proper eating guidance and high interest in the child’s eating at home was addressed as very necessary based on the find- ings of low desire for meal and lack of eating behaviors among short stature children [9].
Recently, various efforts are being made to increase the height in Korea due to the strong interests in stature. In the recent study of Huh & Park [10], about 33% of the study sub- jects had artificial management for increasing the height, and the most frequently used method was oriental herbal medi- cine or nutritional supplements. A variety of growth supple- ments are expensive, mostly not proved for their efficacy, and low in satisfaction after use; thus the importance of balanced nutrient intake from regular meals should be emphasized. The importance of nutritional management has been recognized in the case of growth hormone treatment which has been relatively high in the degree of satisfaction after use. Shin [2]
reported that growth hormone treatment based on accurate assessment could be helpful in the growth of children, and yet addressed importance of accompanied proper nutritional assessment and management. In addition, according to the study results of Zadik et al. [11], the nutritional management before and during the hormone treatment was found to im- prove the effect of hormone treatment. Despite increasing popularity of growth clinic visiting in Korea, there have been few domestic studies on dietary intakes among short stature children. This study compared dietary intakes between short stature children and normal children visiting a growth clinic.
Parents’ height status was also compared between short stat- ure and normal children.
Materials and Methods
Subjects
This study was conducted in children between 2-14 years of age who visited a growth clinic of a general hospital in Seoul, Korea. Parents or guardians of 143 children agreed to partici- pate in the data collection performed from June to August, 2007. On the basis of the height percentile by age reported by Korea Centers for Disease Control and Prevention and the Ko- rean Pediatrics Society [12], 37 children with height below the fifth percentile were classified into a short stature group and 58 children with height above the twenty-fifth percentile into a normal group, and a total of 95 children, thus, were included as final target subjects for this study. The study protocol was approved by the Sungshin Women’s University Institutional Review Board.
Data collection
Survey questionnaire including general characteristics and food frequency questionnaire was administered to parents or guardians of children. General characteristics included age, birth length and weight, and parent’s age, height and weight.
Subjects’ current height and weight were measured as a part of routine growth clinic diagnosis process. Body mass index (BMI) was calculated as weight in kg divided by the square of height in m for each subject. For subjects’ parents, height sta- tus was categorized into four groups, 5th percentile, 5th-10th percentile, 10th-90th percentile, and above 90th percentile, based on the height percentile values by sex and age reported by the Size Korea [13].
Dietary intakes of the subjects were investigated using food frequency questionnaire used in the Korean National Health and Nutrition Examination Surveys with minor modification.
The food frequency questionnaire consists of a total of 60 food items commonly consumed by Koreans, and the intake frequency response options for each item were divided into nine categories including three times/day, twice/day, once/day, five-six times/week, three-four times/week, once-twice/week, twice or three times/month, once/month, and almost none. For subjects of less than four years, trained dietitian asked about any usual food items which might not be included in the food frequency questionnaire and usual consumption frequency for those items.
A total of 60 food items were divided into five major food groups on the basis of nutritional and conceptual similarity.
Five food groups included grain & starch, vegetable & fruit,
meat·fish·egg·legume, milk & milk product, and fast food &
processed food. Grain & starch group included cooked rice, boiled rice and cereals, noodles, breads, cereals, rice cakes, po- tato, and sweet potato; vegetable & fruit group included white radish, bean sprouts, spinach, cucumber, mandarin orange, wa- termelon, and pear. Meat·fish·egg·legume group included beef, chicken, egg, mackerel, squid, boiled fish paste, bean curd, and beans. Milk & milk product group included milk and yogurt, and processed food group included cookies, ramen, ham, sau- sage, ice cream, and soft drinks. For more detailed description of eating behaviors, five food groups were further divided into 11 detail food groups. Grain & starch group was divided into three subgroups of rice and noodle, bread·breakfast cereal·rice cake, and potato and sweet potato; vegetable and fruit group was further divided into two subgroups of vegetable and fruit.
Meat·fish·egg·legume group was divided into three subgroups of legume, meat·egg, and fish. Kimchi in the vegetable & fruit group and salted seafood in the meat·fish·egg·legume group were combined to make a total of 11 detailed food groups. The mean daily intake frequency for each food group was generat- ed based on subjects’ intake frequency responses. For nutrient intake data, the mean daily intakes for nutrients were calcu- lated using Can-pro 3.0 (Computer Aided Nutritional analysis program for professionals, version 3.0, The Korean Nutrition Society, Seoul, Korea).
Statistical analysis
All statistical analyses were performed using SAS software program version 9.1 (SAS Institute, Cary, NC, USA), and data were described as frequency and percentage or mean and standard deviation (or error). Comparison of the distribution of parents’ short stature was conducted using chi-square test, and for the nutrient intakes and the intake frequency by food group, the mean values calibrated for age and calorie intake were calculated using generalized linear model and then the difference between two groups was verified. Verification for all statistical significances was performed at the level of p <
0.05.
Results
General characteristics
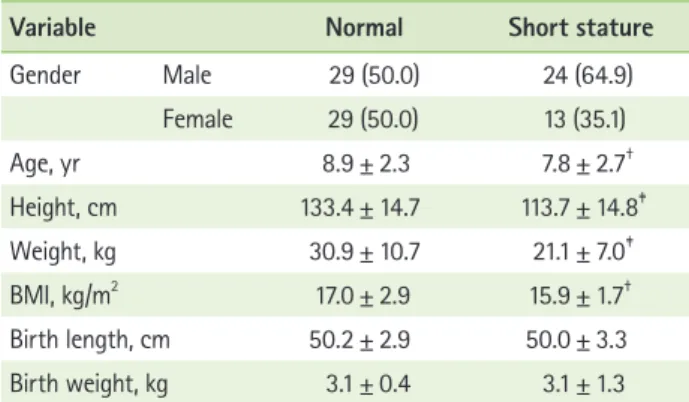
General characteristics of the subjects are shown in Table 1. The average age was 8.9 ± 2.3 years and 7.8 ± 2.7 for the normal and short stature group, respectively (p < 0.05). No
significant differences were found in gender distribution, birth weight, and birth height between the groups. But current BMI (15.9 ± 1.7 vs. 17.0 ± 2.9, p < 0.05), height 133.4 ± 14.7 vs.
113.7 ± 14.8, p < 0.001), and weight (30.9 ± 10.7 vs. 21.1 ± 7.0, p < 0.001) was significantly lower in short stature group.
Comparison of parents’ height status between normal and short stature groups
The results of comparing parents’ BMI between short stat- ure group and normal group showed that the mother’s BMI was 20.8 ± 1.9 kg/m2 in short stature group and 22.5 ± 3.5 kg/
m2 in normal group, showing significantly lower value in short stature group (p < 0.01). The father’s BMI was 24.1 ± 2.6 kg/m2 in short stature group and 23.9 ± 2.4 kg/m2 in normal group, with no significant difference between two groups (data not shown).
The ratio of parents’ short stature between short stature group and normal group was compared as shown in Figure 1.
With the short stature criterion of below 5th percentile, the proportion of short stature in either one of parents was 16.2%
in short stature group and 1.8% in normal group, showing significantly higher proportion in short stature group (p <
0.01). In addition, when the parents’ short stature criterion was below 10th percentile, the proportion of short stature in either one of parents was also significantly higher in short stature group (24.3% in short stature group vs. 5.4% in normal group, p < 0.01).
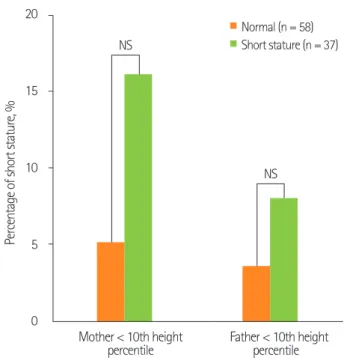
Figure 2 presents the distribution of height percentile group of each of the subjects’ parents. The proportion of mothers with height below 10th percentile tended to be lower in short stature group (16.2% in short stature group vs. 5.2% in nor-
Table 1. General characteristics of the subjects*
Variable Normal Short stature
Gender Male 29 (50.0) 24 (64.9) Female 29 (50.0) 13 (35.1)
Age, yr 8.9 ± 2.3 7.8 ± 2.7†
Height, cm 133.4 ± 14.7 113.7 ± 14.8‡
Weight, kg 30.9 ± 10.7 21.1 ± 7.0‡
BMI, kg/m2 17.0 ± 2.9 15.9 ± 1.7†
Birth length, cm 50.2 ± 2.9 50.0 ± 3.3
Birth weight, kg 3.1 ± 0.4 3.1 ± 1.3
*Values are presented as N (%) or mean ± SD; †Significantly different from normal group at a p < 0.05 level; ‡Significantly different from normal group at a p < 0.001 level.
mal group, p = 0.054), but no statistically significant difference was detected. The proportions of short stature fathers were not differed by group.
Comparison of nutrient intakes between normal and short stature groups
The mean daily nutrient intakes of the subjects are present- ed in Table 2. Among many nutrients, significant differences between two groups were observed in protein, fat, calcium, and iron intakes (p < 0.01). Protein intake was 32.9 ± 1.6 g in short stature group and 39.6 ± 1.3 g in normal group, showing significantly lower intake in short stature group compared to normal group (p < 0.01). Fat intake was 22.4 ± 1.5 g in short stature group and 28.3 ± 1.2 g in normal group, also show- ing significantly lower intake in short stature group (p < 0.01).
Children with short stature had significantly lower calcium (364.7 ± 25.7 mg in short stature group vs. 453.5 ± 20.4 mg, in normal group, p < 0.01) and iron intakes (5.6 ± 0.4 mg in short stature group vs. 7.1 ± 0.3 mg in normal group, p < 0.01).
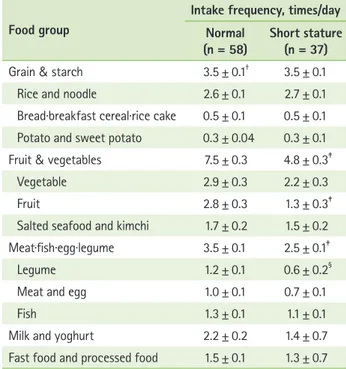
Comparison of food group intakes between normal and short stature groups
The daily food group intake frequency between short stat- ure group and normal group was compared for five food groups (Table 3). For the fruit and vegetable group, the short stature group had lower intake frequency compared to normal group (p < 0.01); for meat·fish·egg·legume, the short stature group showed significantly lower intake frequency compared to normal group (p < 0.01). No significant differences were ob- served between two groups in grain and starch, milk and milk product, and fast food and processed food.
Table 3 also shows the results of comparing food intake fre- quencies for detail food groups. When the fruit and vegetable group, in which the short stature group had lower intake frequency, was divided into the fruit group and the vegetable group, the short stature group consumed the fruit group sig- nificantly less frequently compared to normal group (p < 0.01).
When the meat·fish·egg·legume group was further divided into legume, meat and egg, and fish, only the intake frequency of legume was significantly lower in short stature group com- pared to normal group (p < 0.05). No significant differences between two groups were detected in the other detail food Normal (n = 58)
Short stature (n = 37)
*
*
Either parent < 5th height percentile
Percentage of short stature, %
30 25
20
15
10
5
0
Either parent < 10th height percentile Figure 1. Percentages of either parent less than the fifth and tenth percentile values in short and normal stature groups.
*Significance between normal and short stature group at a p
< 0.01 level.
Normal (n = 58) Short stature (n = 37)
NS NS
Mother < 10th height percentile
Percentage of short stature, %
20
15
10
5
0
Father < 10th height percentile Figure 2. Percentages of short stature mothers and fathers less than the tenth percentile values in short and normal stature groups. NS: no significant difference between normal and short stature group.
groups.
Discussion
It has been reported that about 75% of cases with short stature during childhood ended up as adults with more than 12 cm shorter stature compared to the reference group, dem- onstrating the stature in childhood is closely related to the final stature in adulthood [14,15]. In addition, interest on height has amplified as external beauty is greatly emphasized in the modern society due to the development of media and wide- spread perception that long stature is superior. In recent days, thus, the number of cases visiting the growth clinic for short stature has gradually increased in Korea, but systematic look
into dietary characteristics in children with height concern has been limited. Thus, this study aimed to examine dietary intakes of children visiting a growth clinic and to compare the differ- ences between short stature children and normal children.
The distribution of parents’ stature status was compared between normal group and short stature group to examine the relationship with parents’ stature. Consistent with report from a prospective twin study [5], our study findings also sup- port the important role of genetic factor on children’s height.
Most parents of the short stature group were significantly short. Stratified analysis by each parent suggests somewhat stronger relation of the mother’s height with the child’s height than that of the father’s height with the child’s height.
Such relationship between the child’s short stature and the mother’s stature has also been observed in previous studies.
Ferreira et al. [16] reported in their recent study that children born from short stature mothers had lower birth weight and undergrowth when the mother’s short stature standard was below the 1st percentile. Also, Hernandez-Diaz et al. [17] ob- served 4,663 Mexican children under 5 years of age and their mothers, and the probability of short stature children from short stature mothers was significantly higher. The authors, however, also noted that environmental factors probably had also played some role in such relationship in consideration of Table 2. Nutrient intakes of the subjects*
Nutrients Normal
(n = 58) Short stature (n = 37) Energy, kcal 1089.0 ± 40.5† 995.5 ± 50.9
Protein, g 39.6 ± 1.3‡ 32.9 ± 1.6§
Fat, g 28.3 ± 1.2 22.4 ± 1.5§
Carbohydrate, g 170.0 ± 1.7 171.6 ± 2.1
Fiber, g 11.0 ± ± 0.4 10.0 ± 0.5
Ash, g 9.8 ± 0.3 9.2 ± 0.3
Calcium, mg 453.5 ± 20.4 364.7 ± 25.7§ Phosphorus, mg 638.1 ± 12.8 615.0 ± 16.0
Iron, mg 7.1 ± 0.3 5.6 ± 0.4§
Sodium, mg 1758.7 ± 59.9 1715.0 ± 75.6 Potassium, mg 1688.1 ± 49.8 1571.0 ± 62.8
Zinc, mg 5.2 ± 0.1 5.1 ± 0.1
Vitamin A, μg RE 387.8 ± 26.7 355.2 ± 33.7
Retinol, μg 111.1 ± 5.2 104.9 ± 6.5
ß-carotein, μg 1522.0 ± 152.2 1364.3 ± 192.1 Vitamin B1, mg 0.6 ± 0.01 0.6 ± 0.02 Vitamin B2, mg 0.7 ± 0.02 0.7 ± 0.03
Vitamin B6, mg 0.9 ± 0.02 0.8 ± 0.03
Niacin, mg 7.3 ± 0.2 7.2 ± 0.2
Vitamin C, mg 71.7 ± 6.1 66.0 ± 7.7
Folic acid, μg 154.9 ± 6.0 144.7 ± 7.6
Vitamin E, mg 6.0 ± 0.3 5.8 ± 0.4
Cholesterol, mg 155.8 ± 7.1 147.3 ± 8.9
*Values are presented as mean ± SE; †Adjusted for age; ‡Adjusted for age and energy intake; §Significantly different from normal group at a p < 0.01 level.
Table 3. Intake frequency of food groups in the subjects* Food group
Intake frequency, times/day Normal
(n = 58) Short stature (n = 37) Grain & starch 3.5 ± 0.1† 3.5 ± 0.1 Rice and noodle 2.6 ± 0.1 2.7 ± 0.1 Bread·breakfast cereal·rice cake 0.5 ± 0.1 0.5 ± 0.1 Potato and sweet potato 0.3 ± 0.04 0.3 ± 0.1 Fruit & vegetables 7.5 ± 0.3 4.8 ± 0.3‡
Vegetable 2.9 ± 0.3 2.2 ± 0.3
Fruit 2.8 ± 0.3 1.3 ± 0.3‡
Salted seafood and kimchi 1.7 ± 0.2 1.5 ± 0.2 Meat·fish·egg·legume 3.5 ± 0.1 2.5 ± 0.1‡
Legume 1.2 ± 0.1 0.6 ± 0.2§
Meat and egg 1.0 ± 0.1 0.7 ± 0.1
Fish 1.3 ± 0.1 1.1 ± 0.1
Milk and yoghurt 2.2 ± 0.2 1.4 ± 0.7 Fast food and processed food 1.5 ± 0.1 1.3 ± 0.7
*Values are presented as mean ± SE; †Adjusted for age and energy intake;
‡Significantly different from normal group at a p < 0.01 level; §Significantly different from normal group at a p < 0.05 level.
the many shared life conditions between mother and child.
But these previous studies did not examine the association with father’s stature, limiting further exploration into relative importance between the mother’s height and father’s height in the child’s height status. The current study is, thus, mean- ingful, in terms of examining relation of both parents’ height status with child’s height and provides an interesting study topic for future research.
The study findings showed that the intakes of protein, fat, calcium, and iron were significantly lower in short stature group. Lower protein intake among short stature children is in line with the report that nutritional deficiency accompanied many short stature children due to lack of protein intake [2].
Calcium is the most abundant mineral in the body and essen- tial in the formation and maintenance of the bone and teeth;
if it is deficient for a long period of time, in case of children, not only short stature but also attention deficit hyperactiv- ity can be developed [18]. Also, Black et al. [19] reported that children with very low calcium intake had shorter stature and higher ratio of body fat. However, current study finding showed somewhat but significantly less BMI in short stature group in contrast to Black et al.’s report of positive relation between body fat composition and short stature. This discrep- ancy may be explained by differences in other dietary aspects and measurement difference between % body fat and BMI.
Iron intake was 5.6 ± 0.4 mg/day in short stature group and 7.1
± 0.3 mg/day in normal group. While the normal group’s iron intake level was similar with the results from Choi & Yoon’s study [8] based on 166 generally healthy preschool children, that of short group appears lower. These findings suggest that dietary education for short stature children can include practi- cal information to improve intake of food sources for protein, calcium, and iron. Considering kinds and amount of foods available to a child are often under parents’ control, such di- etary education with focus on parent and food environments at home would be more effective.
In this study, the intake frequency for several food groups was examined to understand the difference of dietary intake between normal group and short stature group in relation to more specific eating behaviors. The comparison, by dividing into a total of five food groups, showed that the intake fre- quency in fruit and vegetable group and meat·fish·egg·legume group was significantly lower in short stature group. In com- parison, using the more detailed 11 food groups, the short stature group had significantly lower intakes particularly
in fruit group and bean legume group compared to normal group. Interpreting this result in conjunction with the find- ings from nutrient intake comparison, short stature group’s lower calcium and protein intake is probably attributed to less consumption of legume group. It is thought that short stature children obtained less calcium and protein not of animal food sources but of plant food sources. Less consumption of fat and iron in short stature group, though, is not clearly reflected on the food group consumption differences. Vegetables and fruits play an important role in the intake of dietary fiber as well as various micro nutrients necessary for growth [8]. The legume group does not produce acids in the body and can exert positive effect in bone metabolism, and also contains abundant isoflavones that protect bone through the bone metabolism including osteolysis and osteogenesis, to help height growth in children [20]. The study findings suggest a few food groups requiring special attention with regard to di- etary counseling toward short stature Korean children. Further understanding of fundamental causes for low consumption of these food groups will help formulate specific dietary mes- sages. Current routine clinical service for those visiting growth clinics does not usually include dietary counseling in Korean despite the clear fact that proper diet is an important axis in achieving healthy growth. It is recommended that cooperative clinical service system between growth clinic and nutrition service team needs to be established for accurate assessment and timely treatment of any dietary problems among children with height concerns.
It should be noted that the current study possesses a few limitations. First, the small number of study subjects and sampling among visitors to a growth clinic makes it difficult to generalize the study findings or to draw a firm conclusion based on the results. Second, the possibility of errors in sub- jects’ birth body sizes and parents’ body sizes exists because they were not directly measured but self-reported.
References
1. Korean Statistical Information Service: Student Health Examina- tion Statistics Report. Available from http://kosis.kr/nsportal/abroad/
abroad_01List.jsp. [cited 2011 Dec 10]. 2005
2. Shin JH. Evaluation of short stature and Growth Hormone Treatment. J Korean Acad Fam Med 1993;14:97-112.
3. Fernald LC, Grantham-McGregor SM. Growth Retardation is associated with changes in the stress response system and behavior in school- aged jamaican children. J Nutr 2002;132:3674-9.
4. Silventoinen K, Sammalisto S, Perola M, Boomsma DI, Cornes BK, Davis C, Dunkel L, De Lange M, Harris JR, Hjelmborg JV, Luciano M, Martin NG, Mortensen J, Nisticò L, Pedersen NL, Skytthe A, Spector TD, Stazi MA, Willemsen G, Kaprio J. Heritability of adult body height: a compar- ative study of twin cohorts in eight countries. Twin Res 2003;6:399- 408.
5. Hammond GK, Barr SI, McCargar LJ. Teacher’s perception and use of an innovative early childhood nutrition education program. J Nutr Educ 1994;26:233-7.
6. Thibault H, Souberbielle JC, Taieb C, Brauner R. Idiopathic prepuber- tal short stature is associated with low body mass index. Horm Res 1993;40:136-40.
7. Lee KH. Growth assessment and diagnosis of growth disorders in child- hood. J Korean Pediatr Soc 2003;46:1171-7.
8. Choi MJ, Yoon JS. The effect of eating habits and nutrient intake on the physical growth indices in preschool children. Korean J Community Nutr 2003;8:3-14.
9. Wudy SA, Hagemann S, Dempfle A, Ringler G, Blum WF, Berthold LD, Alzen G, Gortner L, Hebebrand J. Children with idiopathic short stat- ure are poor eaters and have decreased body mass index. Pediatrics 2005;116:e52-7.
10. Huh K, Park MJ. Questionnaire-based analysis of growth-promoting attempts among children visiting a university growth chlinic. Korean J Pediatr 2009;52:576-80.
11. Zadik Z, Sinai T, Zung A, Reifen R. Effect of nutrition on growth in short stature before and during growth-hormone therapy. Pediatrics 2005;116:68-72.
12. Korea Centers for Disease Control and Prevention, the Korean Pediatric
Society. 2007 Children and Adolescent Growth Chart Report. Seoul:
Seoul Press; 2009.
13. Size Korea. Report on the 5th Korean Body Size Examination. Available from http://sizekorea.kats.go.kr/ [cited 2009 Dec 10]. 2004
14. Hermanussen M, Sunder M, Voigt M, Tresguerres JA. Morbid obesity is associated with short stature. J Pediatr Endocrinol Metab 2005;18:647- 50.
15. Mendez MA, Adair LS. Severity and timing of stunting in the first two years of life affect performance on cognitive tests in late childhood. J Nutr 1999;129:1555-62.
16. Ferreira HS, Moura FA, Cabral CR Jr, Florêncio TM, Vieira RC, de Assun- ção ML. Short stature of mothers from an area endemic for undernu- trition is associated with obesity, hypertension and stunted children: a population-based study in the semi-arid region of Alagoas, Northeast Brazil. Br J Nutr 2009;101:1239-45.
17. Hernandez-Diaz S, Peterson KE, Dixit S, Hernández B, Parra S, Barquera S, Sepúlveda J, Rivera JA. Association of maternal short stature with stunting in Mexican children: common genes vs common environment.
Eur J Clin Nutr 1999;53:938-45.
18. Lee SS. The important function of calcium in relation to children’s growth. J Korean Diet Assoc 1999;5:238-42.
19. Black RE, Williams SM, Jones LE, Goulding A. Children who avoid drink- ing cow milk have low dietary calcium intakes and poor bone health.
Am J Clin Nutr 2002;76:675-80.
20. Bae YJ, Sung CJ. A comparison between postmenopausal osteoporotic women and normal women of their nutrient intakes and the evaluation of diet quality. Korean J Community Nutr 2005;10:205-15.