212 https://doi.org/10.9713/kcer.2018.56.2.212
PISSN 0304-128X, EISSN 2233-9558
A Study on Process Safety Incident Precursors to Prevent Major Process Safety Incidents in the Yeosu Chemical Complex
Seung-Hyun Baek*,***, Hyuck-Myun Kwon** and Hun-Soo Byun***,†
*SHE Team Leader, K. R. Copolymer (KRCC), Yeosu, Jeonnam 59613, Korea
**Department of Chemical and Biomolecular Engineering, Yonsei University, 50, Yonsei-ro, Seodaemun-gu, Seoul, 03722, Korea
***Department of Chemical and Biomolecular Engineering, Chonnam National University, 50, Daehak-ro, Yeosu, Jeonnam, 59626, Korea (Received 7 September 2017; Received in revised form 7 November 2017; accepted 7 November 2017)
Abstract − Process safety incidents and loss events can be prevented if we identify and adequately take measures on process safety incident precursors in a timely manner. If we look into and take action against the process safety hazard factors causing the incident in the refinery and petrochemical plant, major process safety incidents can be prevented through eliminating or decreasing hazardous factors. We conducted a survey for the major process safety incident pre- cursor to look specifically into the potential process safety hazardous factors of refineries and petrochemical plants in the Yeosu chemical complex. A self-assessment checklist, which was published by Center for Chemical Process Safety
“Recognizing catastrophic incident warning signs in the process industry” on major incidents warning sign, was used for the survey. Through this survey, the major process safety incident leading indicators in the process industry were found by process safety management elements, and each site and/or facility can use these leading indicators for activities for process safety incident prevention. In addition, we proposed action items required to eliminate the root cause of those process safety incident leading indicators.
Key words: Process Safety, Major Incidents, Warning Signs
1. Introduction
Process safety incident precursors are early indicators that some- thing is wrong or about to go wrong [1]. The process safety incidents and/or loss events can be prevented, if we identify and take mea- sures adequately in a timely manner. If there are no apparent conse- quences from the problems during chemical plant operation and maintenance activities, we get use to those new practices and substi- tute the original practices [2,3]. If we look into and take action for the process safety hazardous factors causing the incident in the refinery and petrochemical plant, and then eliminate or reduce the hazard fac- tors, the major process safety incident can be prevented. The pur- pose of survey is to find and ascertain exactly the potential hazard factors in the refinery and chemical plant, and then take action appro- priately to prevent and control the incident. By this survey, we find the potential hazards factors by process safety management elements in the Yeosu Chemical Complex; especially, we find that there are some rooms for improvement in the process safety management. For safety culture element, leadership and culture are the foundation of safety management. In particular, managers establish an unaccept- able culture if production rate has been increased but ignore or skip the standard procedures [4]. “Audit” element that leads to safety man-
agement system also shows a second lower score, followed by “safety culture” element, so preparation and implementation of a systematic and effective safety audit system is required [5,6]. In particular, the more serious problem is that the same corrective action item is con- stantly reoccurring in process safety management audits. It is required to be used for measurement and metrics in the tracking process [7,8].
There is a need to reduce the gap between asset integrity and& reli- ability and safety culture that does not show immediate results, but is the foundation of safety management through the balanced invest- ment of workforce and capital. In the process industry, recently, man- power has been decreasing along with significant changes in processes and technologies [9]. This can provide an excuse to justify actions that ignore or skip the following standard procedures. It is required a justification for the decrease of manpower, and then to add man- power or redistribute work, and to establish and implement efficient manpower management and education plan [10]. It is surveyed that process safety management is being done because it is a legal require- ment, not safety management for accident prevention, worker safety and life protection. Therefore, improving the sense of purpose and philosophy for safety of management is of paramount importance. It is recognized generally that an occupational safety near-miss should be controlled. To prevent serious industrial accidents, the process safety near-miss, process deviations, should be also investigated and managed in the same way as occupational safety near-miss [7]. It is necessary to establish and implement systems that identifies and control the process safety near-miss.
†To whom correspondence should be addressed.
E-mail: [email protected]
This is an Open-Access article distributed under the terms of the Creative Com- mons Attribution Non-Commercial License (http://creativecommons.org/licenses/by- nc/3.0) which permits unrestricted non-commercial use, distribution, and reproduc- tion in any medium, provided the original work is properly cited.
2. Outlines of Survey and Statistics of Respondent
2-1. Outline of survey
The Center for Chemical Process Safety analyzed and investi- gated the accidents that have occurred in the process industry, and then collected and organized the hazard factors that caused the acci- dents and issued a book, “Recognizing catastrophic incident warn- ing signs in the process industry.” The major incident warning signs and checklists presented in this book were used in the survey to iden- tify major incident warning signs in the Yeosu Chemical Complex.
The questionnaire consisted of nine elements: “Leadership and cul- ture,” “Training and competency,” “Process safety information,” “Pro- cedures,” “Asset integrity,” “Analyzing risk and managing change,”
“Audits,” “Learning from experience,” and “Physical warning signs.”
The questionnaire consisted of 161 questions, and for each question five examples were given and designated from 1 to 5 points: 1-strongly agree/ 2-agree / 3-neutral/ 4-disagree/ 5-strongly disagree.
The survey was conducted from December 10 to 25th, 2015. A total of 71 questionnaires were received from 23 oil refinery and pet- rochemical companies’ employees in Yeosu Chemical Complex.
2-2. Statistics of respondent
As shown in Tables 1 and 2 and Figures 1 and 2, the work areas of survey respondents are 49% in production department and 34% in safety department, accounting for 83% of all respondents, and work- ers who have experienced more than 11 years accounted for 61%, a dominant part.
3. Results and Analysis of Survey
3-1. Results of survey by each element
3-1-1. Survey results of catastrophic incident warning signs by department
The scores for each of the nine major incident hazards elements are shown in Table 3, and the “Leadership and culture” element is the lowest at 3.65 points, followed by the “Audits” element at 3.83 points with low score. The “Asset integrity” element showed the highest score of 4.03 points, followed by the “Learning from experi- ence” element of 4.02 points. The difference between the highest score of “Asset integrity” and the lowest score of “Leadership and cul- ture” is about 8% (0.38 points).
As shown in Table 3 and Fig. 3, in all elements, the production
department scores higher than the safety department. This is judged to be the result of the difference in perspective. In general, produc- tion department workers tend to judge that safety management and implementation are well performed from the viewpoint of the appraiser.
In contrast, safety department workers seek to find what improve- ments should be made to process safety management from the per- spective of the evaluator. The element with the greatest score difference between the production and safety departments are the “Process safety information”, which is 0.22 points (about 4.4%).
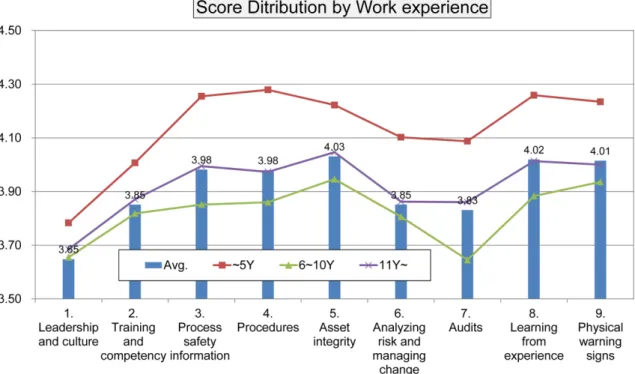
3-1-2. Survey results of catastrophic incidents warning signs by work experience
Table 4 and Fig. 4 show that the scores of middle-work experience
Table 1. Respondents for catastrophic incident warning signs survey by department
Department Prod. Safety Maintenance Others No answer Total
No. of respondents 35 24 2 2 8 71
Ratio (%) 49.30 33.80 2.82 2.82 11.27 100
Table 2. Work experience of respondents for catastrophic incident warning signs survey
Work experience 1~5 Y 6~10 Y 11 Y~ No answer Total
No. of respondents 8 11 43 9 71
Ratio (%) 11.27 15.49 60.56 12.68 100
Fig. 1. Respondents for catastrophic incident warning signs survey by department.
Fig. 2. Work experience of respondents for catastrophic incident warning signs survey.
employees with a career of 6-10 years are relatively low compared to other work experience groups. This means that workers with 6-10
years of experience are the most actively involved in on-site safety management activities and they are objectively and critically judg- Table 3. Survey results for catastrophic incident warning signs by department
Elements No. of questions Avg. Department
Prod. Safety
1. Leadership and culture 29 3.65 3.76 3.56
2. Training and competency 18 3.85 3.99 3.77
3. Process safety information 12 3.98 4.12 3.90
4. Procedures 13 3.98 4.09 3.89
5. Asset integrity 27 4.03 4.14 3.95
6. Analyzing risk and managing change 22 3.85 3.95 3.83
7. Audits 10 3.83 3.97 3.82
8. Learning from experience 14 4.02 4.14 3.93
9. Physical warning signs 16 4.01 4.08 3.96
Total or Average 161 3.91 4.03 3.85
※Basis of Score
1-strongly agree/ 2-agree/ 3-neutral/ 2-disagree /1-strongly disagree
Fig. 3. Survey results for catastrophic incident warning signs by department.
Table 4. Survey results for catastrophic incident warning signs by work experience
Elements No. of questions Avg. Work experience
~5Y 6~10Y 11Y~
1. Leadership and culture 29 3.65 3.78 3.66 3.68
2. Training and competency 18 3.85 4.01 3.82 3.87
3. Process safety information 12 3.98 4.25 3.85 3.99
4. Procedures 13 3.98 4.28 3.86 3.97
5. Asset integrity 27 4.03 4.22 3.95 4.05
6. Analyzing risk and managing change 22 3.85 4.10 3.81 3.86
7. Audits 10 3.83 4.09 3.65 3.86
8. Learning from experience 14 4.02 4.26 3.88 4.01
9. Physical warning signs 16 4.01 4.23 3.94 4.00
Total or Average 161 3.91 4.14 3.82 3.92
※Basis of Score
1-strongly agree/ 2-agree/ 3-neutral/ 4-disagree/ 5-strongly disagree
ing on-site process operation situation and phenomena. In general, there are stereotypes in the judgment of workers who have consider- able experience in the Yeosu Petrochemical Complex. They have a tendency to judge that everything is going well with no problems.
The result of the survey can be interpreted as reflecting this phenom- enon.
3-2. Strength and weakness for each question of each element for catastrophic incident warning signs
3-2-1. Leadership and culture
The “Leadership and culture” element is 3.65 points, which is the lowest score among the nine hazard elements. Similar results were obtained regardless of the safety department, production department and career. As shown in Table 5, “Everyone is too busy” in the “Lead- ership and culture” element is the most hazardous warning sign with
a response score of 2.73 points. “Leaders obviously value activity- based behavior over outcome-based behavior,” in other words, man- agers are more focused on results than procedure, is 3.15 points. The third, “Conflict between production goals and safety goals” is 3.25 points. The fourth, “Conflict between workers and management about working conditions” is 3.36 points, “Signs of worker fatigue” is 3.39 points. “A high absenteeism rate,” “Operating outside the safe oper- ating envelope is accepted,” and “An employee turnover issue exists”
are surveyed with relatively low hazard warning signs. In particular, the production department responds that there is no problem with the turnover rate, but the safety department responds that there are numer- ous problems (1-27: An employee turnover issue exists). The pro- duction department responds that there is a conflict between the manager and the employee on working conditions, but the safety department responds that there is relatively little conflict (1-19: Conflict between Fig. 4. Survey results for catastrophic incident warning signs by work experience.
Table 5. Survey results for leadership & culture element
Questionnaire on Leadership and culture Score Rank
The five top catastrophic incident warning signs
1-17. Everyone is too busy 2.73 29
1-20. Leaders obviously value activity-based behavior over outcome-based behavior 3.15 28
1-7. Conflict between production goals and safety goals 3.25 27
1-19. Conflict between workers and management concerning working conditions 3.36 26
1-7. Signs of worker fatigue 3.39 25
The bottom six catastrophic incident warning signs
1-26. A high absenteeism rate 4.39 1
1-1. Operating outside the safe operating envelope is accepted 4.17 2
1-29. Frequent changes in ownership 4.07 3
1-27. An employee turnover issue exists 3.92 4
1-3. Negative external complaints 3.89 5
1-2. Job roles and responsibilities not well defined, confusing, or unclear 3.89 5
workers and management concerning working conditions). This suggests that there is a conflict on work environment between the manager and the worker in the production department, and that there is a need for systems and activities to resolve such conflicts. In the
“Leadership and culture” element, identifying and solving the rea- sons why workers feel busy is the most urgent issue for preventing major accidents. In addition, the survey confirms that a manager’s behavior is more focused on production than safety. While manager attitudes may actually prioritize the execution process over results, but it is surveyed that workers recognize that managers prefer out- comes rather than procedure observance. Therefore, the prevention of serious accidents can be a difficult task, if management and man- agers do not have clear view that safety is a top priority and put into practice, and do not gain the trust from the workers.
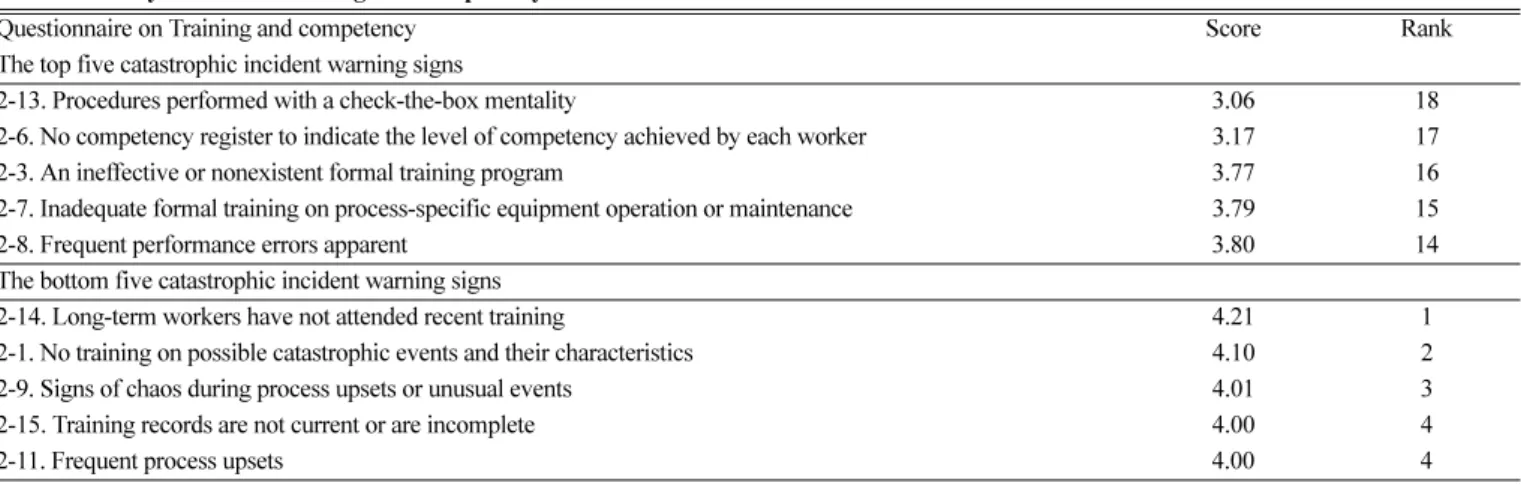
3-2-2. Training and competency
Regardless of the production or safety departments, similar sur- vey results are shown. As shown in Table 6, the lowest score is 3.06 points for “Procedures with a check-the-box mentality.” “No compe- tency register to indicate the level of competency achieved by each worker” is 3.17 points. “An ineffective or nonexistent formal train- ing program” is 3.77 points. “Inadequate formal training on process- specific equipment operation or maintenance” is 3.79 points. “Frequent performance errors apparent” is 3.80 points. As the result of the sur- vey, the contents of each procedure are not detailed, so it is impossi- ble to carry out the work while confirming the procedure in detail;
the competent registration of the worker is often not prepared, educa- tion programs are ineffective, education to the worker on process- specific equipment operation or maintenance is lack and errors fre- quently occur in the performance of workers. The results of the sur- vey show that it is necessary to have a clear understanding of the purpose of the preparation and use of the procedure. It can be con- cluded that it is necessary to provide specific criteria for the writing of the procedure, and prepare the procedure in accordance with the guideline for writing procedure so as to prevent workers’ errors. On the other hand, it is surveyed that workers are all attending the safety training without exception, their ability to cope with abnormal pro-
cess situations is good and abnormal situations are less frequent. The safety department responds the “Frequent process upsets (2-11)” as the most hazardous factor; on the contrary, the production depart- ment disagrees with this opinion. This means that there is a differ- ence between two teams in the perception of the concept of hazards, and implies that the concept of safe operating limits as well as risks and deviations used in the process hazards assessment are different as well. The process hazards assessment should be carried out by the process operation department, and the safety department should pro- vide only the standards and guidelines for process hazard analysis, but it can be assumed that the safety team is leading the process haz- ards assessment as an owner, and the operation department cooper- ates on it as an onlooker.
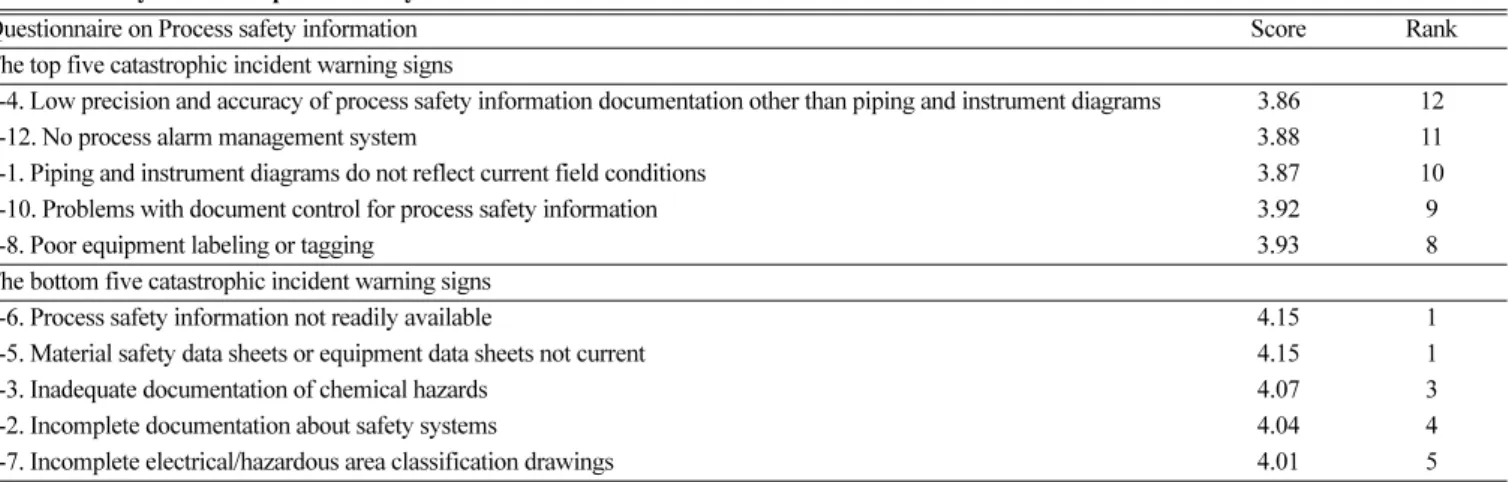
3-2-3. Process safety information
As shown in Table 7, “Low precision and accuracy of process safety information documentation other than piping and instrument diagrams” is 3.86 points which is the lowest score, “No process alarm management system” is 3.88 points, “Piping and instrument diagrams do not reflect current field conditions” is 3.87 points, “Problems with document control for process safety information” is 3.92 points and
“Poor equipment labeling or tagging” is 3.93 points. As a hazard fac- tor for “Process Safety Information” element, it is surveyed that there is a lot of problems in data management on P & ID which is the basis of process safety information. In particular, the warning signs of
“Piping and instrument diagrams do not reflect current field condi- tions (3-1)” and “Problems with document control for process safety information (3-10)” indicate that the operating information that each operator knows may be different from each other. If an abnormal process situation or emergency situation occurs, the operator who has little experience on process operation may be particularly vulner- able to the possibility of miss-operation. It can be said that it is neces- sary to introduce an Alarm Management System, that manages the alarms based on frequency of happening and importance of conse- quence, applied to the companies in developed country. A question- naire with the opposite opinion of production and safety departments is “Piping and instrument diagrams do not reflect current field condi-
Table 6. Survey results for training and competency element
Questionnaire on Training and competency Score Rank
The top five catastrophic incident warning signs
2-13. Procedures performed with a check-the-box mentality 3.06 18
2-6. No competency register to indicate the level of competency achieved by each worker 3.17 17
2-3. An ineffective or nonexistent formal training program 3.77 16
2-7. Inadequate formal training on process-specific equipment operation or maintenance 3.79 15
2-8. Frequent performance errors apparent 3.80 14
The bottom five catastrophic incident warning signs
2-14. Long-term workers have not attended recent training 4.21 1
2-1. No training on possible catastrophic events and their characteristics 4.10 2
2-9. Signs of chaos during process upsets or unusual events 4.01 3
2-15. Training records are not current or are incomplete 4.00 4
2-11. Frequent process upsets 4.00 4
tions (3-1),” where the safety department believes there are many problems and the production department reports no problems. It is understood that first, it is required to understand and agree on the management standards of piping and instrumentation drawing (P &
ID) between the safety and operation departments, and then it is the second-most important thing to eliminate the difference of under- standing.
3-2-4. Procedures
For the “Procedures” elements, as shown in Table 8, “No system to gauge whether procedures have been followed” is the lowest score of 3.75 points, “No system for determining which activities needed written procedures” is 3.79 points, “Chronic problems with the work permit system” is 3.82 points, “Inadequate shift turnover communi- cation” is 3.96 points, and “Procedures do not address all equipment required” is 4.00 points, those are recognized important incident warning signs. From these results, we can see that it does not empha- size the importance of the using of written procedure. In the end, a procedural management system is in place, but the content of the prepared procedure can be said to be inadequate for use. “Operators appear unfamiliar with procedures or how to use them(4-3),” which shows a great disagreement between the safety and operation depart- ments, is positive in the operation departments, but negative in the
safety departments. In the case of “No established administrative proce- dure and style guide for writing and revising procedures (4-13),” the operation department has a negative opinion and the safety depart- ment has a positive opinion. It is necessary to provide continuing education for the operators in order to fully understand the require- ments for using the operation procedures, and it is required to make the guidelines for the writing operation and maintenance procedures more clear and easy to use. It is especially helpful to refer to “Guide- lines for writing effective operating & maintenance procedures”
published by Chemical Process Safety.
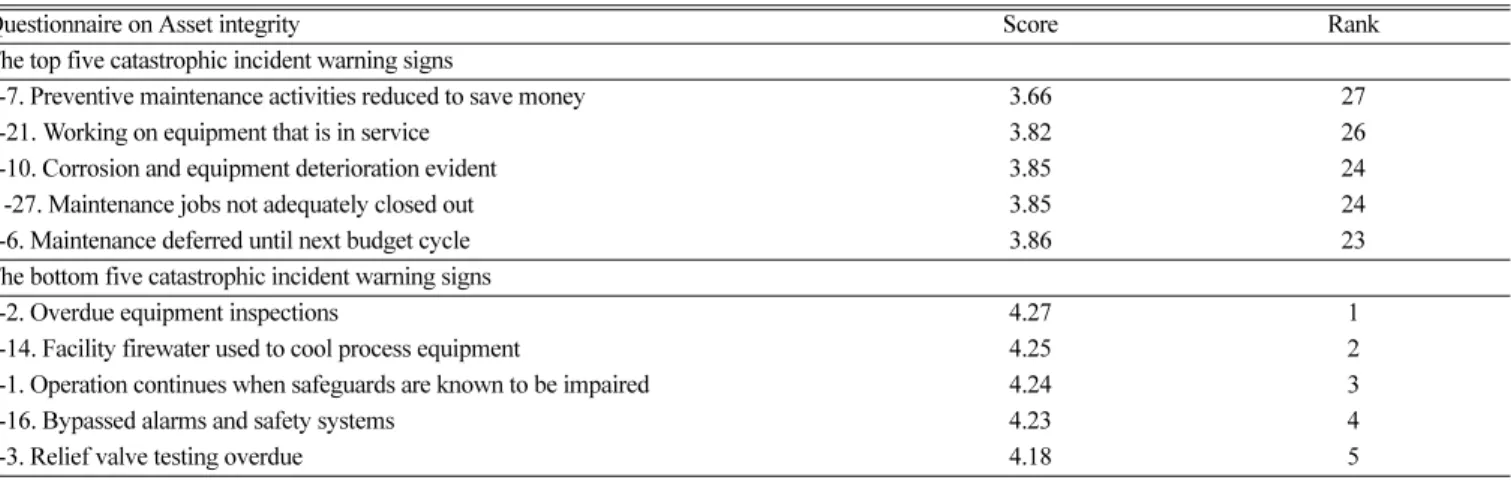
3-2-5. Asset integrity
For “Asset integrity” element, as shown in Table 9, “Preventive maintenance activities reduced to save money” is the lowest score of 3.66 points. “Working on equipment that is in service” is 3.82 points.
“Corrosion and equipment deterioration evident” and “Maintenance jobs not adequately closed out” are 3.85 points. “Maintenance deferred until next budget cycle” is 3.86 points. Those are surveyed as major hazards warning signs. It is important to note that in order to reduce costs, preventive maintenance work is reduced. In addition to the cost aspect of preventive maintenance, risk assessment should be carried out to determine the priority of preventive maintenance work according to the level of risk, and it is necessary for management and Table 7. Survey results for process safety information element
Questionnaire on Process safety information Score Rank
The top five catastrophic incident warning signs
3-4. Low precision and accuracy of process safety information documentation other than piping and instrument diagrams 3.86 12
3-12. No process alarm management system 3.88 11
3-1. Piping and instrument diagrams do not reflect current field conditions 3.87 10
3-10. Problems with document control for process safety information 3.92 9
3-8. Poor equipment labeling or tagging 3.93 8
The bottom five catastrophic incident warning signs
3-6. Process safety information not readily available 4.15 1
3-5. Material safety data sheets or equipment data sheets not current 4.15 1
3-3. Inadequate documentation of chemical hazards 4.07 3
3-2. Incomplete documentation about safety systems 4.04 4
3-7. Incomplete electrical/hazardous area classification drawings 4.01 5
Table 8. Survey results for procedures element
Questionnaire on Procedures Score Rank
The top five catastrophic incident warning signs
4-5. No system to gauge whether procedures have been followed 3.75 13
4-12. No system for determining which activities need written Procedures 3.79 12
4-10. Chronic problems with the work permit system 3.82 11
4-7. Inadequate shift turnover communication 3.96 10
4-1. Procedures do not address all equipment required 4.00 9
The bottom five catastrophic incident warning signs
4-9. Failure to follow company procedures is tolerated 4.20 1
4-2. Procedures do not maintain a safe operating envelope 4.10 2
4-8. Poor-quality shift logs 4.06 3
4-6. Facility access procedures not consistently applied or enforced 4.03 4
4-3. Operators appear unfamiliar with procedures or how to use them 4.01 5
managers as well as general workers to fully understand these basic concepts. The safety department and operation department show the opposite opinion for “Facility firewater used to cool process equip- ment (5-14).” If fire water is used instead of cooling water, it may cause another risk in terms of mechanical integrity such as corro- sion. In addition, the safety department and the operation depart- ment also show the opposite response on “Working on equipment that is in service (5-21).” It can be said that the definition of process operation is different between the safety department and the opera- tion department. However, the repair work in the operating facility requires sufficient work risk assessment to be carried out in advance in order to prevent the accident. It is necessary to change the mainte- nance work schedule from normal operation to the turn-around period.
Examples of accidents in which a fire or explosion occurred due to a serious leak while performing repair work in the operating process show what it is.
3-2-6. Analyzing risk and managing change
As shown in Table 10, in the questionnaire response to the “Ana- lyzing risk and management of change” element, “Organizational changes not subjected to management of change” is 3.18 points which is the lowest score. “Weak process hazard analysis practices”
is 3.62 points. “A sense that we always do it this way!” is 3.68 points.
“Management of change item review and approval lack structure and rigor” is 3.76 points. “Excessive delay in closing management of change action items to completion” is 3.80 points. Those are important haz- ard warning signs. In an advanced country, organizational manage- ment, that is personnel management, is included in the requirements for “Management of change” as facility change. However, it is sur- veyed that it is not included in Korea yet. It is also an urgent task to include staff change related to process safety in the “Management of change.” It is also surveyed that the process hazards analysis and management of change are perfunctory carried out, and the comple- tion of action items for management of change being delaying. Par- ticularly, in the case of “Risk assessments conducted to support decisions already made (6-9),” the operation and safety department show the opposite opinion result and the safety department responded that the risk is very high. “Poor process hazard analysis action item follow- up (6-3),” on the contrary, is considered to be a very hazardous warn- ing sign in the operation department. In the end, it is considered that the risk assessment is in line with perfunctory proceedings to meet legal requirements, and most workers, especially the operation depart- ment operators including management, do not fully understand the purpose and use of risk assessment. Therefore, it is understood that first, the basic education about the purpose and the application of the risk assessment should be conducted for their understanding and Table 9. Survey results for asset integrity element
Questionnaire on Asset integrity Score Rank
The top five catastrophic incident warning signs
5-7. Preventive maintenance activities reduced to save money 3.66 27
5-21. Working on equipment that is in service 3.82 26
5-10. Corrosion and equipment deterioration evident 3.85 24
5 -27. Maintenance jobs not adequately closed out 3.85 24
5-6. Maintenance deferred until next budget cycle 3.86 23
The bottom five catastrophic incident warning signs
5-2. Overdue equipment inspections 4.27 1
5-14. Facility firewater used to cool process equipment 4.25 2
5-1. Operation continues when safeguards are known to be impaired 4.24 3
5-16. Bypassed alarms and safety systems 4.23 4
5-3. Relief valve testing overdue 4.18 5
Table 10. Survey results for analyzing risk and managing change element
Questionnaire on Analyzing risk and managing change Score Rank
The top five catastrophic incident warning signs
6-7. Organizational changes not subjected to management of change 3.18 22
6-1. Weak process hazard analysis practices 3.62 21
6-10. A sense that we always do it this way! 3.68 20
6-12. Management of change item review and approval lack structure and rigor 3.76 19
6-6. Excessive delay in closing management of change action items to completion 3.80 18
The bottom five catastrophic incident warning signs
6-18. Instruments bypassed without adequate management of change 4.15 1
6-2. Out-of-service emergency standby systems 4.10 2
6-19. Little or no corporate guidance on acceptable risk ranking methods 4.06 3
6-13. Failure to recognize operational deviations and initiate management of change 4.06 4
6-15. Temporary changes made permanent without management of change 4.03 5
then the process hazards analysis should be carried out.
3-2-7. Audits
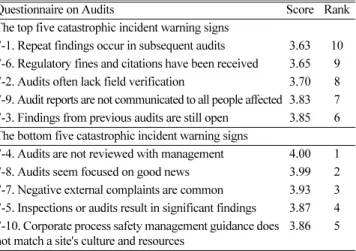
As shown in Table 11, the “Audit” element is the second lowest score among the nine risk elements along with “Leadership and safety culture” element. In the “Audit” element, “Repeat findings occur in subsequent audits” show the lowest score at 3.63 points fol- lowed by “Regulatory fines and citations have been received” at 3.65 points. “Audits often lack field verification” is 3.70 points. “Audit reports are not communicated to all people affected” is 3.85 points.
“Findings from previous audits are still open” is 3.85 points. Those are surveyed major hazard warning signs. From the response that the corrective action items of the audit are being repeated, it can be seen that the audit program failed to identify the root cause of the prob- lem, and education of the employees about the results of the audit and the measures taken are not enough. It is surveyed that the correc- tive action of the findings and observations are delayed, which means that the audit is perfunctory conducted and the actual content of audit is not faithfully progressing. Acknowledgment of lack of field validation in audit is also confirmed as a matter of concern. In particular, “Findings from previous audits are still open (7-3)” shows that operation department and safety department are conflicting with
each othe; the safety department considers it a very hazardous warning sign. Also, unlike the safety department, the operation department considered hazard warning signs for “Inspections or audits result in significant findings (7-5).” In particular, it can be concluded that caus- ing serious correction is associated with the question “Regulatory fines and citations have been received (7-6).”
3-2-8. Learning from experience
For the hazard warning sings related to “Learning from experience”
element, “Superficial incident investigations result in improper find- ings” is identified as the most hazardous warning sign with 3.54 points. “Frequent activation of safety systems” is 3.86 points. “Envi- ronmental performance does not meet regulations or company tar- gets” is 3.89 points. “Incident reports downplay impact” is 3.94 points. “Incident trends and patterns apparent but not well tracked or analyzed” is 4.01 points. As with the other process safety manage- ment element, perfunctory investigation of incidents is surveyed the most hazard warning signs. This is closely related to basic safety atti- tudes such as process safety culture. In addition, the fact that the acti- vation of the safety system can mean that a process safety near-miss frequently happens. If the frequency of a process safety near-miss increases, it will lead to serious process safety incidents. Identifying, managing and eliminating process safety near-miss as well as gen- eral occupational safety near-miss accidents can be a first step to pre- vent major industrial accidents. It is necessary to introduce and implement a process safety near-miss management system already implemented in developed countries. Particularly, the safety depart- ment perceives that “Frequent process upsets or off-specification product (8-3)” is a hazard warning sign, but the production depart- ment and the safety department have a disagreement, and unlike the production department, “Incident reports downplay impact (8-11)” is perceived as a hazard warning sign in the safety department. It can be a simple example that there is a problem with the quality of the inci- dent investigation. Table 12 shows the results of the survey.
3-2-9. Physical warning signs
In response to the “Physical warning signs” element, the “Dust Table 11. Survey results for audits element
Questionnaire on Audits Score Rank
The top five catastrophic incident warning signs
7-1. Repeat findings occur in subsequent audits 3.63 10 7-6. Regulatory fines and citations have been received 3.65 9 7-2. Audits often lack field verification 3.70 8 7-9. Audit reports are not communicated to all people affected 3.83 7 7-3. Findings from previous audits are still open 3.85 6 The bottom five catastrophic incident warning signs
7-4. Audits are not reviewed with management 4.00 1 7-8. Audits seem focused on good news 3.99 2 7-7. Negative external complaints are common 3.93 3 7-5. Inspections or audits result in significant findings 3.87 4 7-10. Corporate process safety management guidance does
not match a site's culture and resources
3.86 5
Table 12. Survey results for learning from experience element
Questionnaire on Learning from experience Score Rank
The top five catastrophic incident warning signs
8-10. Superficial incident investigations result in improper findings 3.54 14
8-14. Frequent activation of safety systems 3.86 13
8-12. Environmental performance does not meet regulations or company targets 3.89 12
8-11. Incident reports downplay impact 3.94 11
8-13. Incident trends and patterns apparent but not well tracked or analyzed 4.01 10
The bottom five catastrophic incident warning signs
8-2. Frequent leaks or spills 4.21 1
8-5. Abnormal instrument readings not recorded or investigated 4.17 2
8-4. High contractor incident rates 4.14 3
8-1. Failure to learn from previous incidents 4.13 4
8-3. Frequent process upsets or off-specification product 4.11 5
buildup on flat surfaces and in buildings” is 3.70 points, which is the lowest score. “Project trailers located close to process facilities” is 3.83 points. “Worker or community complaints of unusual odors” is 3.84 points. “Equipment or structures show physical damage” is 3.87 points. “Uncontrolled traffic movement within the facility” is 3.94 points. Those are the major hazard warning signs. Installing a tempo- rary container near the process facility can prevent the leaking hydro- carbons from spreading out of the explosion range if a leak accident occurs, as experienced in the Texas BP accident case in 2005. In the event of a fire or explosion, the injuries to the people who are staying in the temporary container can be greatly increased. Insufficient con- trol of vehicle traffic is an ignition source when flammable material leaks, which causes serious process safety incidents such as fire and explosion, and it is also an important hazard factor for the safety of
passengers riding in cars. In particular, “Obvious leaks and spills (9-4)”
is considered to be a very hazardous warning sign in safety depart- ments, but production departments are deemed to have fewer prob- lems, and the safety department considers that “Inconsistent or incorrect use of personal protective equipment (9-6)” is problematic. From the viewpoint of the safety department, it can be seen that the safety gear is not properly worn. It is believed that education and emphasis on wearing safety gear will need to be conducted continuously.
3-3. The Top and Bottom ten hazards warning signs in the all the 9 elements
3-1-1. The top 10 catastrophic incident warning signs
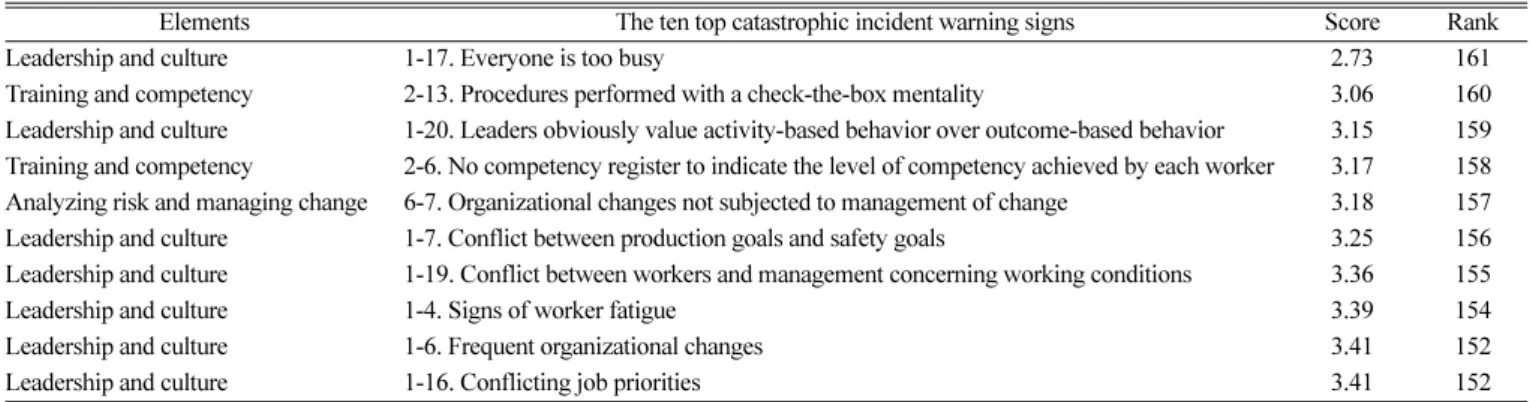
As shown in Table 14, the top ten hazardous warning sings included
“Leadership and culture” seven items, “Training and competency”
two items, “Analyzing risk and managing change” one item respectively.
“Leadership and culture” element contains the most hazard warning signs.
3-3-2. The bottom ten catastrophic incident warning signs The bottom ten hazard warning sign items with low risk are shown in Table 15. “Asset integrity” is found to be the most dominant with five items and it is surveyed that each of “Leadership and culture,”
“Physical warning signs,” “Learning from experience,” “Training and competency” and “Procedures” has one item respectively.
4. Conclusions
This survey confirmed that the relatively weak process safety ele- Table 13. Survey results for physical warning signs element
Questionnaire on Physical warning signs Score Rank The top five catastrophic incident warning signs
9-5. Dust buildup on flat surfaces and in buildings 3.70 16 9-10. Project trailers located close to process facilities 3.83 15 9-1. Worker or community complaints of unusual odors 3.84 14 9-2. Equipment or structures show physical damage 3.87 13 9-8. Uncontrolled traffic movement within the facility 3.94 12 The bottom five catastrophic incident warning signs
9-9. Open and uncontrolled sources of ignition 4.35 1 9-14. Open electrical panels and conduits 4.13 2 9-11. Plugged sewers and drainage systems 4.13 3 9-7. Missing or defective safety equipment 4.13 4 9-16. Loose bolts and unsecured equipment components 4.11 5
Table 15. The bottom 10 catastrophic incident warning signs
Elements The bottom ten catastrophic incident warning signs Score Rank
Leadership and culture 1-26. A high absenteeism rate 4.39 1
Physical warning signs 9-9. Open and uncontrolled sources of ignition 4.35 2
Asset integrity 5-2. Overdue equipment inspections 4.27 3
Asset integrity 5-14. Facility firewater used to cool process equipment 4.25 4
Asset integrity 5-1. Operation continues when safeguards are known to be impaired 4.24 5
Asset integrity 5-16. Bypassed alarms and safety systems 4.23 6
Learning from experience 8-2. Frequent leaks or spills 4.21 7
Training and competency 2-14. Long-term workers have not attended recent training 4.21 7
Procedures 4-9. Failure to follow company procedures is tolerated 4.20 9
Asset integrity 5-3. Relief valve testing overdue 4.18 10
Table 14. The top ten catastrophic incident warning signs
Elements The ten top catastrophic incident warning signs Score Rank
Leadership and culture 1-17. Everyone is too busy 2.73 161
Training and competency 2-13. Procedures performed with a check-the-box mentality 3.06 160
Leadership and culture 1-20. Leaders obviously value activity-based behavior over outcome-based behavior 3.15 159 Training and competency 2-6. No competency register to indicate the level of competency achieved by each worker 3.17 158 Analyzing risk and managing change 6-7. Organizational changes not subjected to management of change 3.18 157
Leadership and culture 1-7. Conflict between production goals and safety goals 3.25 156
Leadership and culture 1-19. Conflict between workers and management concerning working conditions 3.36 155
Leadership and culture 1-4. Signs of worker fatigue 3.39 154
Leadership and culture 1-6. Frequent organizational changes 3.41 152
Leadership and culture 1-16. Conflicting job priorities 3.41 152
ments that require improvement in process safety management at oil refineries and chemical plants, including the Yeosu Petrochemical Complex, are the leadership and safety culture of managers and man- agement. To summarize, the following efforts are necessary to pre- vent major industrial accidents.
First, improvement of safety culture is required. Leadership and culture as the foundation of safety management level show the lowest score in process safety management. The safety culture that ignores standard procedures can be the greatest hazardous factor to break down the safety management system in a moment.
Second, preparation and implementation of systematic and effi- cient safety audit program is required. An audit system is required to be established and implemented to find the root cause of the findings and/or observations. Corrective action items are required to track until the completion of the corrective action.
Third, balanced investment is required of resources, manpower and capital. Leadership and culture with the lowest score, and asset integrity with the highest score, differ by more than 8%. There is a need to reduce the gap through the balanced investment of work- force and capital.
Fourth, justification is required for the decrease of manpower. In the process industry, recently manpower has been decreased along with significant changes in processes and technologies. This can pro- vide an excuse to justify actions that ignore or skip the following standard procedures. Therefore, it is necessary to review whether workers are actually busy or are feeling busy.
Fifth, Full understanding is needed for the purpose of process safety management of management. Process safety management
should be implemented to prevent incidents and for worker safety, not a legal requirement.
Sixth, a system needs to be established that can find and eliminate process safety near-miss. Process safety near-miss, that is, process excursion or deviation, needs to be managed as much as occupa- tional safety near-miss.
References
1. CCPS, A practical approach to hazard identificaton for opera- tions and maintenance workers, Wiley, New York, NY (2012).
2. CCPS, Recognizing catastrophic incident warning signs in the process industries, Wiley, New York, NY (2013).
3. CCPS, Guidelines for writing effective operation and naintenance procedures, Wiley, New York, NY (1996).
4. CCPS, Conduct of operations and operational discipline, Wiley, New York, NY (2011).
5. CCPS, Guidelines for auditing process safety management systems, Wiley, New York, NY (2011).
6. CCPS, Guidelines for risk based process safety, Wiley, New York, NY (2007).
7. CCPS, Gudilines for process safety metrics, Wiley, New York, NY (2010).
8. Process safety performance indicators for the refining and petro- chemical industries, API RP 754, API, New York, NY (2010).
9. CCPS, Guidelines for the management of change for process safety, Wiley, New York, NY (2008).
10. CCPS, Guidelines for safe process operations and maintenance, Wiley, New York, NY (1995).