ABSTRACT
Objective: Poly (ADP-ribose) polymerase (PARP) is an important molecule in the early stress response of DNA damage, which is involved in DNA damage repair and cellular senescence.
Olaparib, as PARP inhibitor, has an anti-tumor effect on high grade serous ovarian cancer, but its effects on cellular senescence have not been reported. This study intends to explore the role of olaparib in the regulation of senescence in ovarian cancer cells.
Methods: The effects of olaparib on the senescence of ovarian cancer cells were detected by using the senescence-associated β-galactosidase (SA-β-Gal) and senescence-associated heterochromatin aggregation (SAHF). Quantitative real-time polymerase chain reaction was used to analyze the senescence-associated secretory phenotype (SASP). Cell cycle and apoptosis were detected by flow cytometry. The effect of olaparib on tumor growth was analyzed in a nude mouse xenograft transplantation model.
Results: Long-term (6 days) treatment with olaparib (5 μM) significantly inhibited the growth of ovarian cancer cells, leading to arrest the cell cycle at G0/G1 phase, significant increase the number of positive SA-β-Gal stained cells and positive SAHF cells. The expression of P16 and retinoblastoma protein (p-RB) were significantly enhanced in SKOV3 cells under olaparib treated, meanwhile, the expression of P53 and p-RB were upregulated in A2780 cells. In OVCAR-3 cells, the expression of P53 was downregulated and p-RB was upregulated. Mice with SKOV3 xenograft transplantation was given olaparib (10 mg/kg/day) via abdominal cavity administration, the tumor volume was reduced (p<0.01).
Conclusion: Continuous low dosage administration of olaparib induced senescence under P16 or P53 dependent manner in ovarian cancer.
Keywords: Olaparib; Senescence; Ovarian Neoplasms
INTRODUCTION
Ovarian cancer is the most lethal gynecologic malignancy at present. Despite the recent new diagnostic possibilities and medical advances, the 5-year survival rate of patients with advanced ovarian cancer is only 20% [1]. Prognosis is usually very poor due to the late J Gynecol Oncol. 2019 Mar;30(2):e26
https://doi.org/10.3802/jgo.2019.30.e26 pISSN 2005-0380·eISSN 2005-0399
Original Article
Received: Aug 8, 2018 Revised: Nov 11, 2018 Accepted: Nov 13, 2018 Correspondence to Haiou Liu
Shanghai Key Laboratory of Female Reproductive Endocrine Related Diseases, Shanghai 200011, China.
E-mail: [email protected] Copyright © 2019. Asian Society of Gynecologic Oncology, Korean Society of Gynecologic Oncology
This is an Open Access article distributed under the terms of the Creative Commons Attribution Non-Commercial License (https://
creativecommons.org/licenses/by-nc/4.0/) which permits unrestricted non-commercial use, distribution, and reproduction in any medium, provided the original work is properly cited.
ORCID iDs Zehua Wang
https://orcid.org/0000-0003-2890-272X Jianwen Gao
https://orcid.org/0000-0002-8754-9498 Jiabing Zhou
https://orcid.org/0000-0002-2365-4045 Haiou Liu
https://orcid.org/0000-0003-0200-8981 Congjian Xu
https://orcid.org/0000-0002-7954-5892 Funding
This work was supported by funding from National Key R&D Program of China (2016YFC1303100), National Natural Science
Zehua Wang ,1,2 Jianwen Gao ,3,4 Jiabing Zhou ,1,2 Haiou Liu ,1,2 Congjian Xu 1,2,5
1Obstetrics and Gynecology Hospital of Fudan University, Shanghai, China
2Shanghai Key Laboratory of Female Reproductive Endocrine Related Diseases, Shanghai, China
3Department of Health Science, Graduate School of Medical, Osaka University, Osaka, Japan
4Major of Biotechnological Pharmaceutics, Shanghai Pharmaceutical School, Shanghai, China
5Department of Obstetrics and Gynecology, Fudan University Shanghai Medical College, Shanghai, China
Olaparib induced senescence under P16 or P53 dependent manner in
ovarian cancer
Foundation of China (31570803, 81773090, 81272879, 81402151).
Conflict of Interest
No potential conflict of interest relevant to this article was reported.
Author Contributions
Conceptualization: L.H., X.C.; Data curation:
W.Z.; Formal analysis: W.Z.; Funding acquisition: X.C.; Investigation: W.Z.;
Methodology: L.H.; Project administration:
L.H.; Resources: G.J., Z.J.; Software:
W.Z.; Supervision: L.H.; Validation: W.Z.;
Visualization: W.Z.; Writing - original draft:
W.Z.; Writing - review & editing: W.Z.
diagnosis. Thus, there is an urgent need to develop an effective therapeutic for ovarian cancer. The common clinical treatment for ovarian cancer includes cytoreductive surgery and receiving platinum-based combination chemotherapy. But most ovarian cancer patients have still died from tumor recurrence and metastasis. Drug resistance of tumor cells is an important factor affecting the effect of chemotherapy and causing high mortality. Therefore, improving sensitivity of chemotherapy and reversing drug resistance have become a difficult problem in the treatment of ovarian cancer. Cellular senescence is a process characterized by normal human cells lose their proliferative capacity and depart from the cell cycle into a relatively stable state. Studies have confirmed that cellular senescence has been third intracellular mechanism of cancer prevention followed by cellular DNA repair and apoptosis, which is closely related with the occurrence, development and treatment of tumors [2]. In recent years, a research shows that the induction of tumor cellular senescence is a feasible strategy to reverse tumor drug-resistance [3]. Induction of senescence on one hand can reduce the dose of chemotherapy [4], and on the other hand can solve the tumor apoptosis resistance [5]. Therefore, cellular senescence has been suggested as a target for novel therapeutics in ovarian cancer.
Poly (ADP-ribose) polymerases (PARPs) are the post-translational modifying enzymes involved in many cellular processes, which regulate metabolic transcription factors and energy sensor systems, especially play pivotal roles in genomic stability and cell survival in response to DNA damage [6]. PARPs are activated by DNA-strand interruptions, besides DNA damage, PARPs are also involved in telomere cohesion, intracellular trafficking and other biological functions [7]. PARPs family includes a total of 17 members [8], PARP-1 and PARP-2 have been well researched currently among them. PARP-1/2 enzymes contribute to repairing DNA single-strain rupture, and it is worth mentioning that repair of these fracture loci is the cause of drug resistance to radiotherapy and chemotherapy (such as alkylating agent) [9,10]. A large number of studies have shown that in tumor cells, the PARPs are generally in a state of high expression, which is prone to causing treatment resistance of tumor cells [11]. Therefore, the inhibition of PARPs can reduce resistance of tumor cells and PARPs have become a new target of tumor treatment.
Olaparib is a type of PARP inhibitor, which was approved for the treatment of recurrent ovarian cancer in BRCA1/2-mutated women by the Food and Drug Administration's accelerated approval program on December 19, 2014. The safety and efficacy of this drug are confirmed in a single-group, open labeled, and multi-center clinical trial. The results showed that the objective response rate was 34% with median response duration of 7.9 months in patients treated with olaparib [12]. Olaparib has shown an anti-tumor effect as PARP inhibitor on high grade serous ovarian cancer, but its effects on cellular senescence have not been reported. This study intends to explore the effect of different doses and treatment time of olaparib on the senescence of ovarian cancer cells, to elucidate the role of olaparib in the treatment of ovarian cancer.
MATERIALS AND METHODS
1. Cell lines and culture conditions
The SKOV3, A2780 and OVCAR-3 human epithelial ovarian cancer cell lines were obtained from the American Type Culture Collection (ATCC, Manassas, VA, USA). Their TP53 status were null (SKOV3), wild-type (A2780) and mutant (OVCAR-3). The SKOV3 cells
2/16 https://ejgo.org https://doi.org/10.3802/jgo.2019.30.e26
were maintained in McCoy's 5A medium (Biological Industries, Beit Haemek, Israel), A2780 cells and OVCAR-3 cells were cultured in RPMI 1640 medium (Biological Industries), both all supplemented with 10% fetal bovine serum and 1% penicillin/streptomycin. Cells were maintained at 37°C with an atmosphere of 5% CO2, following standard protocols. The medium was replaced two-to-three times every week.
2. Drug treatment
Olaparib (10 mM) was purchased from Selleck Chemicals and made up in DMSO. At a concentration of 2×10⁵ cells, SKOV3, A2780 and OVCAR-3 cells were seeded in conventional 60 mm cell culture dishes with 5 mL of medium. Cells were then exposed the following day to drug treatments for six days.
3. Cell cycle profiling
The collected cells were washed with HBSS for two times, then fixed overnight with adding 75% ethanol at −20°C, centrifuged to collect cells, discarded ethanol, added propidium iodide (PI) staining solution, and then detected the cell cycle by flow cytometry. The results were analyzed by FlowJo 7.6.1 software (FlowJo, LLC, Ashland, OR, USA).
4. Detection of cell proliferation
Cells were inoculated to the six-well plates with 2×10³ cells per well, and 6 parallel wells were set in each experimental group. The 0 hour was recorded at 6 hours after cell attachment.
Cells were cultured continuously for 30 hours, and each well was added with 90 μL medium and 10 μL CCK8 reagent, and the cells were incubated in the incubator containing 5% CO2 at 37°C, microplate reader was used to read the absorbance value at 450 nm.
5. Senescence-associated β-galactosidase (SA-β-Gal) staining
The cells were carried out in six-well plates, and the steps were as follow: 1) The medium was removed, and the plate was washed with HBSS for 2 times; 2) 1 mL β-galactosidase fixed solution was added, and the cells were fixed at room temperature for 15 minutes; 3) The cell fixed solution was removed; the plate was washed for 3 times with HBSS, 3 minutes each time; 4) Each well was added with 1 mL dyeing liquid (10 μL β-galactosidase staining fluid A, 10 μL β-galactosidase staining fluid B, 930 μL β-galactosidase staining fluid C, and 50 μL X-Gal solution), and incubated at 37°C overnight; 5) In the next day, the plate was observed under the inverted microscope. Uniform blue fine particles in the cytoplasm were positive β-galactosidase, namely senescence. The calculation method for positive rate of SA-β-Gal staining was: 5 views were randomly selected from each well under 200× eyepiece, and the percentage of positive cells was calculated as percentage of total cell number.
6. Western blot analysis
The cells were collected with lysate containing protease inhibitors, and the total protein of the cells was extracted after lysis. After 10% sodium dodecyl sulfate -polyacrylamide gel electrophoresis separation, the protein was transferred onto the polyvinylidene difluoride (PVDF) membrane. After transfer, the PVDF membrane was blocked for 1 hour by TBST of 5% dried skimmed milk, and then probed with primary antibodies (1:1,000) and incubated overnight at 4°C. After washing the membrane for 3 times with TBST, the relevant anti- rabbit or anti-mouse secondary antibodies (1:1,000) was added to react for 2 hours at room temperature. The membrane was washed with TBST for 3 times before imaging. Image-J image analysis system was used to analyze the results of western blot, and the ratio of the target protein to the gray level of GAPDH indicates the relative content of the target protein.
Olaparib induced senescence in ovarian cancer
7. Quantitative real-time polymerase chain reaction (RT-PCR) analysis
Total RNA was prepared using TRIzol reagent (Invitrogen, Carlsbad, CA, USA), following the manufacturer's instructions. Quantitative RT-PCR was performed using SYBR® Green (TaKaRa, Inc., Kusatsu, Japan) on a Bio-Rad CFX96 Real-time PCR system (Bio-Rad systems, Hercules, CA, USA). We utilized primers designed specifically for the detection of chemokine C-X-C motifligand (CXCL) 10, CXCL8, interleukin (IL)-6, CXCL1, IL-1B, transforming growth factor (TGF)β3, CXCL2, IL-8, IL-1A, IL-18, IL-1B, MMP3, IL-13, and GAPDH (S1). All p-values are in comparison to control groups. Melt curves were performed to ensure a uniform product, and data analysis was then performed using the 2−ΔΔCt method.8. In vivo growth inhibitory assay
Ten nude mice (female, aged 6–8 weeks) were obtained from Shanghai SLAC Laboratory Animal Co Ltd. (Shanghai, China) and housed in a pathogen-free environment under controlled conditions. The mice were injected subcutaneously with 3×10⁶ SKOV3 cells. When the tumors reached a size of 60 mm3, xenografted mice were divided into two groups: control and olaparib. Olaparib was administered via abdominal cavity administration at a dose of 10 mg/kg/day for 2 weeks. The tumor diameters were measured with calipers and the tumor volumes were calculated using the following formula: length (mm)×width (mm)2/2.
9. Data analysis
The data were analyzed by using GraphPad Prism version 5.0 statistical software (GraphPad Software, San Diego, CA, USA). The measurement data were presented as means±standard deviation of three independent determinations. Then student's t-test was adopted in the comparison of experimental groups, when p<0.05, the difference was statistically significant.
RESULTS
1. Olaparib inhibited ovarian cancer cell viability in time-dependent manner
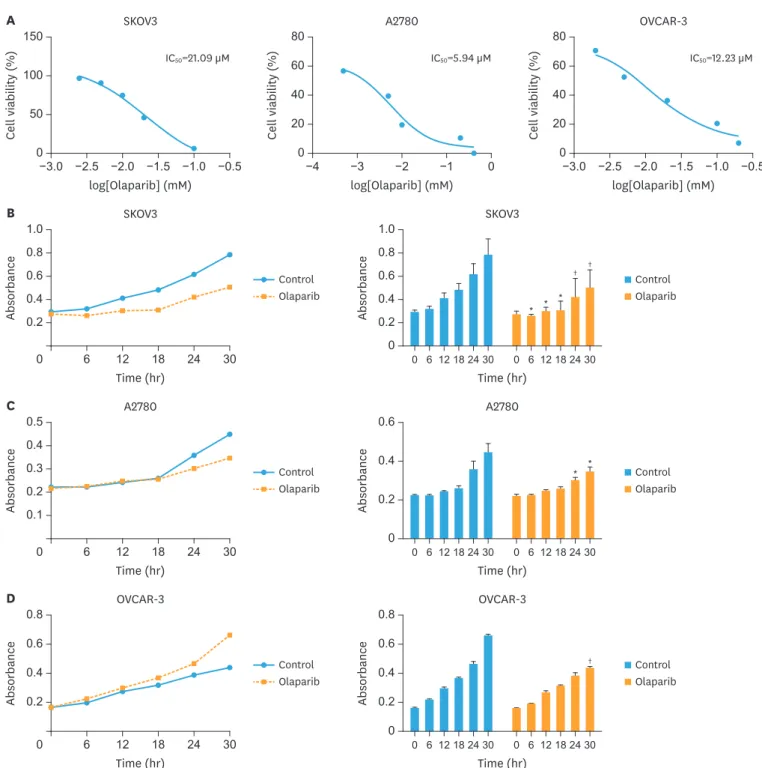
We first evaluated the effects of olaparib on cell viability in SKOV3, A2780 and OVCAR-3 ovarian cancer lines. The lowest effective dose of olaparib inducing growth inhibition was determined by cell counting kit-8 (CCK-8) assay. Olaparib inhibited the growth of ovarian cancer lines, with IC50 values of 21.09 μM for SKOV3 cells, 5.94 μM for A2780 cells and 12.23 μM for OVCAR-3 cells after 48 hours of treatment (Fig. 1A). To further elucidate growth inhibition effects, we analyzed the cell viability of SKOV3, A2780 and OVCAR-3 in the presence of olaparib (5 μM) using CCK-8 assay. Cells would be divided into two groups:the control group and the olaparib groups. The optical density at 450 nm wavelength was measured using the microplate reader. As shown in Fig. 1B, C, and D, the cell proliferation was slowed in the olaparib group compared with the control group, and significant decrease at 24 hours and 30 hours. The results suggested olaparib treatment inhibited the proliferation of ovarian cancer cells in time-dependent manner.
2. The effect of low-dose olaparib in ovarian cancer cell lines
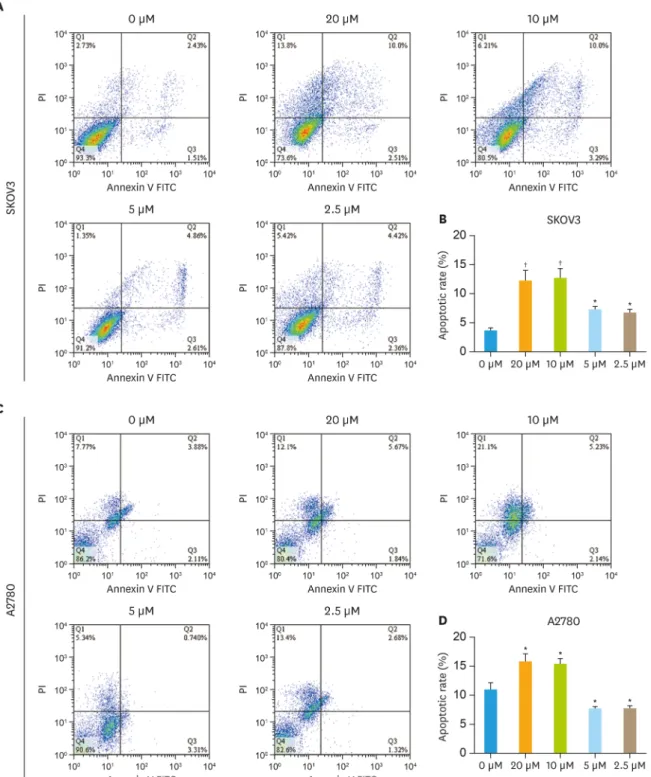
Flow cytometry was used to analyze the influences of olaparib (2.5–20 μM) on the apoptosis of ovarian cancer cells lines, including SKOV3, A2780 and OVCAR-3. The cells were divided into five groups: the control group and the olaparib groups (concentrations of 20 μM, 10 μM, 5 μM and 2.5 μM). Annexin-V-FITC and PI double dyeing were used to analyze the apoptosis of cells. As shown in Fig. 2A, in SKOV3 cells, the apoptosis rates distributions varied in different olaparib treatment groups. In the blank control group, the apoptosis rate was only 3.94%.
4/16 https://ejgo.org https://doi.org/10.3802/jgo.2019.30.e26
Compared with that, the percentage of apoptotic cells were significantly increased to 12.51%
and 13.29% in the high-dose (20 μM and 10 μM) test groups (p<0.01). However, the apoptosis rates were 7.47% and 6.78% in the low-dose (5 μM and 2.5 μM) test groups, which did not significantly increase apoptotic cells (Fig. 2B). Then we treated the A2780 and OVCAR-3 cells Olaparib induced senescence in ovarian cancer
B
Olaparib Control
Olaparib Control
Time (hr) SKOV3
18 6
0.2
0
Absorbance
0.6 1.0
30 24 12
0.4 0.8
Time (hr) SKOV3
6 0.2
0
Absorbance
0.6 1.0
12 18 24 30
0 0 6 12 18 24 30
0.4 0.8
* *
*
†
†
C
Olaparib Control
Olaparib Control
Time (hr) A2780
18 6
0.1
0
Absorbance
0.3 0.5
30 24 12
0.2 0.4
Time (hr) A2780
6 0.2
0
Absorbance
0.6
12 18 24 30
0 0 6 12 18 24 30
0.4 *
*
Time (hr) OVCAR-3
18 6
0.2
0
Absorbance
0.6
30 24 12
0.4
D 0.8
Olaparib Control
Olaparib Control
Time (hr) OVCAR-3
6 0.2
0
Absorbance
0.6
12 18 24 30
0 0 6 12 18 24 30
0.4 0.8
†
log[Olaparib] (mM)
IC50=21.09 µM IC50=5.94 µM IC50=12.23 µM
SKOV3 A
−1.5
−2.5
−3.0 50
0
Cell viability (%)
100 150
−0.5
−1.0
−2.0
log[Olaparib] (mM) A2780
−1
−3
−4 40
0
Cell viability (%)
60 80
0
−2 20
40
0 60 80
20
log[Olaparib] (mM) OVCAR-3
−1.5
−2.5
−3.0
Cell viability (%)
−0.5
−1.0
−2.0
Fig. 1. Olaparib inhibits cell proliferation in ovarian cancer. (A) Ovarian cancer cell lines were cultured for 48 hours with different doses of olaparib. Cell viability was determined by CCK-8 assay. (B) SKOV3 cells were treated with 5 μM olaparib for 6, 12, 18, 24, 30 hours and then detect proliferation by CCK-8. (C) A2780 cells were treated with 5 μM olaparib for 6, 12, 18, 24, 30 hours and then detect proliferation by CCK-8. (D) OVCAR-3 cells were treated with 5 μM olaparib for 6, 12, 18, 24, 30 hours and then detect proliferation by CCK-8. Data represent the mean±standard deviation (n=6).
CCK-8, cell counting kit-8.
*p<0.05, †p<0.01, compared with the control group.
with olaparib under the same conditions (Fig. 2C and E) and quantification of apoptosis rates from (Fig. 2D and F). Interestingly, the low-dose of olaparib (5 μM) treatment did not increase apoptotic cells in both A2780 cells and OVCAR-3 cells, the rate of apoptosis was 4.05% in
6/16 https://ejgo.org https://doi.org/10.3802/jgo.2019.30.e26
Fig. 2. The effect of different dose olaparib in ovarian cancer cell lines. (A) SKOV3 cells treated with different concentrations of olaparib (20 μM, 10 μM, 5 μM and 2.5 μM) and then detect apoptosis by flow cytometry. (B) The rate of apoptotic was determined using FlowJo 7.6.1 software. (C) A2780 cells were treated same conditions as SKOV3. (D) Quantification of apoptosis rates in different concentrations of olaparib (20 μM, 10 μM, 5 μM and 2.5 μM). (E) OVCAR-3 cells were treated same conditions as SKOV3. (F) Then quantification of apoptosis rates. Data represent the mean±standard deviation (n=3).
*p<0.05, †p<0.01, ‡p<0.001, compared with the control group. (continued to the next page)
A2780 cells and 10.46% in OVCAR-3 cells. Accordingly, we hypothesized that a low-dose of olaparib (5 μM) might trigger senescence instead of apoptosis in ovarian cancer cells.
3. Olaparib induced cellular senescence in ovarian cancer
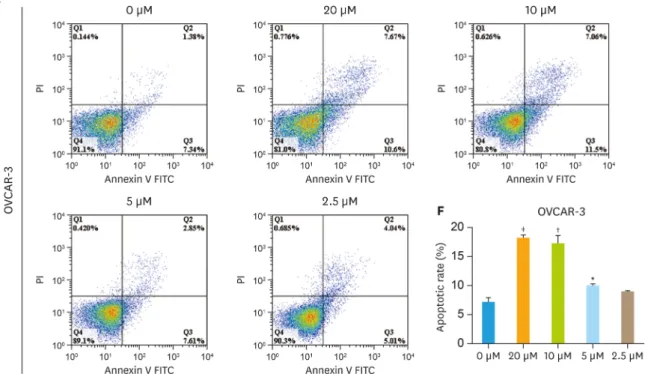
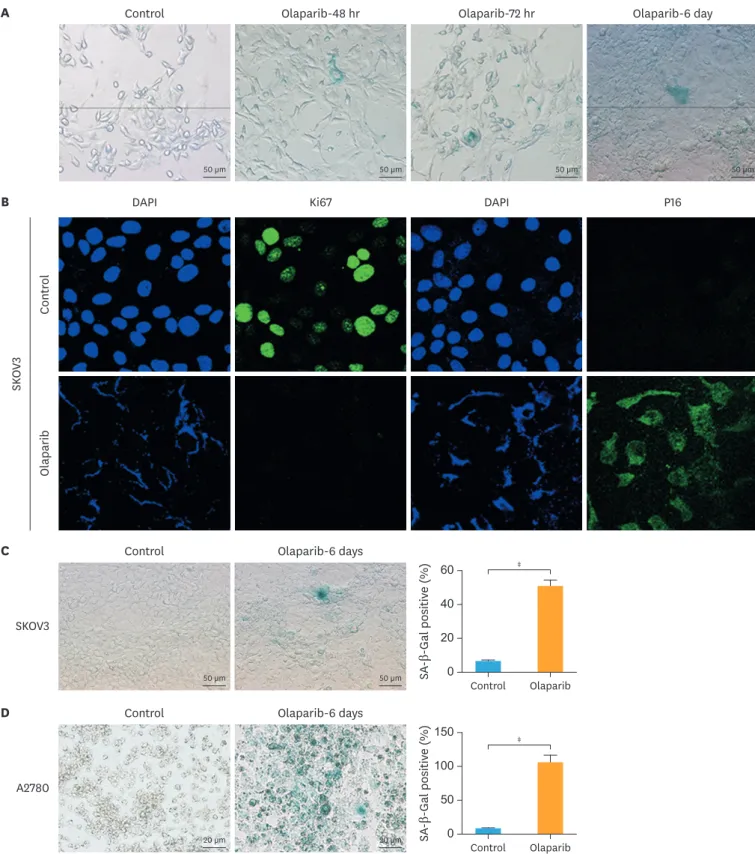
Based on the findings where olaparib inhibited cell proliferation, we hypothesized that ovarian cancer cells underwent senescence in the response to olaparib. The senescence of cells was detected by SA-β-Gal staining, which was the most ubiquitous cellular senescence marker. As shown in Fig. 3A, in control group, SA-β-Gal stained cells were few, meanwhile, the cells of the olaparib treatment groups exhibited senescence characteristics by flattened and enlarged morphology, and the senescent cells were blue stained, namely the cellular senescence related to β-galactosidase staining was positive. Furthermore, we evaluated whether the olaparib induced ovarian cancer cellular senescence in a time-dependent manner. SKOV3 cells were divided into four groups: the control group, 48 hours olaparib treatment group, 72 hours olaparib treatment group and 6 days olaparib treatment group. These results clearly showed that long-term (6 days) treatment with olaparib more significantly increase the rate of SA-β-Gal positive than short-term (48 hours) treatment, these data indicated that olaparib induced cellular senescence in ovarian cancer was followed a time-dependent manner.
Another hallmark of senescence was the formation of senescence-associated
heterochromatin aggregation (SAHF), which could be detected by DAPI, Ki67 and P16.
Fig. 3B showed that compared to the control group, nuclei appeared to enlarge and the heterochromatic regions were evidenced by DAPI staining in the olaparib treatment group.
In addition, after olaparib treatment, the number of Ki67-positive cells had a significantly Olaparib induced senescence in ovarian cancer
Fig. 2. (Continued) The effect of different dose olaparib in ovarian cancer cell lines. (A) SKOV3 cells treated with different concentrations of olaparib (20 μM, 10 μM, 5 μM and 2.5 μM) and then detect apoptosis by flow cytometry. (B) The rate of apoptotic was determined using FlowJo 7.6.1 software. (C) A2780 cells were treated same conditions as SKOV3. (D) Quantification of apoptosis rates in different concentrations of olaparib (20 μM, 10 μM, 5 μM and 2.5 μM). (E) OVCAR-3 cells were treated same conditions as SKOV3. (F) Then quantification of apoptosis rates. Data represent the mean±standard deviation (n=3).
*p<0.05, †p<0.01, ‡p<0.001, compared with the control group.
8/16 https://ejgo.org https://doi.org/10.3802/jgo.2019.30.e26
SKOV3 ControlOlaparib B
*
‡
‡
SASP (SKOV3) F
Fold change in protein levels 0
CXCL10 5 15
IL-6 CXCL1 IL-1B TGFβ3 10
Olaparib Control
†
‡
‡
‡
‡
SASP (A2780)
Fold change in protein levels 0
CXCL2 2 10
CXCL1 IL-6 IL-18 IL-8 IL-1B IL-13 6
8
4 ‡
†
‡
‡
SASP (OVCAR-3)
Fold change in protein levels 0
CXCL8 5 20
IL-13 TGFβ3 IL-6 15
10
‡
‡
‡
‡
Control Olaparib-48 hr Olaparib-72 hr Olaparib-6 day
DAPI Ki67 DAPI P16
A
50 µm
50 µm 50 µm 50 µm
SKOV3
C Control Olaparib-6 days
50 µm
50 µm SA-β-Gal positive (%) 0
Control 60
Olaparib 40
20
‡
A2780
20 µm 20 µm
D Control Olaparib-6 days
SA-β-Gal positive (%) 0
Control 150
Olaparib 100
50
‡
OVCAR-3
50 µm 50 µm
E Control Olaparib-6 days
SA-β-Gal positive (%) 0
Control 100
Olaparib 60
80
40 20
‡
Fig. 3. Olaparib induced cellular senescence in ovarian cancer. (A) The effect of olaparib induced ovarian cancer cellular senescence was detected by SA-β-Gal staining (200×), SKOV3 were treated with 5μM olaparib for 48 hours, 72 hours and 6 days. (B) Immunofluorescence analysis of the senescent heterochromatin foci stained with Ki67 (green), P16 (green) and DAPI (blue) to visualize SKOV3 cells treated with 5 μM olaparib. (C-E) SA-β-Gal staining on SKOV3 (C), A2780 (D), OVCAR-3 (E). The rate of SA-β-Gal positive was determined using Image-J software. Data represent the mean±standard deviation. (n=5). (F) Quantification of the cytokine protein profile of ovarian cancer cells (n=3).
SASP, senescence-associated secretory phenotype; SA-β-Gal, senescence-associated β-galactosidase.
*p<0.05, †p<0.01, ‡p<0.001, compared with the control group. (continued to the next page)
reduction compared with control, but the number of P16-positive cells was significantly increased under the same treatment conditions. These results clearly showed that low-dose of olaparib could induce cellular senescence in ovarian cancer.
We further demonstrated the effect of olaparib treatment in other ovarian cancer cells.
Statistically, SA-β-Gal cells increased from 5.4% in control group to 50.8% (p<0.001) in the SKOV3 olaparib-treatment groups with 6 days, respectively (Fig. 3C). In A2780 cells, the proportion of SA-β-Gal positive increased from 4.6% in control group to 68.7% (p<0.001) in treatment groups (Fig. 3D). Compared with control groups, the proportion of SA-β-Gal positive increased from 13.6% to 77.1% (p<0.001) in OVCAR-3 cells (Fig. 3E).
As we known, the senescent cells would appear a unique senescence-associated secretory phenotype (SASP), hence, we detected the expression of some inflammatory cytokines and chemokines (e.g., IL-1B, IL-6, IL-8, CXCL1, CXCL10), which were the main markers of SASP.
The results were confirmed by real time-quantitative PCR (RT-qPCR) analysis, as shown in Fig. 3F, treatment with olaparib led to significant increase of the expression of CXCL10, IL-6, CXCL1, IL-1B and TGFβ3 in SKOV3 cells. CXCL2, CXCL1, IL-6, IL-18, IL-1B and IL-13 were up-regulate in A2780 cells. In OVCAR-3 cells, the expression of CXCL8, IL-13, TGFβ3 and IL-6 were significantly higher than control. All these data indicated that low-dose olaparib could induce cellular senescence in ovarian cancer and it was followed a time-dependent manner.
4. Olaparib arrest ovarian cancer cells in G0/G1 phase of the cell cycle
To further elucidate senescence-associated growth inhibition, we analyzed the cell cycle profile of SKOV3, A2780 and OVCAR-3 in the presence of olaparib by flow cytometry. The cells were divided into two groups: the control group and long-term (6 days) treatment Olaparib induced senescence in ovarian cancerSKOV3 ControlOlaparib B
*
‡
‡
SASP (SKOV3) F
Fold change in protein levels 0
CXCL10 5 15
IL-6 CXCL1 IL-1B TGFβ3 10
Olaparib Control
†
‡
‡
‡
‡
SASP (A2780)
Fold change in protein levels 0
CXCL2 2 10
CXCL1 IL-6 IL-18 IL-8 IL-1B IL-13 6
8
4 ‡
†
‡
‡
SASP (OVCAR-3)
Fold change in protein levels 0
CXCL8 5 20
IL-13 TGFβ3 IL-6 15
10
‡
‡
‡
‡
Control Olaparib-48 hr Olaparib-72 hr Olaparib-6 day
DAPI Ki67 DAPI P16
A
50 µm
50 µm 50 µm 50 µm
SKOV3
C Control Olaparib-6 days
50 µm
50 µm SA-β-Gal positive (%) 0
Control 60
Olaparib 40
20
‡
A2780
20 µm 20 µm
D Control Olaparib-6 days
SA-β-Gal positive (%) 0
Control 150
Olaparib 100
50
‡
OVCAR-3
50 µm 50 µm
E Control Olaparib-6 days
SA-β-Gal positive (%) 0
Control 100
Olaparib 60
80
40 20
‡
Fig. 3. (Continued) Olaparib induced cellular senescence in ovarian cancer. (A) The effect of olaparib induced ovarian cancer cellular senescence was detected by SA-β-Gal staining (200×), SKOV3 were treated with 5μM olaparib for 48 hours, 72 hours and 6 days. (B) Immunofluorescence analysis of the senescent heterochromatin foci stained with Ki67 (green), P16 (green) and DAPI (blue) to visualize SKOV3 cells treated with 5 μM olaparib. (C-E) SA-β-Gal staining on SKOV3 (C), A2780 (D), OVCAR-3 (E). The rate of SA-β-Gal positive was determined using Image-J software. Data represent the mean±standard deviation. (n=5). (F) Quantification of the cytokine protein profile of ovarian cancer cells (n=3).
SASP, senescence-associated secretory phenotype; SA-β-Gal, senescence-associated β-galactosidase.
*p<0.05, †p<0.01, ‡p<0.001, compared with the control group.
with olaparib group. As shown in Fig. 4A, D, and G, SKOV3, A2780 and OVCAR-3 olaparib- treatment groups showed an increase cell population in G1 phase concomitant with a decrease in S and G2 phase. In the SKOV3 olaparib-treatment group, the percentages of cells in the G0/G1, S and G2/M phases were 82.21%, 5.56% and 11.42% (Fig. 4B), 76.11%, 14.28% and 9.35% in A2780 group (Fig. 4E) and 71.25%, 19.69% and 8.52% in OVCAR-3 group (Fig. 4H) under the same treatment conditions, respectively. The data indicated that all ovarian cancer cells (SKOV3, A2780 and OVCAR-3) showed a significant increased G0/G1 phase (p<0.05) under the olaparib treatment, which compared with control groups. These results could be considered that olaparib arrest ovarian cancer cells in G0/G1 phase of the cell cycle.
We then examined the protein expression of cell cycle by western blotting. Fig. 4C showed that the expression of P16 and retinoblastoma protein (p-RB) were significantly enhanced in SKOV3 cells under olaparib treated. Meanwhile, the expression of P53 and p-RB were upregulated in A2780 cells (Fig. 4F). In OVCAR-3 cells, the expression of P53 was downregulated and p-RB was upregulated (Fig. 4I). Notably, the level of CDK4, CDK6, cyclin D1 and cyclin D3 were quite different in these ovarian cancer cell lines. These data suggested that olaparib induced cellular senescence through P16-RB/P53-RB pathway, but the patterns of olaparib inhibited cell cycle also depend on the different cell type.
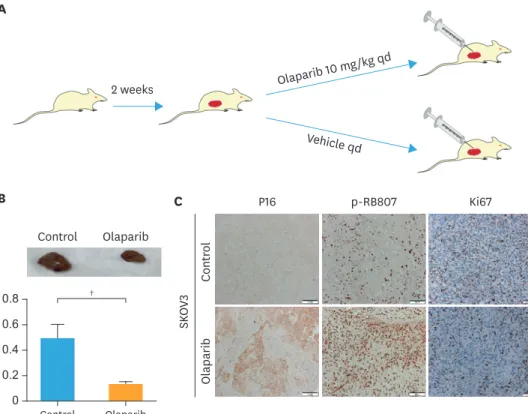
5. Olaparib suppress the progression phase of ovarian cancer in vivo
We took advantage of the tumor xenograft model to analysis the effects of olaparib suppress the progression phase of ovarian cancer in vivo (Fig. 5A). As shown in Fig. 5B, olaparib could inhibit the tumor growth of mice with SKOV3 ovarian cancer, and the tumor volume was significantly smaller than that of the control group (p<0.01). In Fig. 5C, there was a significant increase in the expression of P16 and p-RB80 in olaparib group compared to the control group. The results were same with western blot's results. Immunohistochemistry results also showed that the positive rate of Ki67 was obviously decreased. As Ki67 was closely related to the proliferation of tumor cells, the results proved once again that olaparib could inhibit the proliferation of ovarian cancer cells.
DISCUSSION
Olaparib is an oral PARP inhibitor that can increase the formation of PARP-DNA complex, so as to block the PARP-mediated DNA damage repair, damage cell steady state and accelerate cell apoptosis. Germline mutations in the tumor suppressor genes BRCA1/2 of which proteins are linked to DNA repair predispose women to ovarian cancer. Olaparib can specifically affect DNA damage repair mechanism of targeted cells by attacking the key flaws of cancer cells carrying BRCA1 and BRCA2 mutations [13]. It can be used in maintenance therapy of patients with recurrent severe ovarian cancer, who have BRCA gene mutations and are sensitive to platinum drugs. As an inhibitor of PARP, olaparib exhibits an antitumor effect in high-grade serous ovarian cancer [14]. There are many articles focusing on the effect of olaparib on tumor cell apoptosis, but its effect on cellular senescence has not been reported yet. Clinical studies have confirmed that olaparib as a single agent has showed good efficacy in phase I and phase II clinical tests [15,16]. However, the use of high doses (400 mg, 2 times/d) would result that 6% patients had grade 3 to 4 vomiting, 3% had grade 3 to 4 fatigue, and 3% had grade 3 to 4 anemia [17]. Some research reported that low doses (100 mg, twice daily) of olaparib also had clinical activity [18]. In Mateo et al.'s study [19], they found that the recommended monotherapy dose of olaparib tablet for phase III trials was 300 mg twice daily, simplifying drug administration from 16 capsules to four tablets per
10/16 https://ejgo.org https://doi.org/10.3802/jgo.2019.30.e26
Olaparib induced senescence in ovarian cancer
Cell number
DNA Content
Control 40,00020,00060,000
200 100 0
300
GHI
Cell number
DNA Content
Olaparib 40,00020,00060,000
800 600 400 200 0
1,000 * OlaparibControl OlaparibControl
OVCAR-3 0
Relativ e prot ein lev
el d change of contr (fol
ol)
P53
1
4−+ p-RB807P21CDK4Cyclin D1
P53 p-RB807 P21 CDK4 Cyclin D1 GAPDH
3 2 * *
†
OVCAR-3 0
Phase of the cell cycl e (%)
G0/G1
20
80 SG2/M
60 40OVCAR-3
OVCAR-3 G1 G2S
G1 G2S
Cell number
DNA Content
Control 40,00020,00060,000
2,000 1,000 0
3,000
4,000
5,000DEF
Cell number
DNA Content
Olaparib 40,00020,00060,000
1,500 500
1,000 0
2,000 *OlaparibControl *
A2780 0
Relativ e prot ein lev
el d change of contr (fol
ol)
P53
1
−+ p-RB807CDK6CDK4CDK2CHK2Cyclin D3
P53 p-RB807 CDK6 CDK4 CDK2 CHK2 Cyclin D3 GAPDH
3 2 †*
* *
A2780 0
Phase of the cell cycl e (%)
G0/G1
20100 SG2/M
60
80 40A2780
A2780 OlaparibControlG1 G2 S
G1 G2 S
Cell number
DNA Content
Control 40,00020,00060,000
2,000 1,000 0
3,000
ABC
Cell number
DNA Content
Olaparib 40,00020,00060,0000
2,500 2,000 1,500 1,000 500
* OlaparibControl † *
SKOV3 0
Relativ e prot ein lev
el d change of contr (fol
ol)
P16
1
4−+ p-RB807CDK6CDK4CDK2CHK2Cyclin D3
P16 p-RB807 CDK6 CDK4 CDK2 CHK2 Cyclin D3 GAPDH
3 2†*
†
SKOV3 0
Phase of the cell cycl e (%)
G0/G1
20100 SG2/M
80 60 40SKOV3
SKOV3 OlaparibControlG1 G2 S
G1 G2 S Fig. 4. Effects of olaparib on the cell cycle arrest in ovarian cancer cell lines. (A, D, G) showed that examined the cell distribution at each phase of the cell cycle by flow cytometry. (B, E, H) showed the percentage of cells in cell cycle phase was determined using FlowJo 7.6.1 software. Data represent the mean±standard deviation (n=3). (C) SKOV3 cells were treated with 5 μM olaparib for 6 days, and then immunoblotted with anti-P16, -p-RB807, -CDK6, -CDK4, -CDK2, -CHK2 and -Cyclin D3 (D3) antibodies. (F) A2780 cells were treated with 5 μM olaparib for 6 days, and then immunoblotted with anti-P53, -p-RB807, -CDK6, -CDK4, -CDK2, -CHK2 and -D3 antibodies. (I) OVCAR-3 cells were treated with 5 μM olaparib for 6 days, and then immunoblotted with anti-P53, -p-RB807, -P21, -CDK4 and -Cyclin D1 antibodies. The results of western blot analyzed by Image-J image analysis system, and the ratio of the target protein to the gray level of GAPDH indicates the relative content of the target protein. Data represent the mean±standard deviation (−: control, +: olaparib-treatment, n=3). *p<0.05, †p<0.01, compared with the control group.
day. Therefore, we hope that continuous low dosage administration of olaparib can provide a new clinical medication scheme to relieve the adverse reactions. In this study, we found that low concentrations of olaparib (5 μM) induced cellular senescence rather than apoptosis in ovarian cancer cells. Thus, for all subsequent work, 5 μM was fixed as the optimum concentration. As we know, the SA-β-Gal, SAHF and SASP are the most common markers of senescence [20]. In our experiment, we detected those biomarkers to further confirmed that low-dose of olaparib can trigger senescence instead of apoptosis.
Senescence usually does not occur though the transient precipitating stress, because the cell can resume cycling upon resolution of the stress. The premature senescence cancer cells were associated with a strong SASP, upon immune dysfunction, the SASP's proinflammatory nature can recruit immune cells, which can kill and clear senescent cells or other surviving cancer cells [21]. In cancer cells, in which chemotherapy induced senescence is an important alternative cell fate to apoptosis [22]. The research indicated that the onset of irreversible senescence requires a prolonged period (>4 days) of stimuli driving the cell both to divide and not to divide [23]. Schmitt et al. [24] reported an apoptosis-independent function to P53 in cancer showed that murine lymphomas overexpressing Bcl-2 respond to chemotherapy by engaging a senescence program controlled by P53 and P16INK4a rather than apoptosis. In our experiments found that the long-term (6 days) treatment with olaparib (5 μM) significantly inhibited the growth of ovarian cancer cells (SKOV3, A2780 and OVCAR-3), which induced the cellular senescence followed a time-dependent manner.
12/16 https://ejgo.org https://doi.org/10.3802/jgo.2019.30.e26
B
SKOV3 ControlOlaparib C
2 weeks Olaparib 10 mg/kg qd
Vehicle qd
P16 p-RB807 Ki67
A
Control Olaparib
0 Control 0.8
Olaparib 0.6
0.4 0.2
†
Fig. 5. Effects of olaparib suppress the progression phase of ovarian cancer in vivo. (A) Ovarian cancer cells were subcutaneously injected into nude mice (n = 5 per group). After 2 weeks of tumor growth, the animals were treated with olaparib (10 mg/kg/day) or vehicle for 2 weeks, and then euthanized. (B) Visible differences in tumor weight in olaparib-treatment nude mice and control nude mice. Data represent the mean±standard deviation (left: untreated control, right: 2 weeks after subcutaneous transplant, n=5). (C) Representative immunohistochemieal staining of tissues for SKOV3 group with P16, p-RB807 and Ki67.
†p<0.01, compared with the control group.
Cell cycle arrest is an important manifestation of cellular senescence. Flow cytometry shows that olaparib could arrest ovarian cancer cells in G0/G1 phase of the cell cycle. As we know, P16-RB and P53-RB is important signal transduction pathway of cellular senescence [25,26]. In the P16- RB/P53-RB pathway, senescence stimuli activate P16/P53, which can then induce senescence by activating p-RB [27], the different response may depend on the tissue and species of origin [28].
Cyclin D3 is an important regulatory factor in cell cycle, combine with cyclin-dependent kinases (CDK4 and CDK6) to compose the core cell cycle machinery that drives cell proliferation [29].
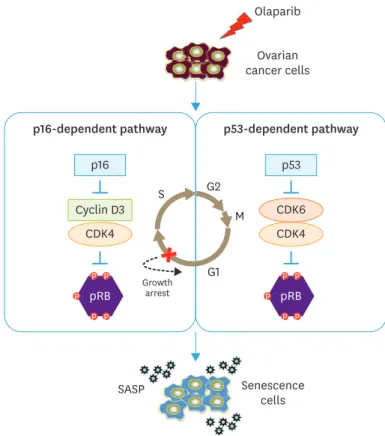
Retinoblastoma (RB) is a cell cycle regulating factor, which mainly regulates the transition of G0 and G1 phase to S phase. The series of CDKs (CDK2, CDK4, and CDK6) play an important role in controlling the activity of p-RBs. When RB is phosphorylated by these CDKs, it mainly resulting in gene transactivation and then causing cell cycle progression [30]. Our results indicate that olaparib can induce senescence by increasing the expression of P16, RB806, CDK2 and decreasing the expression of cyclin D3, CDK4 in SKOV3 cells. On the other hand, olaparib induces senescence by increasing the expression of P53, RB806, cyclin D3 and decreasing the expression of CDK4, CDK6 in A2780 cells. In OVCAR-3 cells, olaparib induce senescence by increasing the expression of RB806 and decreasing the expression of P53 and CDK4. The senescent cell lost the reaction ability of mitogen and the ability of DNA synthesis, it cannot enter the S phase to start the replication of chromosomes to complete the proliferation. Thus, the G1 phase is blocked during the cell cycle, resulting in the proportion of G0/G1 phase increase. These changes in the expression of the cell cycle-regulating proteins suggested that olaparib may inhibit proliferation of ovarian cancer cells by inducing cellular senescence through P16-RB/P53-RB signaling pathway (Fig. 6).
Olaparib induced senescence in ovarian cancer
Olaparib
p16
p16-dependent pathway p53-dependent pathway
SASP Senescence
cells Cyclin D3
CDK4
p53
CDK4 CDK6
pRB
P P P
P P
pRB
P P P
P P
Ovarian cancer cells
S G2
M
Growth G1
arrest
Fig. 6. Proposed model summarizing olaparib induced senescence in ovarian cancer cells. In SKOV3 cells, olaparib increased the expression of P16 and RB, decreased the expression of cyclin D3 and CDK4. At the same time, olaparib increased the expression of P53 and RB, decreased the expression of CDK4 and CDK6 in A2780 cells. In OVCAR-3 cells, olaparib induce senescence by increasing the expression of RB806 and decreasing the expression of P53 and CDK4.These changes in the expression of proteins suggested resulting in G0/G1 phase arrest, and finally induced senescence in ovarian cancer cells through P16-RB/P53-RB signaling pathway, thereby inhibiting the malignant proliferation of ovarian cancer.
SASP, senescence-associated secretory phenotype.
Furthermore, we researched the effect of olaparib induced cellular senescence in vivo. We used a nude mouse xenograft transplantation model and primed mice by subcutaneous injection. Such a model does not develop ascites, an environment component modulating senescence and survival of different cell components (e.g., mesothelial cells) leading to cancer cell survival [31,32]. Mice treated with olaparib for 2 weeks and then tumors were examined, we found the tumor volume was reduced. It is maybe senescent secretome reprogramming enhances chemotherapy efficacy [33]. The recent vivo studies reported that the activation of senescence in ovarian cancer cells was associated with a strong SASP [34]. SASP can attract and activate immune system cells to alter ovarian cancer micro- environment, lead to immune surveillance and subsequent promote immune cell to clear senescent cells [35]. Some components of the SASP (such as IL-6, IL-8) can help the tumor- suppressive function of the senescence response [36]. Therefore, in this manuscript, the SASPs are significant increase in senescence cells (olaparib treatment groups).
In conclusion, this experiment aimed to describe the mechanisms of olaparib induced cellular senescence in ovarian cancer, and we highlight aspects of cellular senescence that could be targeted for viable cancer therapies against ovarian cancer.
REFERENCES
1. Ataseven B, Chiva LM, Harter P, Gonzalez-Martin A, du Bois A. FIGO stage IV epithelial ovarian, fallopian tube and peritoneal cancer revisited. Gynecol Oncol 2016;142:597-607.
PUBMED | CROSSREF
2. Hornsby PJ. Senescence as an anticancer mechanism. J Clin Oncol 2007;25:1852-7.
PUBMED | CROSSREF
3. Yan Q, Wajapeyee N. Exploiting cellular senescence to treat cancer and circumvent drug resistance.
Cancer Biol Ther 2010;9:166-75.
PUBMED | CROSSREF
4. Taschner-Mandl S, Schwarz M, Blaha J, Kauer M, Kromp F, Frank N, et al. Metronomic topotecan impedes tumor growth of MYCN-amplified neuroblastoma cells in vitro and in vivo by therapy induced senescence. Oncotarget 2016;7:3571-86.
PUBMED | CROSSREF
5. Salminen A, Ojala J, Kaarniranta K. Apoptosis and aging: increased resistance to apoptosis enhances the aging process. Cell Mol Life Sci 2011;68:1021-31.
PUBMED | CROSSREF
6. Vida A, Márton J, Mikó E, Bai P. Metabolic roles of poly(ADP-ribose) polymerases. Semin Cell Dev Biol 2017;63:135-43.
PUBMED | CROSSREF
7. Schreiber V, Dantzer F, Ame JC, de Murcia G. Poly(ADP-ribose): novel functions for an old molecule. Nat Rev Mol Cell Biol 2006;7:517-28.
PUBMED | CROSSREF
8. Phulwani NK, Kielian T. Poly (ADP-ribose) polymerases (PARPs) 1-3 regulate astrocyte activation. J Neurochem 2008;106:578-90.
PUBMED | CROSSREF
9. Ricks TK, Chiu HJ, Ison G, Kim G, McKee AE, Kluetz P, et al. Successes and challenges of PARP inhibitors in cancer therapy. Front Oncol 2015;5:222.
PUBMED | CROSSREF
10. Löser DA, Shibata A, Shibata AK, Woodbine LJ, Jeggo PA, Chalmers AJ. Sensitization to radiation and alkylating agents by inhibitors of poly(ADP-ribose) polymerase is enhanced in cells deficient in DNA double-strand break repair. Mol Cancer Ther 2010;9:1775-87.
PUBMED | CROSSREF
11. De Vos M, Schreiber V, Dantzer F. The diverse roles and clinical relevance of PARPs in DNA damage repair:
current state of the art. Biochem Pharmacol 2012;84:137-46.
PUBMED | CROSSREF
14/16 https://ejgo.org https://doi.org/10.3802/jgo.2019.30.e26
12. Kim G, Ison G, McKee AE, Zhang H, Tang S, Gwise T, et al. FDA approval summary: olaparib
monotherapy in patients with deleterious germline BRCA-mutated advanced ovarian cancer treated with three or more lines of chemotherapy. Clin Cancer Res 2015;21:4257-61.
PUBMED | CROSSREF
13. Dale Rein I, Solberg Landsverk K, Micci F, Patzke S, Stokke T. Replication-induced DNA damage after PARP inhibition causes G2 delay, and cell line-dependent apoptosis, necrosis and multinucleation. Cell Cycle 2015;14:3248-60.
PUBMED | CROSSREF
14. Lheureux S, Lai Z, Dougherty BA, Runswick S, Hodgson DR, Timms KM, et al. Long-term responders on olaparib maintenance in high-grade serous ovarian cancer: clinical and molecular characterization. Clin Cancer Res 2017;23:4086-94.
PUBMED | CROSSREF
15. Gelmon KA, Tischkowitz M, Mackay H, Swenerton K, Robidoux A, Tonkin K, et al. Olaparib in patients with recurrent high-grade serous or poorly differentiated ovarian carcinoma or triple-negative breast cancer: a phase 2, multicentre, open-label, non-randomised study. Lancet Oncol 2011;12:852-61.
PUBMED | CROSSREF
16. Ledermann J, Harter P, Gourley C, Friedlander M, Vergote I, Rustin G, et al. Olaparib maintenance therapy in platinum-sensitive relapsed ovarian cancer. N Engl J Med 2012;366:1382-92.
PUBMED | CROSSREF
17. Fong PC, Yap TA, Boss DS, Carden CP, Mergui-Roelvink M, Gourley C, et al. Poly(ADP)-ribose polymerase inhibition: frequent durable responses in BRCA carrier ovarian cancer correlating with platinum-free interval. J Clin Oncol 2010;28:2512-9.
PUBMED | CROSSREF
18. Audeh MW, Carmichael J, Penson RT, Friedlander M, Powell B, Bell-McGuinn KM, et al. Oral poly(ADP- ribose) polymerase inhibitor olaparib in patients with BRCA1 or BRCA2 mutations and recurrent ovarian cancer: a proof-of-concept trial. Lancet 2010;376:245-51.
PUBMED | CROSSREF
19. Mateo J, Moreno V, Gupta A, Kaye SB, Dean E, Middleton MR, et al. An adaptive study to determine the optimal dose of the tablet formulation of the PARP inhibitor olaparib. Target Oncol 2016;11:401-15.
PUBMED | CROSSREF
20. Bernardes de Jesus B, Blasco MA. Assessing cell and organ senescence biomarkers. Circ Res 2012;111:97-109.
PUBMED | CROSSREF
21. Gonzalez LC, Ghadaouia S, Martinez A, Rodier F. Premature aging/senescence in cancer cells facing therapy: good or bad? Biogerontology 2016;17:71-87.
PUBMED | CROSSREF
22. Childs BG, Baker DJ, Kirkland JL, Campisi J, van Deursen JM. Senescence and apoptosis: dueling or complementary cell fates? EMBO Rep 2014;15:1139-53.
PUBMED | CROSSREF
23. He S, Sharpless NE. Senescence in health and disease. Cell 2017;169:1000-11.
PUBMED | CROSSREF
24. Schmitt CA, Fridman JS, Yang M, Lee S, Baranov E, Hoffman RM, et al. A senescence program controlled by p53 and p16INK4a contributes to the outcome of cancer therapy. Cell 2002;109:335-46.
PUBMED | CROSSREF
25. Rayess H, Wang MB, Srivatsan ES. Cellular senescence and tumor suppressor gene p16. Int J Cancer 2012;130:1715-25.
PUBMED | CROSSREF
26. Kailong L, Du X, Yani H, Lin Z, Jvrong Y, Ruihua S, et al. P53-Rb signaling pathway is involved in tubular cell senescence in renal ischemia/reperfusion injury. Biocell 2007;31:213-23.
PUBMED
27. Kim KW, Ha KY, Lee JS, Na KH, Kim YY, Woo YK. Senescence of nucleus pulposus chondrocytes in human intervertebral discs. Asian Spine J 2008;2:1-8.
PUBMED | CROSSREF
28. Campisi J. Senescent cells, tumor suppression, and organismal aging: good citizens, bad neighbors. Cell 2005;120:513-22.
PUBMED | CROSSREF
29. Wang H, Nicolay BN, Chick JM, Gao X, Geng Y, Ren H, et al. The metabolic function of cyclin D3-CDK6 kinase in cancer cell survival. Nature 2017;546:426-30.
PUBMED | CROSSREF
Olaparib induced senescence in ovarian cancer
30. Ohtani N, Takahashi A, Mann DJ, Hara E. Cellular senescence: a double-edged sword in the fight against cancer. Exp Dermatol 2012;21 Suppl 1:1-4.
PUBMED | CROSSREF
31. Pakuła M, Mikuła-Pietrasik J, Stryczyński Ł, Uruski P, Szubert S, Moszyński R, et al. Mitochondria- related oxidative stress contributes to ovarian cancer-promoting activity of mesothelial cells subjected to malignant ascites. Int J Biochem Cell Biol 2018;98:82-8.
PUBMED | CROSSREF
32. Mikuła-Pietrasik J, Uruski P, Matuszkiewicz K, Szubert S, Moszyński R, Szpurek D, et al. Ovarian cancer- derived ascitic fluids induce a senescence-dependent pro-cancerogenic phenotype in normal peritoneal mesothelial cells. Cell Oncol (Dordr) 2016;39:473-81.
PUBMED | CROSSREF
33. Toso A, Revandkar A, Di Mitri D, Guccini I, Proietti M, Sarti M, et al. Enhancing chemotherapy efficacy in Pten-deficient prostate tumors by activating the senescence-associated antitumor immunity. Cell Reports 2014;9:75-89.
PUBMED | CROSSREF
34. Rodier F. Detection of the senescence-associated secretory phenotype (SASP). Methods Mol Biol 2013;965:165-73.
PUBMED | CROSSREF
35. Chien Y, Scuoppo C, Wang X, Fang X, Balgley B, Bolden JE, et al. Control of the senescence-associated secretory phenotype by NF-κB promotes senescence and enhances chemosensitivity. Genes Dev 2011;25:2125-36.
PUBMED | CROSSREF
36. Loaiza N, Demaria M. Cellular senescence and tumor promotion: is aging the key? Biochim Biophys Acta 2016;1865:155-67.
PUBMED
16/16 https://ejgo.org https://doi.org/10.3802/jgo.2019.30.e26