Prevalence and Risk Factor of Neck Pain in Elderly Korean Community Residents
Neck pain is a common musculoskeletal condition, which causes substantial medical cost.
In Korea, prevalence of neck pain in community based population, especially in elderly subjects, has scarcely been reported. We evaluated the prevalence, the severity and the risk factors of neck pain in elderly Korean community residents. Data for neck pain were collected for 1,655 subjects from a rural farming community. The point, 6-months and cumulative lifetime prevalence of neck pain was obtained in addition to the measurement of the severity of neck pain. The mean age of the study subjects was 61 yr and 57% were females. The lifetime prevalence of neck pain was 20.8% with women having a higher prevalence. The prevalence did not increase with age, and the majority of individuals had low-intensity/low-disability pain. Subjects with neck pain had a significantly worse SF-12 score in all domains except for mental health. The prevalence of neck pain was significantly associated with female gender, obesity and smoking. This is the first large-scale Korean study estimating the prevalence of neck pain in elderly population. Although the majority of individuals had low-intensity/low-disability pain, subjects with neck pain had a significantly worse SF-12 score indicating that neck pain has significant health impact.
Key Words: Neck Pain; Prevalence; Risk Factors Kyeong Min Son,1,* Nam H. Cho,2,*
Seung Hun Lim,2 and Hyun Ah Kim1
1Department of Internal medicine, Hallym University College of Medicine, Chuncheon; 2Department of Preventive Medicine, Ajou University School of Medicine, Suwon, Korea
*Kyeong Min Son and Nam H. Cho contributed equally to this work.
Received: 21 December 2012 Accepted: 28 February 2013 Address for Correspondence:
Hyun Ah Kim, MD
Division of Rheumatology, Department of Internal Medicine, Hallym University Sacred Heart Hospital, 22 Gwanpyeong-ro, 170beon-gil, Dongan-gu, Anyang 431-070, Korea Tel: +82.31-380-1826, Fax: +82.31-381-8812 E-mail: [email protected]
This study was supported by a grant from the National Genome Research Institute, the Korean Center for Disease Control and Prevention (contract #2001~2003-348-6111-221, 2004-347- 6111-213 and 2005-347-2400-2440-215) and by a grant from the Korea Health Technology R&D Project, Ministry of Health &
Welfare, Republic of Korea (2011-A110274, A100736).
http://dx.doi.org/10.3346/jkms.2013.28.5.680 • J Korean Med Sci 2013; 28: 680-686
INTRODUCTION
Neck pain is a common musculoskeletal condition, which causes work absenteesism, disability, and substantial medical cost. In a cohort study in Ontario, the estimated percentage of lost time for claimants with neck pain was 11.3% and male workers be- tween the ages of 20 and 39 yr were the most likely to experi- ence an episode of work absenteeism caused by neck pain (1).
Neck pain is usually mild and does not result in major disability in most cases, but significant correlations between neck pain intensity and disability are present (2). The cost incurred by neck pain in the Netherlands was estimated to be about 1% of the total health care expenditure or 0.1% of the Dutch gross do- mestic product (3). The overall prevalence of neck pain in gen- eral population ranges between 0.4% and 86.8% (mean 23.1%), the point prevalence ranges from 0.4% to 41.5% (mean 14.45%) and 1-yr prevalence from 4.8% and 79.5% (mean 25.8%)(4). The wide variation of prevalence likely results from the differences in definition of neck pain or population studied with different genetic and environmental factors. Most studies show higher incidence of neck pain among women and in the age between 35-49 yr-old (4, 5). Although prevalence of neck pain may differ
according to additional factors, such as lifestyle and ethnicity, it has been scarcely reported in Asia compared to Western coun- tries (4).
In Korea, prevalence of neck pain in community based pop- ulation, especially in older subjects, has scarcely been reported.
In this study, we evaluated the prevalence, the severity and the risk factors of neck pain in middle-to-old age Korean commu- nity residents.
MATERIALS AND METHODS Study population
All subjects in the present study were recruited from the An- seong community cohort. Anseong is a rural area located 75 km south of Seoul and more than half of the population live agri- culture. The Anseong cohort was established for a large scale community based epidemiological study of chronic disease in Korea. The age distribution of subjects is 38.6% in their 60s.The methods of the present study have been described previously (6). Briefly, the eligibility criteria included age of 40-79 yr, resi- dence within the borders of the survey area for at least 6 months before the survey, and mental and physical ability to participate.
Cluster sampling using a bracket survey method was conduct- ed among 132,906 residents in Anseong. Subjects were selected using a random sampling method and the local telephone di- rectory from 2007 to 2008. After excluding 846 subjects who were ineligible or who refused to participate in the neck pain study, data for neck pain were available for 1,655 subjects.
Data collection
Demographic information was collected at baseline and in- cluded educational attainment, occupation, exercise, and co- morbidities using a standard questionnaire during a face-to- face interview. Educational attainment was dichotomized into
≥ 12 yr (finished high school, finished vocational school, some college, finished college, some graduate school and higher) or
< 12 yr for the analysis. Occupation was classified into 14 stan- dard categories according to the Korean National Statistical Of- fice. Occupations including factory worker, laborer, and farmer were defined as manual work. The exercise category was self- reported and classified as none, once per week, 2-3 times per week, and daily. The data on self reported hand or knee arthri- tis were collected from the responses to the following question:
Have you ever been diagnosed with hand (or knee) arthritis by a physician? Height (cm) and body weight (kg) were measured to the nearest 0.1 cm and 0.1 kg, respectively, with the subject wearing light clothing and barefooted for calculation of the body mass index (BMI). A BMI ≥ 30 kg/m2 was defined as obese. The presence of diabetes mellitus (DM) was defined as either a fast- ing glucose level ≥ 126 mg/dL or a 2-h glucose level of ≥ 200 mg/dL after 75 mg of oral glucose loading. The presence of hy- pertension was defined as either a systolic pressure ≥ 140 mmHg or a diastolic pressure ≥ 90 mmHg after measuring the blood pressure with a sphygomomanometer, with the second and third of three measurements averaged to estimate the systolic and diastolic pressure.
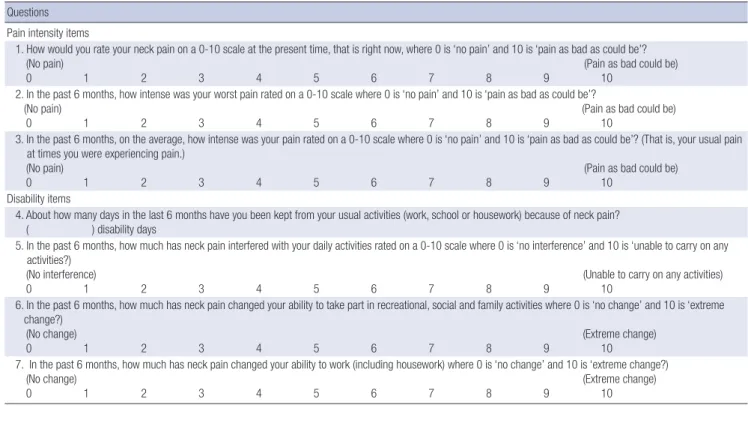
The point, 6-month, and cumulative lifetime prevalence of neck pain were obtained using a direct questionnaire. A man- nequin diagram was used to define the anatomical location of cervical pain. For the point prevalence, the question read, “Do you have neck pain at the present time, that is, right now?” The 6-month and lifetime prevalence questions read, “During the last 6 months, have you had neck pain lasting more than a day?”
and “In your lifetime, have you ever had neck pain lasting more than a day?” Neck pain on the mannequin diagram was veri- fied as that in the area from the occiput to third thoracic verte- bra and included the trapezius but not the shoulder joint. Addi- tionally, the Chronic Pain Questionnaire, a measure of graded severity of neck pain, was used (7, 8). The Chronic Pain Ques- tionnaire has been demonstrated to have good psychometric properties in the general population as well as in patients with low back pain, headache, and temporomandibular joint disor- ders (9). The questionnaire is a seven-item Guttman scale that
was developed to classify pain in population-based and prima- ry health care surveys with three items assessing pain intensity and four items assessing disability over the previous 6 months.
Pain intensity is rated from 0 to 10, according to the following variables: 1) today’s pain, 2) the worst pain in the last 6 months, and 3) the average pain experienced in the last 6 months. Three disability questions measure the interference over the past 6 months caused by neck pain and are rated from 0 to 10 with re- spect to the following: work; recreational, social, and family ac- tivities; and daily activities. One disability question measures the number of days in the past 6 months that the respondent had been kept from usual activities due to neck pain (work, school, or housework). Five grades of pain severity are derived from the aggregate score of pain intensity (ranging from 0 to 100) and the number of disability points (ranging from 0 to 6), which are derived from the three disability scores and the num- ber of disability days (Table 1, 2) (10). Subjects also filled out the SF-12 questionnaire, which measures self reported health sta- tus and quality of life (QoL).
Statistical analyses
For a comparison between the normal subjects and those with neck pain, continuous variables were tested using Student’s t- test, and categorical variables were tested using Pearson’s chi- square test. Odds ratios (ORs) and 95% confidence intervals (CIs) for neck pain risk factors were calculated using multivari- ate logistic regression analysis with adjustments made for the factors significantly associated with neck pain in the univariate analysis.
For comparison of QoL measures assessed by SF-12, adjust- ments for confounding factors were made using ANOVA with multiple classification analysis. Neck pain was used as the de- pendent variable with adjustments made for age, body mass index, education, manual occupation, exercise, smoking, alco- hol, marital status, and the presence of diabetes mellitus. Statis- tical analyses were performed using the SPSS software (ver. 12.0;
SPSS Inc., Chicago, IL,USA). A P value < 0.05 (2 tailed) was con- sidered to indicate statistical significance.
Ethics statement
The ethics committees of the Korean Health and Genome Study and the institutional review board of Ajou University School of Medicine approved the study pro tocol (approval number AJIRB- CRO-07-012). Written informed consent was obtained from each participant.
RESULTS
Table 3 shows the baseline characteristics of the study partici- pants. The mean age of the study subjects was 61.4 ± 8.7 yr and 57.4% were females. Table 4 shows the lifetime, point, and 6-
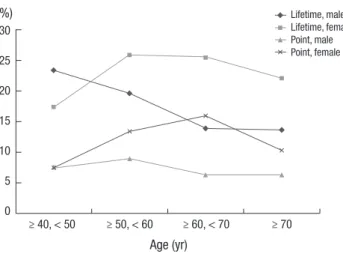
month prevalence of neck pain. The lifetime prevalence of neck pain was 20.8% in this cohort, with women having a higher pre- valence than men except for those among 40-50 yr-old group.
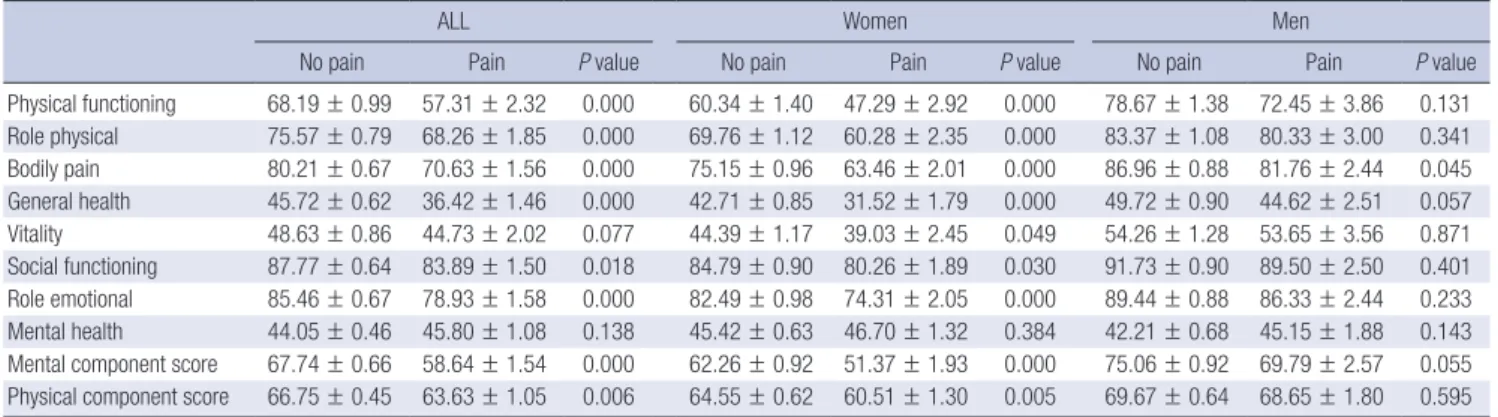
The point and 6-month prevalence was also higher among wo- men. The lifetime and point prevalence did not increase with age in both genders (Fig. 1). The distribution of neck pain sever- ity grade, measured using the Chronic Pain Questionnaire, was 77.1%, 17.4%, and 5.5% for grade 1, grade 2, and grade 3-4, re- spectively, showing that the majority of individuals had low-in- tensity/low-disability pain. The prevalence of neck pain ≥ grade 3 was highest in 40-50 yr-old male group (Fig. 2). Subjects with neck pain had significantly worse SF-12 scores in all domains
except for vitality and mental health after adjustment of con- founders (Table 5). It is of note that neck pain significantly af- fected QoL only among women. Next, we evaluated risk factors associated with the presence of neck pain. The 6-month preva- lence of neck pain, after adjustment of multiple confounders, was significantly associated with female gender and the pres- ence of obesity (Table 6). Lifetime prevalence of neck pain was significantly associated with female gender (adjusted OR, 2 [1.36-2.95], P value = 0.000), the presence of obesity (adjusted OR, 1.87 [1.15-3.04], P value = 0.011) and smoking (adjusted OR,1.5 [1.01-2.23], P value = 0.045), and the point prevalence of neck pain was significantly associated with female gender (ad- Table 1. Questionnaires for grading chronic pain severity
Questions Pain intensity items
1. How would you rate your neck pain on a 0-10 scale at the present time, that is right now, where 0 is ‘no pain’ and 10 is ‘pain as bad as could be’?
(No pain) (Pain as bad could be) 0 1 2 3 4 5 6 7 8 9 10
2. In the past 6 months, how intense was your worst pain rated on a 0-10 scale where 0 is ‘no pain’ and 10 is ‘pain as bad as could be’?
(No pain) (Pain as bad could be) 0 1 2 3 4 5 6 7 8 9 10
3. In the past 6 months, on the average, how intense was your pain rated on a 0-10 scale where 0 is ‘no pain’ and 10 is ‘pain as bad as could be’? (That is, your usual pain at times you were experiencing pain.)
(No pain) (Pain as bad could be) 0 1 2 3 4 5 6 7 8 9 10
Disability items
4. About how many days in the last 6 months have you been kept from your usual activities (work, school or housework) because of neck pain?
( ) disability days
5. In the past 6 months, how much has neck pain interfered with your daily activities rated on a 0-10 scale where 0 is ‘no interference’ and 10 is ‘unable to carry on any activities?)
(No interference) (Unable to carry on any activities) 0 1 2 3 4 5 6 7 8 9 10
6. In the past 6 months, how much has neck pain changed your ability to take part in recreational, social and family activities where 0 is ‘no change’ and 10 is ‘extreme change?)
(No change) (Extreme change) 0 1 2 3 4 5 6 7 8 9 10
7. In the past 6 months, how much has neck pain changed your ability to work (including housework) where 0 is ‘no change’ and 10 is ‘extreme change?) (No change) (Extreme change) 0 1 2 3 4 5 6 7 8 9 10
Table 2. Methods of grading chronic pain severity
Disability point
Disability days (0-180) Disability score (0-100)
0-6 days 0 point 0-29 0 point
7-14 days 1 point 30-49 1 point
15-30 days 2 point 50-69 2 point
31+ days 3 point 70+ 3 point
Grade Definition
Grade 0 (pain free) No pain problem (prior 6 months)
Grade I (Low disability-low intensity) Characteristic pain intensity less than 50, and less than 3 disability points Grade II (Low disability-high intensity) Characteristic pain intensity of 50 or greater, and less than 3 disability points Grade III (High disability-moderately limiting) 3-4 Disability points, regardless of characteristic pain intensity
Grade IV (High disability-severely limiting) 5-6 Disability points, regardless of characteristic pain intensity
Scoring methods: Characteristic pain intensity is a 0-100 score derived from question 1-3 on Table 1 during last 6 months; mean (pain right row, worst pain, average pain) × 10.
Disability score is a 0-100 score derived from question 5-7 on Table 1 during last 6 months; mean (daily activity, social activities, work activities) × 10. Disability points add the indicated points for disability days (question 4 on Table 1) and for disability score.
Table 3. Baseline characteristics of the subjects
Variables Subjects
(n = 1,655) Men
(n = 704) Women (n = 951) Age (yr, mean ± SD) 61.4 ± 8.75 61.1 ± 8.83 61.7 ± 8.69 Body mass index (kg/m2, mean ± SD) 24.5 ± 3.26 23.7 ± 3.05 25.0 ± 3.29
Education ≥ 12 yr 337 (20.4) 241 (34.2) 96 (10.1)
Manual occupation 472 (28.5) 107 (15.2) 365 (38.4)
Regular exercise 570 (34.4) 249 (35.4) 321 (33.8)
Previous or current smoker 319 (19.3) 300 (42.6) 19 (2.0)
Alcohol 668 (40.4) 482 (68.5) 186 (19.6)
Married 1,381 (83.4) 663 (94.2) 718 (75.5)
Diabetes Mellitus 356 (21.5) 137 (19.5) 219 (23.0)
Hypertension 303 (18.3) 96 (13.6) 207 (21.8)
Self-reported hand or knee arthritis 780 (47.1) 255 (36.2) 525 (55.2) Except where indicated otherwise, values are number (%). The body-mass index is the weight in kilograms divided by the square of the height in meters. Manual occu- pation was defined as work demanding physical exertion (factory worker, laborer and farmer). Regular exercise was defined as self-reported exercise more than 3 times per week.
Table 4. Prevalence of neck pain
Life time prevalence Point prevalence 6-Month prevalence
No. % (95% Cl) No. % (95% Cl) No. % (95% Cl)
Men (n = 704) 119 16.9 (16.1-17.7) 70 7.3 (6.9-7.7) 84 11.9 (11.3-12.5)
Women (n = 951) 226 23.8 (22.6-25.0) 152 12.4 (11.8-13.0) 178 18.7 (17.8-19.6)
All (n = 1,655) 345 20.8 (19.8-21.8) 222 10.1 (9.6-10.6) 262 15.8 (15.0-16.6)
95% confidence interval (CI) was calculated with the use of the modified Wald method.
Fig. 1. Life time and point prevalence of neck pain according to age and gender.
≥ 40, < 50
Age (yr)
≥ 50, < 60 ≥ 60, < 70 ≥ 70 30
25 20 15 10 5 0
(%) Lifetime, male
Lifetime, female Point, male Point, female
Fig. 2. The distribution of severe neck pain severity grade over previous 6 months according to age and gender.
≥ 40, < 50
Age (yr)
≥ 50, < 60 ≥ 60, < 70 ≥ 70 4
3
2
1
0
(%) Grade 3-4, male
Grade 3-4, female
justed OR, 2.92 [1.69-5.06], P value = 0.000) and smoking (ad- justed OR, 1.96 [1.13-3.4], P value = 0.017).
DISCUSSION
In this study, we found that the prevalence of lifetime, point and 6 month prevalence of neck pain was 20.8%, 10.1%, and 15.8% in a Korean farming community. The presence of neck pain led to significant deterioration of QOL as measured with SF-12. Female gender, obesity and smoking were significantly
associated with neck pain after adjustment of confounders. To our knowledge, this is the first Korean study estimating the prev- alence of neck pain in elderly community population.
The prevalence of neck pain in our subjects is lower than that previously reported among Western population (3, 4). It is re- ported that the prevalence of neck pain increases until around late 40s, after which it begins to decline (3-5). Thus, the lower risk in our study population may reflect the fact that our study included older subjects. In a study among subjects with similar age to ours, 20.5% prevalence for neck pain is reported (11).
In our study, prevalence of neck pain among women was higher than among men, except for the prevalence in 40-50 yr- old group. In other studies, higher prevalence of neck pain among women is also reported (5). This can be explained by the gener- al tendency of higher prevalence of musculoskeletal complaints among women, and more specifically, biological factor such as lower strength of shoulder girdle muscle among women (12- 16). Higher prevalence of musculoskeletal pain among women is explained by 3 factors : 1) women are more willing to report musculoskeletal pain; 2) women are more exposed to risk fac- tors for musculoskeletal pain (exposure model); and 3) women are more vulnerable to develop musculoskeletal pain meaning that women react in different way to risk factors for musculosk- eletal pain (vulnerability model) (17). The gender difference in vulnerability may be due to sex-linked biologic factors (hor- mones or physiology), difference in pain sensitivity, or differ- ence in social or psychological factors.
Unlike in older age groups, the prevalence of neck pain and neck pain ≥ grade 3 in 40-50 yr-old group was higher in men than in women in our study. In this age group, men may be ex- posed to more mechanical stress aggravating the neck pain such as working with arms raised to or above shoulder level (18), al- though we could not make the analyses on the specific type of work activities in our study.
It is of note that only female subjects with neck pain had a significantly worse SF-12 score. In other studies examining the association between neck pain and health related quality of life (HRQoL), worse physical and mental HRQoL among subjects with neck pain has also been reported, implying significant health impact (19, 20). On the other hand, another recent study showed that most of the observed association between neck pain and HRQoL is attributable to comorbidities (21). While the differential influence of neck pain on QOL according to gender has not been reported previously, QoL as measured with SF-36 was reported to be significantly worse in females in other mus- culoskeletal problems such as low back pain and symptomatic peripheral osteoarthritis (22). SF-12 scores tended to be lower
in females compared to males even in subjects without neck pain, and it is postulated that instrument for measuring QoL, such as SF-12 captures deterioration in QoL more sensitively among females. Among risk factors identified, female gender was significantly associated with all aspects of neck pain (point, lifetime, and 6-month). Obesity was associated with 6-month and lifetime prevalence of neck pain, while smoking was asso- ciated with lifetime and point prevalence. It is notable that in contrast to lower back pain, age was not significantly associated with neck pain (23). This result is in line with previous data show- ing that the prevalence of neck pain peaks in the middle age and declines in later life (5). It can be speculated that compared to lower back pain, neck pain may be less affected by the pro- gression of age-related degenerative change in the spine. The association of obesity with neck pain was also reported in pre- vious studies (24, 25). Compared to other weight-bearing joints, such as the knee and lumbar spine, neck may be less vulnera- ble to adverse biomechanical effect stemming from obesity. On the other hand, metabolic factors might be responsible for neck pain as in generalized osteoarthritis (26). A study examining Table 5. Quality of life measured with SF-12 among subjects with and without neck pain during last 6 months
ALL Women Men
No pain Pain P value No pain Pain P value No pain Pain P value
Physical functioning 68.19 ± 0.99 57.31 ± 2.32 0.000 60.34 ± 1.40 47.29 ± 2.92 0.000 78.67 ± 1.38 72.45 ± 3.86 0.131 Role physical 75.57 ± 0.79 68.26 ± 1.85 0.000 69.76 ± 1.12 60.28 ± 2.35 0.000 83.37 ± 1.08 80.33 ± 3.00 0.341 Bodily pain 80.21 ± 0.67 70.63 ± 1.56 0.000 75.15 ± 0.96 63.46 ± 2.01 0.000 86.96 ± 0.88 81.76 ± 2.44 0.045 General health 45.72 ± 0.62 36.42 ± 1.46 0.000 42.71 ± 0.85 31.52 ± 1.79 0.000 49.72 ± 0.90 44.62 ± 2.51 0.057 Vitality 48.63 ± 0.86 44.73 ± 2.02 0.077 44.39 ± 1.17 39.03 ± 2.45 0.049 54.26 ± 1.28 53.65 ± 3.56 0.871 Social functioning 87.77 ± 0.64 83.89 ± 1.50 0.018 84.79 ± 0.90 80.26 ± 1.89 0.030 91.73 ± 0.90 89.50 ± 2.50 0.401 Role emotional 85.46 ± 0.67 78.93 ± 1.58 0.000 82.49 ± 0.98 74.31 ± 2.05 0.000 89.44 ± 0.88 86.33 ± 2.44 0.233 Mental health 44.05 ± 0.46 45.80 ± 1.08 0.138 45.42 ± 0.63 46.70 ± 1.32 0.384 42.21 ± 0.68 45.15 ± 1.88 0.143 Mental component score 67.74 ± 0.66 58.64 ± 1.54 0.000 62.26 ± 0.92 51.37 ± 1.93 0.000 75.06 ± 0.92 69.79 ± 2.57 0.055 Physical component score 66.75 ± 0.45 63.63 ± 1.05 0.006 64.55 ± 0.62 60.51 ± 1.30 0.005 69.67 ± 0.64 68.65 ± 1.80 0.595 Data were adjusted for age, body mass index, education, manual occupation, exercise, smoking, alcohol, marital status and the presence of diabetes mellitus.
Table 6. Risk Factors of neck pain during last 6 months
6-Month odds ratio (95% CI)
P value Unadusted OR P value Adjusted OR*
Age
≥ 50, < 60 (vs ≥ 40, < 50)
≥ 60, < 70 (vs ≥ 40, < 50)
≥ 70 (vs ≥ 40, < 50)
0.442 0.280 0.345 0.994
1.28 (0.82-2.02) 1.24 (0.79-1.93) 1.00 (0.62-1.61)
0.264 0.255 0.745 0.630
1.33 (0.82-2.16) 1.09 (0.65-1.84) 0.87 (0.48-1.55)
Female 0.000 1.70 (1.28-2.25) 0.000 2.27 (1.46-3.52)
Hypertenson 0.037 1.41 (1.02-1.94) 0.103 1.35 (0.94-1.92)
Obesity 0.003 2.09 (1.28-3.41) 0.015 1.89 (1.13-3.17)
Alcohol 0.064 0.77 (0.59-1.02) 0.767 0.95 (0.67-1.34)
Smoking 0.565 0.90 (0.64-1.27) 0.095 1.48 (0.93-2.33)
Exercise 0.317 0.87 (0.65-1.15) 0.265 0.84 (0.62-1.14)
Diabetes mellitus 0.327 1.17 (0.85-1.60) 0.707 1.07 (0.76-1.50)
Osteoporosis 0.253 1.17 (0.89-1.54) 0.248 0.81 (0.57-1.15)
Manual work 0.734 0.95 (0.71-1.27) 0.844 1.03 (0.75-1.42)
Self-reported hand, knee arthritis 0.289 1.16 (0.88-1.51) 0.695 1.07 (0.77-1.48)
*Adjustments made for the factors significantly associated with neck pain in the univariate analysis.
the association between the metabolic syndrome and persis- tent chronic pain syndromes showed that hypothalamus-pitu- itary-adrenal stress axis dysfunction plays a role (27). The asso- ciation between smoking and neck pain was also reported in other studies (24, 28). Palmer et al. (29) suggested that this as- sociation could arise from a pharmacological effect of tobacco smoke (for example, on neurological processing of sensory in- formation or nutrition of peripheral tissues); another possibility is that people with a lower threshold for reporting pain and dis- ability are more likely to take up and continue smoking.
Our study has strengths and limitation. This is the first large scale epidemiological study exploring the prevalence and risk factors of neck pain in Korea. We included elderly, rural com- munity based subjects, an underrepresented population in the neck pain research. On the other hand, due to restraint in the budget, we could not take radiographs of cervical spine for our study subjects, so the influence of degenerative change in the cervical spine on neck pain could not be examined. Because of the cross-sectional design, the risk factors verified in our study merely indicates an association and not the definite cause and effect relationship.
In conclusion, this is the first large-scale Korean study esti- mating the prevalence of neck pain in elderly population. Life- time prevalence of neck pain was 20.8% in our subjects with women having a higher prevalence. Although the majority of individuals had low-intensity/low-disability pain, subjects with neck pain had a significantly worse SF-12 score indicating that neck pain has significant health impact.
DISCLOSURE
The authors have no conflicts of interest to disclose.
REFERENCES
1. Côté P, Kristman V, Vidmar M, Van Eerd D, Hogg-Johnson S, Beaton D, Smith PM. The prevalence and incidence of work absenteeism involving neck pain: a cohort of Ontario lost-time claimants. Spine (Phila Pa 1976) 2008; 33: S192-8.
2. Fejer R, Hartvigsen J. Neck pain and disability due to neck pain: what is the relation? Eur Spine J 2008; 17: 80-8.
3. Fejer R, Kyvik KO, Hartvigsen J. The prevalence of neck pain in the world population: a systematic critical review of the literature. Eur Spine J 2006;
15: 834-48.
4. Hoy DG, Protani M, De R, Buchbinder R. The epidemiology of neck pain.
Best Pract Res Clin Rheumatol 2010; 24: 783-92.
5. Hogg-Johnson S, van der Velde G, Carroll LJ, Holm LW, Cassidy JD, Guz- man J, Côté P, Haldeman S, Ammendolia C, Carragee E, et al. The bur- den and determinants of neck pain in the general population: results of the Bone and Joint Decade 2000-2010 Task Force on Neck Pain and Its Associated Disorders. Spine (Phila Pa 1976) 2008; 33: S39-51.
6. Cho NH, Kim S, Kwon DJ, Kim HA. The prevalence of hallux valgus and
its association with foot pain and function in a rural Korean communi- ty. J Bone Joint Surg Br 2009; 91: 494-8.
7. Von Korff M. Epidemiological and survey methods: chronic pain assess- ment. In: Turk DC, Melzack R, editors. Handbook of pain assessment.
New York: The Gilford Press, 1992, p291-408.
8. Von Korff M, Dworkin SF. Problems in measuring pain by survey: the classification of chronic pain in field research. In: Chapman CR, Loeser JD, editors. Issues in Pain Measurement. New York: Raven Press, 1989, p519-33.
9. Côté P, Cassidy JD, Carroll L. The Saskatchewan Health and Back Pain Survey: the prevalence of neck pain and related disability in Saskatche- wan adults. Spine (Phila Pa 1976) 1998; 23: 1689-98.
10. Von Korff M, Ormel J, Keefe FJ, Dworkin SF. Grading the severity of chro- nic pain. Pain 1992; 50: 133-49.
11. Thomas E, Peat G, Harris L, Wilkie R, Croft PR. The prevalence of pain and pain interference in a general population of older adults: cross-sec- tional findings from the North Staffordshire Osteoarthritis Project (Nor- StOP). Pain 2004; 110: 361-8.
12. Bingefors K, Isacson D. Epidemiology, co-morbidity, and impact on health-related quality of life of self-reported headache and musculoskel- etal pain: a gender perspective. Eur J Pain 2004; 8: 435-50.
13. Wijnhoven HA, de Vet HC, Picavet HS. Prevalence of musculoskeletal disorders is systematically higher in women than in men. Clin J Pain 2006; 22: 717-24.
14. Leboeuf-Yde C, Nielsen J, Kyvik KO, Fejer R, Hartvigsen J. Pain in the lumbar, thoracic or cervical regions: do age and gender matter? a popu- lation-based study of 34,902 Danish twins 20-71 years of age. BMC Mus- culoskelet Disord 2009; 10: 39.
15. Binderup AT, Arendt-Nielsen L, Madeleine P. Pressure pain sensitivity maps of the neck-shoulder and the low back regions in men and women.
BMC Musculoskelet Disord 2010; 11: 234.
16. Cho NH, Kim I, Lim SH, Kim HA. Prevalence of widespread pain and its influence on quality of life: population study in Korea. J Korean Med Sci 2012; 27: 16-21.
17. Wijnhoven HA, de Vet HC, Picavet HS. Explaining sex differences in chr- onic musculoskeletal pain in a general population. Pain 2006; 124: 158- 66.
18. Christensen JO, Knardahl S. Work and neck pain: a prospective study of psychological, social, and mechanical risk factors. Pain 2010; 151: 162- 73.
19. Daffner SD, Hilibrand AS, Hanscom BS, Brislin BT, Vaccaro AR, Albert TJ. Impact of neck and arm pain on overall health status. Spine (Phila Pa 1976) 2003; 28: 2030-5.
20. Luo X, Edwards CL, Richardson W, Hey L. Relationships of clinical, psy- chologic, and individual factors with the functional status of neck pain patients. Value Health 2004; 7: 61-9.
21. Rezai M, Côté P, Cassidy JD, Carroll L. The association between preva- lent neck pain and health-related quality of life: a cross-sectional analy- sis. Eur Spine J 2009; 18: 371-81.
22. Salaffi F, De Angelis R, Stancati A, Grassi W; MArche Pain; Prevalence INvestigation Group (MAPPING) study. Health-related quality of life in multiple musculoskeletal conditions: a cross-sectional population based epidemiological study: II. the MAPPING study. Clin Exp Rheumatol 2005;
23: 829-39.
23. Cho NH, Jung YO, Lim SH, Chung CK, Kim HA. The prevalence and risk
factors of low back pain in rural community residents of Korea. Spine (Phila Pa 1976) 2012; 37: 2001-10.
24. Mäkelä M, Heliövaara M, Sievers K, Impivaara O, Knekt P, Aromaa A.
Prevalence, determinants, and consequences of chronic neck pain in Finland. Am J Epidemiol 1991; 134: 1356-67.
25. Viikari-Juntura E, Martikainen R, Luukkonen R, Mutanen P, Takala EP, Riihimäki H. Longitudinal study on work related and individual risk factors affecting radiating neck pain. Occup Environ Med 2001; 58: 345- 52.
26. Sowers MR, Karvonen-Gutierrez CA. The evolving role of obesity in knee osteoarthritis. Curr Opin Rheumatol 2010; 22: 533-7.
27. McBeth J, Silman AJ, Gupta A, Chiu YH, Ray D, Morriss R, Dickens C, King Y, Macfarlane GJ. Moderation of psychosocial risk factors through dysfunction of the hypothalamic-pituitary-adrenal stress axis in the on- set of chronic widespread musculoskeletal pain: findings of a population- based prospective cohort study. Arthritis Rheum 2007; 56: 360-71.
28. Côté P, Cassidy JD, Carroll L. The factors associated with neck pain and its related disability in the Saskatchewan population. Spine (Phila Pa 1976) 2000; 25: 1109-17.
29. Palmer KT, Syddall H, Cooper C, Coggon D. Smoking and musculoskel- etal disorders: findings from a British national survey. Ann Rheum Dis 2003; 62: 33-6.