ISSN 2234-3806 • eISSN 2234-3814
268 www.annlabmed.org https://doi.org/10.3343/alm.2021.41.3.268 Ann Lab Med 2021;41:268-276
https://doi.org/10.3343/alm.2021.41.3.268
Original Article
Clinical Chemistry
Immunosuppressive Drug Measurement by Liquid Chromatography Coupled to Tandem Mass
Spectrometry: Interlaboratory Comparison in the Korean Clinical Laboratories
Hyun-Ki Kim , M.D.1, Hyung-Doo Park , M.D.2, Sang-Guk Lee , M.D.3, Hyojin Chae , M.D.4, Sang Hoon Song , M.D.5, Yong-Wha Lee , M.D.6, Yeo-Min Yun , M.D.7, Sunhyun Ahn , M.D.8, Serim Kim , M.D.9, Sun Min Lee , M.D.10, Soo-Youn Lee , M.D.2, and Sail Chun , M.D.11; on behalf of the Clinical Mass Spectrometry Research Committee of the Korean Society of Clinical Chemistry
1Department of Laboratory Medicine, University of Ulsan College of Medicine, Ulsan University Hospital, Ulsan, Korea; 2Department of Laboratory Medicine and Genetics, Samsung Medical Center, Sungkyunkwan University School of Medicine, Seoul, Korea; 3Department of Laboratory Medicine, Severance Hospital, Yonsei University College of Medicine, Seoul, Korea; 4Department of Laboratory Medicine, College of Medicine, The Catholic University of Korea, Seoul, Korea; 5Department of Laboratory Medicine, Seoul National University Hospital and College of Medicine, Seoul, Korea; 6Department of Laboratory Medicine and Genetics, Soonchunhyang University Bucheon Hospital, Soonchunhyang University College of Medicine, Bucheon, Korea; 7Department of Laboratory Medicine, Konkuk University School of Medicine, Seoul, Korea; 8Seoul Clinical Laboratories, Yongin, Korea; 9Green Cross Laboratories, Yongin, Korea; 10Department of Laboratory Medicine, Pusan National University Yangsan Hospital, Yangsan, Korea; 11Department of Laboratory Medicine, University of Ulsan College of Medicine and Asan Medical Center, Seoul, Korea
Background: Liquid chromatography coupled to tandem mass spectrometry (LC-MS/MS) is increasingly used for immunosuppressive drug tests. However, most LC-MS/MS tests are laboratory-developed and their agreement is unknown in different Korean laboratories.
This interlaboratory comparison study evaluated test reproducibility and identified poten- tial error sources.
Methods: Test samples containing three concentrations of tacrolimus, sirolimus, everoli- mus, cyclosporine, and mycophenolic acid were prepared by pooling surplus samples from patients undergoing routine therapeutic drug monitoring and tested in duplicate in the participating 10 clinical laboratories. Reconstitution and storage experiments were conducted for the commonly used commercial calibrator set. The robust estimators of re- producibility parameters were calculated. Spearman’s rank correlation coefficient (rho, ρ) was used to evaluate the correlation between drugs. Multiple linear regression was used to determine whether the experimental conditions alter the calibration curves.
Results: The reproducibility coefficient of variation exceeded 10% only for sirolimus con- centrations 1 and 2 (10.8% and 12.5%, respectively) and everolimus concentrations 1 and 2 (12.3% and 11.4%, respectively). The percent difference values showed weak cor- relations between sirolimus and everolimus (ρ=0.334, P =0.175). The everolimus calibra- tion curve slope was significantly altered after reconstitution following prolonged 5°C stor- age (P =0.015 for 14 days; P =0.025 for 28 days); the expected differences at 6 ng/mL were 0.598% for 14 days and 0.384% for 28 days.
Conclusions: LC-MS/MS test reproducibility for immunosuppressive drugs seems to be good in the Korean clinical laboratories. Continuous efforts are required to achieve test stan- dardization and harmonization, especially for sirolimus and everolimus.
Key Words: Immunosuppressive drug, Therapeutic drug monitoring, Liquid chromatogra- phy coupled to tandem mass spectrometry, Interlaboratory comparison, Sirolimus, Everoli- mus, Reproducibility
Received: May 4, 2020
Revision received: June 12, 2020 Accepted: November 17, 2020 Corresponding author: Sail Chun, M.D.
Department of Laboratory Medicine, University of Ulsan College of Medicine and Asan Medical Center, 88 Olympic-ro 43-gil, Songpa-gu, Seoul 05505, Korea
Tel: +82-2-3010-4513 Fax: +82-2-478-0884 E-mail: [email protected]
© Korean Society for Laboratory Medicine This is an Open Access article distributed under the terms of the Creative Commons Attribution Non-Commercial License (https://creativecom- mons.org/licenses/by-nc/4.0) which permits unrestricted non-commercial use, distribution, and reproduction in any medium, provided the original work is properly cited.
1 / 1 CROSSMARK_logo_3_Test
2017-03-16 https://crossmark-cdn.crossref.org/widget/v2.0/logos/CROSSMARK_Color_square.svg
Kim HK, et al.
ILC of immunosuppressant measurement by LC-MS/MS
INTRODUCTION
Immunosuppressive drugs are essential for successful trans- plantation, as they reduce the risk of rejection [1]. The five im- munosuppressive drugs most commonly prescribed for the pre- vention of graft loss and organ rejection are tacrolimus (TAC), si- rolimus (SIR), everolimus (EVE), cyclosporine (CSA), and myco- phenolic acid (MPA) [2, 3]. Calcineurin inhibitors, such as TAC, SIR, EVE, and CSA, have narrow therapeutic ranges and high interindividual pharmacokinetic variability. Therefore, therapeu- tic drug monitoring (TDM) is widely practiced to determine the dosage adjustments needed to reach target blood concentra- tions [4]. Although the utility of TDM for MPA remains contro- versial, monitoring MPA concentrations is also sometimes rec- ommended [5, 6].
Reliable measurements are essential for effective TDM of im- munosuppressive drugs. Liquid chromatography coupled to tandem mass spectrometry (LC-MS/MS) is increasingly used for TDM of immunosuppressive drugs, mainly owing to its high an- alytical specificity and the ability to perform multiplex tests [1].
However, most LC-MS/MS tests used in laboratories are devel- oped, calibrated, and validated in-house. This could lead to rel- atively poor interlaboratory agreement between independently developed tests, thus hindering the adoption of common clinical practice guidelines [7].
There are proficiency testing (PT) programs for immunosup- pressive drug TDM operated by the College of American Pathol- ogists (CAP) or the Korean Association of External Quality As- sessment Service (KEQAS). However, the CAP international PT programs do not provide nation-specific information [8], and the KEQAS PT programs included only a few participating laborato- ries using LC-MS/MS methods [9]. Therefore, the test reproduc- ibility of immunosuppressive drug TDM by LC-MS/MS in Korea is unknown. An interlaboratory comparison study could deter- mine test reproducibility across laboratories, as well as overall repeatability [10]. Interlaboratory comparisons could also con- tribute to laboratory performance improvement, with proper re- views of test practices and follow-up on the implementation of corrective actions [11-13].
We conducted an interlaboratory comparison study by includ- ing most of the clinical laboratories performing immunosuppres- sive drug TDM by LC-MS/MS in Korea and investigated calibra- tor reconstitution and storage conditions as potential error sources.
We aimed to document current practices used for immunosup- pressive drug TDM by LC-MS/MS, evaluate the reproducibility of these tests, and identify potential error sources contributing to
interlaboratory imprecision.
MATERIALS AND METHODS
Interlaboratory comparison schemeBased on the results of a previous survey of members of the Korean Society of Clinical Chemistry [14], 10 clinical laborato- ries performing immunosuppressive drug TDM by LC-MS/MS were asked to participate in this study. After enrollment, the test samples were prepared in Asan Medical Center, Seoul, Korea, dispatched to the participating laboratories on dry ice in a Styro- foam box on 23 July 2018, and reached the laboratories within two days. Participating laboratories were asked to perform the test within three days of receiving the test samples. For each test sample, participating laboratories were asked to make du- plicate aliquots for testing before the sample preparation step.
Test results and method information, including the dates of re- ception and test, calibrator, internal standard, LC manufacturer, MS manufacturer and model, and extraction method, were col- lected in a formatted Excel file. Additional surveys regarding cal- ibrator reconstitution protocols were conducted by e-mail. The data was compiled and analyzed at Asan Medical Center. The Institutional Review Board of Asan Medical Center exempted the approval for this study (reference number: 2018-1070).
Preparation of test samples
Surplus samples from patients undergoing routine TDM were pooled to achieve three different concentrations of test samples for each drug. The samples included EDTA whole blood for TAC, SIR, EVE, and CSA and EDTA plasma for MPA. The sam- ples were collected for seven days and stored at 4°C up to seven days before pooling. The samples were pooled based on their reported concentrations to achieve concentrations below, within, and above the therapeutic range of each drug. Each 1 mL pooled sample was distributed in a glass vial after mixing on a roller mixer for 1 hour. The minimum number of vials for each test sample was 10; for TAC concentration 2 (TAC-2), 30 vials were prepared to evaluate homogeneity and short-term stability.
The test samples were stored at -70°C before delivery. Thus, the samples underwent only one freeze-thaw cycle before being tested at the participating laboratories. For TAC-2, 10 vials were tested in triplicate on the day of production to evaluate homoge- neity. To evaluate short-term stability, two vials were stored at 5°C for five days and then tested for TAC in duplicate. These four results were compared with the homogeneity values. In the homogeneity assessment, a between-sample standard deviation
Kim HK, et al.
ILC of immunosuppressant measurement by LC-MS/MS
270 www.annlabmed.org https://doi.org/10.3343/alm.2021.41.3.268
<0.3S was considered acceptable. In the stability assessment, xˉ
a difference from the homogeneity mean <0.3S was considered xˉ
acceptable.
Details of participating laboratories
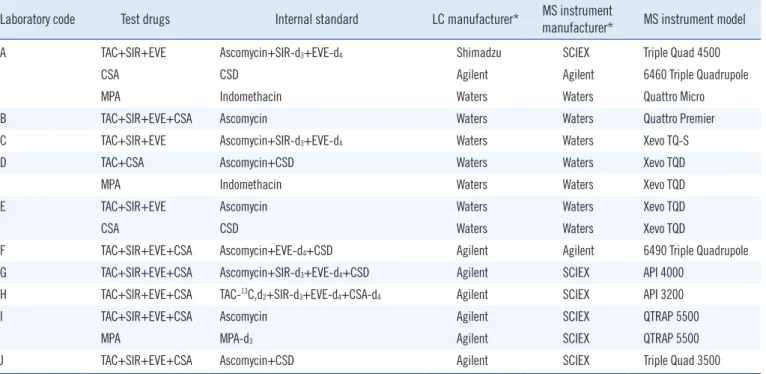
All test samples were in a frozen state on arrival at each labora- tory. Details of the methods used in each laboratory are shown in Table 1. All laboratories conducted simultaneous detection with the following combinations: TAC+SIR+EVE+CSA (six labo- ratories) and TAC+SIR+EVE (three laboratories); one laboratory (Lab F) that was supposed to perform a CSA test with a TAC+
SIR+EVE+CSA combination did not receive the CSA test sam- ples due to a communication error. In total, TAC detection was performed in 10 laboratories, SIR detection in nine laboratories, EVE detection in nine laboratories, CSA detection in eight labo- ratories, and MPA detection in three laboratories. All participat- ing laboratories used commercial calibrator sets from Chrom- systems Instruments & Chemicals GmbH (Gräfelfing, Germany).
Evaluation of calibrator reconstitution method and storage as calibration bias factors
Based on the survey results of the calibrator reconstitution meth-
ods of participating laboratories, we conducted an experiment on calibrator reconstitution and storage conditions. To evaluate the impact of the calibrator reconstitution process and prolonged storage after reconstitution, we used the lyophilized calibrator 6PLUS1 Multilevel Whole Blood Calibrator Set (Lot no. 4917;
Chromsystems Instruments & Chemicals GmbH) with six differ- ent concentrations plus one blank value. The calibrator contained TAC, SIR, EVE, and CSA; however, CSA could not be measured in the experimental test system.
The calibrators were stored at -70°C until use and then thawed at room temperature (20–25°C) for 30 minutes before adding 2.0 mL of distilled water to each vial. The contents of the vials were then mixed under two different conditions: static incuba- tion (sitting) for 30 minutes at room temperature (20–25°C) af- ter the addition of water followed by mixing on a roller for 60 min- utes (Condition A0) or mixing on a roller for 20 minutes without static incubation (Condition B0). Aliquots from these vials were tested in four replicates. Aliquots from Condition A0 vials were initially frozen at -20°C and then thawed on different days, re- sulting in four storage conditions: 42 days at -20°C (Condition A1), 35 days at -20°C and seven days at 5°C (Condition A2), 28 days at -20°C and 14 days at 5°C (Condition A3), and 14 days
Table 1. Drug measurement methods used in participating laboratories
Laboratory code Test drugs Internal standard LC manufacturer* MS instrument
manufacturer* MS instrument model
A TAC+SIR+EVE Ascomycin+SIR-d3+EVE-d4 Shimadzu SCIEX Triple Quad 4500
CSA CSD Agilent Agilent 6460 Triple Quadrupole
MPA Indomethacin Waters Waters Quattro Micro
B TAC+SIR+EVE+CSA Ascomycin Waters Waters Quattro Premier
C TAC+SIR+EVE Ascomycin+SIR-d3+EVE-d4 Waters Waters Xevo TQ-S
D TAC+CSA Ascomycin+CSD Waters Waters Xevo TQD
MPA Indomethacin Waters Waters Xevo TQD
E TAC+SIR+EVE Ascomycin Waters Waters Xevo TQD
CSA CSD Waters Waters Xevo TQD
F TAC+SIR+EVE+CSA Ascomycin+EVE-d4+CSD Agilent Agilent 6490 Triple Quadrupole
G TAC+SIR+EVE+CSA Ascomycin+SIR-d3+EVE-d4+CSD Agilent SCIEX API 4000
H TAC+SIR+EVE+CSA TAC-13C,d2+SIR-d3+EVE-d4+CSA-d4 Agilent SCIEX API 3200
I TAC+SIR+EVE+CSA Ascomycin Agilent SCIEX QTRAP 5500
MPA MPA-d3 Agilent SCIEX QTRAP 5500
J TAC+SIR+EVE+CSA Ascomycin+CSD Agilent SCIEX Triple Quad 3500
Most laboratories used precipitation with organic solvent mixture followed by centrifugation for extraction, except Lab I, which used liquid/liquid extraction.
All the participating laboratories used the commercial calibrator from Chromsystems Instruments & Chemicals GmbH (Gräfelfing, Germany).
*The manufacturer names are indicated using their short names: Agilent, Agilent Technologies (Santa Clara, CA, USA); SCIEX, AB SCIEX (Foster City, CA, USA); Shimadzu, Shimadzu Corporation (Kyoto, Japan); Waters, Waters Corporation (Milford, MA, USA).
Abbreviations: CSA, cyclosporine; CSD, cyclosporine D; EVE, everolimus; LC, liquid chromatography; MPA, mycophenolic acid; MS, mass spectrometry;
TAC, tacrolimus; SIR, sirolimus.
Kim HK, et al.
ILC of immunosuppressant measurement by LC-MS/MS
https://doi.org/10.3343/alm.2021.41.3.268 www.annlabmed.org 271
at -20°C and 28 days at 5°C (Condition A4). These aliquots were tested in duplicate on the same day.
Simultaneous quantification of TAC, SIR, and EVE was per- formed for the calibrators in the same manner as for patient sam- ples at Asan Medical Center. Briefly, 40 µL samples were pre- pared by protein precipitation using 80 µL of aqueous 0.1 M zinc sulfate and 200 µL of acetonitrile containing the internal standards. The internal standard solution consisted of ascomy- cin (Cerilliant, Round Rock, TX, USA), SIR-d3 (IsoSciences, Am- bler, PA, USA), and EVE-d4 (Cerilliant). HPLC was conducted using an ACQUITY UPLC I-Class system (Waters Corporation, Milford, MA, USA) equipped with an ACQUITY UPLC HSS SB C18 column (30 mm×2.1 mm, 4 µm; Waters Corporation). The system was operated at a flow rate of 0.2 mL/min with a column temperature of 55°C. The mobile phase for isocratic elution con- sisted of 50% methanol (HPLC grade; Merck, Darmstadt, Ger- many) and 50% ammonium acetate buffer (2 mM, pH 2.7, with
≥98% acetate ammonium; Sigma-Aldrich, St. Louis, MO, USA).
MS was detected on a Xevo TQ-S LC-MS/MS system (Waters Corporation) using positive electrospray ionization and argon as the collision gas. Peak areas were obtained by multiple reaction monitoring of the following mass transitions for quantification:
TAC (m/z 821.5 >768.5), SIR (m/z 931.6 >864.6), EVE (m/z 975.7 >908.6), ascomycin (m/z 809.5 >756.5), SIR-d3 (m/z 934.6>864.6), and EVE-d4 (m/z 979.7>912.6). Response val- ues were calculated using the resultant peak areas (area of ana- lyte/area of internal standard). LC-MS/MS analysis and data ac- quisition were managed using Masslynx software version 4.1 (Waters Corporation). TargetLynx software version 4.1 (Waters Corporation) was used for chromatographic peak detection and baseline determination.
Statistical analysis
Data from the participating laboratories were used to estimate test reproducibility. The repeatability standard deviation (Sr) is the root mean square value of all differences in wi, where wi is the difference between the duplicate measurement results in the ith laboratory and the number of participating laboratories is p:
11
acetate ammonium; Sigma-Aldrich, St. Louis, MO, USA). MS was detected on a Xevo TQ-S LC- 180
MS/MS system (Waters Corporation) using positive electrospray ionization and argon as the 181
collision gas. Peak areas were obtained by multiple reaction monitoring of the following mass 182
transitions for quantification: TAC (m/z 821.5 > 768.5), SIR (m/z 931.6 > 864.6), EVE (m/z 975.7 183
> 908.6), ascomycin (m/z 809.5 > 756.5), SIR-d3 (m/z 934.6 > 864.6), and EVE-d4 (m/z 979.7 >
184
912.6). Response values were calculated using the resultant peak areas (area of analyte/area of 185
internal standard). LC-MS/MS analysis and data acquisition were managed using Masslynx 186
software version 4.1 (Waters Corporation). TargetLynx software version 4.1 (Waters Corporation) 187
was used for chromatographic peak detection and baseline determination.
188 189
Statistical analysis 190
Data from the participating laboratories were used to estimate test reproducibility. The 191
repeatability standard deviation (𝑆𝑆�) is the root mean square value of all differences in 𝑤𝑤�, where 192
𝑤𝑤� is the difference between the duplicate measurement results in the ith laboratory and the number 193
of participating laboratories is 𝑝𝑝:
194
𝑆𝑆�� � ��𝑤𝑤�� 𝑝𝑝
�
���
195
The standard deviation of the sample averages
12
The standard deviation of the sample averages (𝑆𝑆�̅) is:
196
𝑆𝑆�̅� �� 𝑑𝑑��
�
���
/�� � ��
197
where 𝑑𝑑�� 𝑥𝑥̅�� 𝑥𝑥̿ and the average of the duplicate measurement results in the ith laboratory is 𝑥𝑥̅�, 198
and the average of the 𝑥𝑥̅ for one test sample is 𝑥𝑥̿.
199
When �𝑆𝑆�̅��� �𝑆𝑆���/2, the reproducibility standard deviation (𝑆𝑆�) is:
200
𝑆𝑆�� ��𝑆𝑆�̅��� �𝑆𝑆���/2 201
The reproducibility coefficient of variation (𝐶𝐶𝐶𝐶�) is:
202
𝐶𝐶𝐶𝐶�� ���𝑆𝑆�/𝑥𝑥̿
203
Robust statistical methods based on the medians were also used to describe the result distribution.
204
The robust repeatability standard deviation (𝑆𝑆�∗) was calculated using Algorithm S 205
(ISO13528:2015) [15, 16]. The robust standard deviation of the sample averages (𝑆𝑆�̅∗) is:
206
𝑆𝑆�̅∗� �������𝑑𝑑�|𝐷𝐷�|�
207
which is the scaled median absolute deviation (MADe), where 𝐷𝐷�� 𝑥𝑥̅�� ��𝑑𝑑�𝑥𝑥̅�. The percent 208
difference (D%) was used to describe the deviation in the individual laboratory results, calculated 209
as %D�� ���D�/��𝑑𝑑�𝑥𝑥̅�. The robust reproducibility standard deviation (𝑆𝑆�∗) and the robust 210
is:
12 The standard deviation of the sample averages (𝑆𝑆�̅) is:
196
𝑆𝑆�̅� �� 𝑑𝑑��
�
���
/�� � ��
197
where 𝑑𝑑�� 𝑥𝑥̅�� 𝑥𝑥̿ and the average of the duplicate measurement results in the ith laboratory is 𝑥𝑥̅�, 198
and the average of the 𝑥𝑥̅ for one test sample is 𝑥𝑥̿.
199
When �𝑆𝑆�̅��� �𝑆𝑆���/2, the reproducibility standard deviation (𝑆𝑆�) is:
200
𝑆𝑆�� ��𝑆𝑆�̅��� �𝑆𝑆���/2 201
The reproducibility coefficient of variation (𝐶𝐶𝐶𝐶�) is:
202
𝐶𝐶𝐶𝐶�� ���𝑆𝑆�/𝑥𝑥̿
203
Robust statistical methods based on the medians were also used to describe the result distribution.
204
The robust repeatability standard deviation (𝑆𝑆�∗) was calculated using Algorithm S 205
(ISO13528:2015) [15, 16]. The robust standard deviation of the sample averages (𝑆𝑆�̅∗) is:
206
𝑆𝑆�̅∗� �������𝑑𝑑�|𝐷𝐷�|�
207
which is the scaled median absolute deviation (MADe), where 𝐷𝐷�� 𝑥𝑥̅�� ��𝑑𝑑�𝑥𝑥̅�. The percent 208
difference (D%) was used to describe the deviation in the individual laboratory results, calculated 209
as %D�� ���D�/��𝑑𝑑�𝑥𝑥̅�. The robust reproducibility standard deviation (𝑆𝑆�∗) and the robust 210
where
12
The standard deviation of the sample averages (𝑆𝑆�̅) is:
196
𝑆𝑆�̅� �� 𝑑𝑑��
�
���
/�� � ��
197
where 𝑑𝑑�� 𝑥𝑥̅�� 𝑥𝑥̿ and the average of the duplicate measurement results in the ith laboratory is 𝑥𝑥̅�, 198
and the average of the 𝑥𝑥̅ for one test sample is 𝑥𝑥̿.
199
When �𝑆𝑆�̅��� �𝑆𝑆���/2, the reproducibility standard deviation (𝑆𝑆�) is:
200
𝑆𝑆�� ��𝑆𝑆�̅��� �𝑆𝑆���/2 201
The reproducibility coefficient of variation (𝐶𝐶𝐶𝐶�) is:
202
𝐶𝐶𝐶𝐶�� ���𝑆𝑆�/𝑥𝑥̿
203
Robust statistical methods based on the medians were also used to describe the result distribution.
204
The robust repeatability standard deviation (𝑆𝑆�∗) was calculated using Algorithm S 205
(ISO13528:2015) [15, 16]. The robust standard deviation of the sample averages (𝑆𝑆�̅∗) is:
206
𝑆𝑆�̅∗� �������𝑑𝑑�|𝐷𝐷�|�
207
which is the scaled median absolute deviation (MADe), where 𝐷𝐷�� 𝑥𝑥̅�� ��𝑑𝑑�𝑥𝑥̅�. The percent 208
difference (D%) was used to describe the deviation in the individual laboratory results, calculated 209
as %D�� ���D�/��𝑑𝑑�𝑥𝑥̅�. The robust reproducibility standard deviation (𝑆𝑆�∗) and the robust 210
and the average of the duplicate measure- ment results in the ith laboratory is
12
The standard deviation of the sample averages (𝑆𝑆�̅) is:
196
𝑆𝑆�̅� �� 𝑑𝑑��
�
���
/�� � ��
197
where 𝑑𝑑�� 𝑥𝑥̅�� 𝑥𝑥̿ and the average of the duplicate measurement results in the ith laboratory is 𝑥𝑥̅�, 198
and the average of the 𝑥𝑥̅ for one test sample is 𝑥𝑥̿.
199
When �𝑆𝑆�̅��� �𝑆𝑆���/2, the reproducibility standard deviation (𝑆𝑆�) is:
200
𝑆𝑆�� ��𝑆𝑆�̅��� �𝑆𝑆���/2 201
The reproducibility coefficient of variation (𝐶𝐶𝐶𝐶�) is:
202
𝐶𝐶𝐶𝐶�� ���𝑆𝑆�/𝑥𝑥̿
203
Robust statistical methods based on the medians were also used to describe the result distribution.
204
The robust repeatability standard deviation (𝑆𝑆�∗) was calculated using Algorithm S 205
(ISO13528:2015) [15, 16]. The robust standard deviation of the sample averages (𝑆𝑆�̅∗) is:
206
𝑆𝑆�̅∗� �������𝑑𝑑�|𝐷𝐷�|�
207
which is the scaled median absolute deviation (MADe), where 𝐷𝐷�� 𝑥𝑥̅�� ��𝑑𝑑�𝑥𝑥̅�. The percent 208
difference (D%) was used to describe the deviation in the individual laboratory results, calculated 209
as %D�� ���D�/��𝑑𝑑�𝑥𝑥̅�. The robust reproducibility standard deviation (𝑆𝑆�∗) and the robust 210
i, and the average of the
12
The standard deviation of the sample averages (𝑆𝑆�̅) is:
196
𝑆𝑆�̅� �� 𝑑𝑑��
�
���
/�� � �� 197
where 𝑑𝑑�� 𝑥𝑥̅�� 𝑥𝑥̿ and the average of the duplicate measurement results in the ith laboratory is 𝑥𝑥̅�, 198
and the average of the 𝑥𝑥̅ for one test sample is 𝑥𝑥̿.
199
When �𝑆𝑆�̅��� �𝑆𝑆���/2, the reproducibility standard deviation (𝑆𝑆�) is:
200
𝑆𝑆�� ��𝑆𝑆�̅��� �𝑆𝑆���/2 201
The reproducibility coefficient of variation (𝐶𝐶𝐶𝐶�) is:
202
𝐶𝐶𝐶𝐶�� ���𝑆𝑆�/𝑥𝑥̿
203
Robust statistical methods based on the medians were also used to describe the result distribution.
204
The robust repeatability standard deviation (𝑆𝑆�∗) was calculated using Algorithm S 205
(ISO13528:2015) [15, 16]. The robust standard deviation of the sample averages (𝑆𝑆�̅∗) is:
206
𝑆𝑆�̅∗� �������𝑑𝑑�|𝐷𝐷�|�
207
which is the scaled median absolute deviation (MADe), where 𝐷𝐷�� 𝑥𝑥̅�� ��𝑑𝑑�𝑥𝑥̅�. The percent 208
difference (D%) was used to describe the deviation in the individual laboratory results, calculated 209
as %D�� ���D�/��𝑑𝑑�𝑥𝑥̅�. The robust reproducibility standard deviation (𝑆𝑆�∗) and the robust 210
for one test sample is
12
The standard deviation of the sample averages (𝑆𝑆�̅) is:
196
𝑆𝑆�̅� �� 𝑑𝑑��
�
���
/�� � ��
197
where 𝑑𝑑�� 𝑥𝑥̅�� 𝑥𝑥̿ and the average of the duplicate measurement results in the ith laboratory is 𝑥𝑥̅�, 198
and the average of the 𝑥𝑥̅ for one test sample is 𝑥𝑥̿.
199
When �𝑆𝑆�̅��� �𝑆𝑆���/2, the reproducibility standard deviation (𝑆𝑆�) is:
200
𝑆𝑆�� ��𝑆𝑆�̅��� �𝑆𝑆���/2 201
The reproducibility coefficient of variation (𝐶𝐶𝐶𝐶�) is:
202
𝐶𝐶𝐶𝐶�� ���𝑆𝑆�/𝑥𝑥̿
203
Robust statistical methods based on the medians were also used to describe the result distribution.
204
The robust repeatability standard deviation (𝑆𝑆�∗) was calculated using Algorithm S 205
(ISO13528:2015) [15, 16]. The robust standard deviation of the sample averages (𝑆𝑆�̅∗) is:
206
𝑆𝑆�̅∗� �������𝑑𝑑�|𝐷𝐷�|�
207
which is the scaled median absolute deviation (MADe), where 𝐷𝐷�� 𝑥𝑥̅�� ��𝑑𝑑�𝑥𝑥̅�. The percent 208
difference (D%) was used to describe the deviation in the individual laboratory results, calculated 209
as %D�� ���D�/��𝑑𝑑�𝑥𝑥̅�. The robust reproducibility standard deviation (𝑆𝑆�∗) and the robust 210
When
12
The standard deviation of the sample averages (𝑆𝑆�̅) is:
196
𝑆𝑆�̅� �� 𝑑𝑑��
�
���
/�� � ��
197
where 𝑑𝑑�� 𝑥𝑥̅�� 𝑥𝑥̿ and the average of the duplicate measurement results in the ith laboratory is 𝑥𝑥̅�, 198
and the average of the 𝑥𝑥̅ for one test sample is 𝑥𝑥̿.
199
When �𝑆𝑆�̅��� �𝑆𝑆���/2, the reproducibility standard deviation (𝑆𝑆�) is:
200
𝑆𝑆�� ��𝑆𝑆�̅��� �𝑆𝑆���/2 201
The reproducibility coefficient of variation (𝐶𝐶𝐶𝐶�) is:
202
𝐶𝐶𝐶𝐶�� ���𝑆𝑆�/𝑥𝑥̿
203
Robust statistical methods based on the medians were also used to describe the result distribution.
204
The robust repeatability standard deviation (𝑆𝑆�∗) was calculated using Algorithm S 205
(ISO13528:2015) [15, 16]. The robust standard deviation of the sample averages (𝑆𝑆�̅∗) is:
206
𝑆𝑆�̅∗� �������𝑑𝑑�|𝐷𝐷�|�
207
which is the scaled median absolute deviation (MADe), where 𝐷𝐷�� 𝑥𝑥̅�� ��𝑑𝑑�𝑥𝑥̅�. The percent 208
difference (D%) was used to describe the deviation in the individual laboratory results, calculated 209
as %D�� ���D�/��𝑑𝑑�𝑥𝑥̅�. The robust reproducibility standard deviation (𝑆𝑆�∗) and the robust 210
the reproducibility standard deviation (SR) is:
12
The standard deviation of the sample averages (𝑆𝑆�̅) is:
196
𝑆𝑆�̅� �� 𝑑𝑑��
�
���
/�� � ��
197
where 𝑑𝑑�� 𝑥𝑥̅�� 𝑥𝑥̿ and the average of the duplicate measurement results in the ith laboratory is 𝑥𝑥̅�, 198
and the average of the 𝑥𝑥̅ for one test sample is 𝑥𝑥̿.
199
When �𝑆𝑆�̅��� �𝑆𝑆���/2, the reproducibility standard deviation (𝑆𝑆�) is:
200
𝑆𝑆�� ��𝑆𝑆�̅��� �𝑆𝑆���/2 201
The reproducibility coefficient of variation (𝐶𝐶𝐶𝐶�) is:
202
𝐶𝐶𝐶𝐶�� ���𝑆𝑆�/𝑥𝑥̿
203
Robust statistical methods based on the medians were also used to describe the result distribution.
204
The robust repeatability standard deviation (𝑆𝑆�∗) was calculated using Algorithm S 205
(ISO13528:2015) [15, 16]. The robust standard deviation of the sample averages (𝑆𝑆�̅∗) is:
206
𝑆𝑆�̅∗� �������𝑑𝑑�|𝐷𝐷�|�
207
which is the scaled median absolute deviation (MADe), where 𝐷𝐷�� 𝑥𝑥̅�� ��𝑑𝑑�𝑥𝑥̅�. The percent 208
difference (D%) was used to describe the deviation in the individual laboratory results, calculated 209
as %D�� ���D�/��𝑑𝑑�𝑥𝑥̅�. The robust reproducibility standard deviation (𝑆𝑆�∗) and the robust 210
The reproducibility coefficient of variation (CVR) is:
12
The standard deviation of the sample averages (𝑆𝑆�̅) is:
196
𝑆𝑆�̅� �� 𝑑𝑑��
�
���
/�� � ��
197
where 𝑑𝑑�� 𝑥𝑥̅�� 𝑥𝑥̿ and the average of the duplicate measurement results in the ith laboratory is 𝑥𝑥̅�, 198
and the average of the 𝑥𝑥̅ for one test sample is 𝑥𝑥̿.
199
When �𝑆𝑆�̅��� �𝑆𝑆���/2, the reproducibility standard deviation (𝑆𝑆�) is:
200
𝑆𝑆�� ��𝑆𝑆�̅��� �𝑆𝑆���/2 201
The reproducibility coefficient of variation (𝐶𝐶𝐶𝐶�) is:
202
𝐶𝐶𝐶𝐶�� ���𝑆𝑆�/𝑥𝑥̿
203
Robust statistical methods based on the medians were also used to describe the result distribution.
204
The robust repeatability standard deviation (𝑆𝑆�∗) was calculated using Algorithm S 205
(ISO13528:2015) [15, 16]. The robust standard deviation of the sample averages (𝑆𝑆�̅∗) is:
206
𝑆𝑆�̅∗� �������𝑑𝑑�|𝐷𝐷�|�
207
which is the scaled median absolute deviation (MADe), where 𝐷𝐷�� 𝑥𝑥̅�� ��𝑑𝑑�𝑥𝑥̅�. The percent 208
difference (D%) was used to describe the deviation in the individual laboratory results, calculated 209
as %D�� ���D�/��𝑑𝑑�𝑥𝑥̅�. The robust reproducibility standard deviation (𝑆𝑆�∗) and the robust 210
Robust statistical methods based on the medians were also used to describe the result distribution. The robust repeatability standard deviation (Sr*) was calculated using Algorithm S (ISO- 13528:2015) [15, 16]. The robust standard deviation of the sam- ple averages
12
The standard deviation of the sample averages (𝑆𝑆�̅) is:
196
𝑆𝑆�̅� �� 𝑑𝑑��
�
���
/�� � ��
197
where 𝑑𝑑�� 𝑥𝑥̅�� 𝑥𝑥̿ and the average of the duplicate measurement results in the ith laboratory is 𝑥𝑥̅�, 198
and the average of the 𝑥𝑥̅ for one test sample is 𝑥𝑥̿.
199
When �𝑆𝑆�̅��� �𝑆𝑆���/2, the reproducibility standard deviation (𝑆𝑆�) is:
200
𝑆𝑆�� ��𝑆𝑆�̅��� �𝑆𝑆���/2 201
The reproducibility coefficient of variation (𝐶𝐶𝐶𝐶�) is:
202
𝐶𝐶𝐶𝐶�� ���𝑆𝑆�/𝑥𝑥̿
203
Robust statistical methods based on the medians were also used to describe the result distribution.
204
The robust repeatability standard deviation (𝑆𝑆�∗) was calculated using Algorithm S 205
(ISO13528:2015) [15, 16]. The robust standard deviation of the sample averages (𝑆𝑆�̅∗) is:
206
𝑆𝑆�̅∗� �������𝑑𝑑�|𝐷𝐷�|�
207
which is the scaled median absolute deviation (MADe), where 𝐷𝐷�� 𝑥𝑥̅�� ��𝑑𝑑�𝑥𝑥̅�. The percent 208
difference (D%) was used to describe the deviation in the individual laboratory results, calculated 209
as %D�� ���D�/��𝑑𝑑�𝑥𝑥̅�. The robust reproducibility standard deviation (𝑆𝑆�∗) and the robust 210
is:
12
The standard deviation of the sample averages (𝑆𝑆�̅) is:
196
𝑆𝑆�̅� �� 𝑑𝑑��
�
���
/�� � ��
197
where 𝑑𝑑�� 𝑥𝑥̅�� 𝑥𝑥̿ and the average of the duplicate measurement results in the ith laboratory is 𝑥𝑥̅�, 198
and the average of the 𝑥𝑥̅ for one test sample is 𝑥𝑥̿.
199
When �𝑆𝑆�̅��� �𝑆𝑆���/2, the reproducibility standard deviation (𝑆𝑆�) is:
200
𝑆𝑆�� ��𝑆𝑆�̅��� �𝑆𝑆���/2 201
The reproducibility coefficient of variation (𝐶𝐶𝐶𝐶�) is:
202
𝐶𝐶𝐶𝐶�� ���𝑆𝑆�/𝑥𝑥̿
203
Robust statistical methods based on the medians were also used to describe the result distribution.
204
The robust repeatability standard deviation (𝑆𝑆�∗) was calculated using Algorithm S 205
(ISO13528:2015) [15, 16]. The robust standard deviation of the sample averages (𝑆𝑆�̅∗) is:
206
𝑆𝑆�̅∗� �������𝑑𝑑�|𝐷𝐷�|�
207
which is the scaled median absolute deviation (MADe), where 𝐷𝐷�� 𝑥𝑥̅�� ��𝑑𝑑�𝑥𝑥̅�. The percent 208
difference (D%) was used to describe the deviation in the individual laboratory results, calculated 209
as %D�� ���D�/��𝑑𝑑�𝑥𝑥̅�. The robust reproducibility standard deviation (𝑆𝑆�∗) and the robust 210
which is the scaled median absolute deviation (MADe), where
12
The standard deviation of the sample averages (𝑆𝑆�̅) is:
196
𝑆𝑆�̅� �� 𝑑𝑑��
�
���
/�� � ��
197
where 𝑑𝑑�� 𝑥𝑥̅�� 𝑥𝑥̿ and the average of the duplicate measurement results in the ith laboratory is 𝑥𝑥̅�, 198
and the average of the 𝑥𝑥̅ for one test sample is 𝑥𝑥̿.
199
When �𝑆𝑆�̅��� �𝑆𝑆���/2, the reproducibility standard deviation (𝑆𝑆�) is:
200
𝑆𝑆�� ��𝑆𝑆�̅��� �𝑆𝑆���/2 201
The reproducibility coefficient of variation (𝐶𝐶𝐶𝐶�) is:
202
𝐶𝐶𝐶𝐶�� ���𝑆𝑆�/𝑥𝑥̿
203
Robust statistical methods based on the medians were also used to describe the result distribution.
204
The robust repeatability standard deviation (𝑆𝑆�∗) was calculated using Algorithm S 205
(ISO13528:2015) [15, 16]. The robust standard deviation of the sample averages (𝑆𝑆�̅∗) is:
206
𝑆𝑆�̅∗� �������𝑑𝑑�|𝐷𝐷�|�
207
which is the scaled median absolute deviation (MADe), where 𝐷𝐷�� 𝑥𝑥̅�� ��𝑑𝑑�𝑥𝑥̅�. The percent 208
difference (D%) was used to describe the deviation in the individual laboratory results, calculated 209
as %D�� ���D�/��𝑑𝑑�𝑥𝑥̅�. The robust reproducibility standard deviation (𝑆𝑆�∗) and the robust 210
The percent difference (D%) was used to describe the deviation in the individual laboratory results, calcu- lated as
12
The standard deviation of the sample averages (𝑆𝑆�̅) is:
196
𝑆𝑆�̅� �� 𝑑𝑑��
�
���
/�� � ��
197
where 𝑑𝑑�� 𝑥𝑥̅�� 𝑥𝑥̿ and the average of the duplicate measurement results in the ith laboratory is 𝑥𝑥̅�, 198
and the average of the 𝑥𝑥̅ for one test sample is 𝑥𝑥̿.
199
When �𝑆𝑆�̅��� �𝑆𝑆���/2, the reproducibility standard deviation (𝑆𝑆�) is:
200
𝑆𝑆�� ��𝑆𝑆�̅��� �𝑆𝑆���/2 201
The reproducibility coefficient of variation (𝐶𝐶𝐶𝐶�) is:
202
𝐶𝐶𝐶𝐶�� ���𝑆𝑆�/𝑥𝑥̿
203
Robust statistical methods based on the medians were also used to describe the result distribution.
204
The robust repeatability standard deviation (𝑆𝑆�∗) was calculated using Algorithm S 205
(ISO13528:2015) [15, 16]. The robust standard deviation of the sample averages (𝑆𝑆�̅∗) is:
206
𝑆𝑆�̅∗� �������𝑑𝑑�|𝐷𝐷�|�
207
which is the scaled median absolute deviation (MADe), where 𝐷𝐷�� 𝑥𝑥̅�� ��𝑑𝑑�𝑥𝑥̅�. The percent 208
difference (D%) was used to describe the deviation in the individual laboratory results, calculated 209
as %D�� ���D�/��𝑑𝑑�𝑥𝑥̅�. The robust reproducibility standard deviation (𝑆𝑆�∗) and the robust
210 The robust reproducibility stan-
dard deviation (SR*) and the robust reproducibility CV (CVR*) were calculated as
13
reproducibility CV (𝐶𝐶𝐶𝐶�∗) were calculated as 𝑆𝑆�∗� ��𝑆𝑆�̅∗��� �𝑆𝑆�∗��/2 and %𝑅𝑅𝑆𝑆𝑅𝑅�∗� 211
100𝑆𝑆�∗/�����̅�, respectively. Spearman’s rank correlation coefficient (rho, ρ) was calculated to 212
determine the relationship between the D% values of different test drugs paired with similar drug 213
concentration measurements.
214
For the result analysis, a multiple linear regression model was used to compare the slopes of the 215
calibration curves (non-weighted):
216
� � � 𝛽𝛽�� 𝛽𝛽�𝑋𝑋 � 𝛽𝛽�𝑋𝑋𝑅𝑅�� � 217
where the response value is Y, the assigned value of calibrator is X, and the dummy variable of the 218
conditions is 𝑅𝑅�. The t-test on coefficient 𝛽𝛽� was performed to determine whether the slopes 219
obtained from the reconstitution or the storage conditions were different from those at the baseline 220
conditions (A0 or A1), with P ≤ 0.05. Data integration, analysis, and visualization were performed 221
using R version 3.6.3 (R Foundation for Statistical Computing, Vienna, Austria).
222
223
RESULTS 224
Homogeneity and short-term stability of TAC-2 225
In the homogeneity test, the overall average of TAC-2 was 8.99 ng/mL. Because the variance of 226
sample averages was < 1/3 of the within-sample variance, the between-sample standard deviation 227
was estimated as 0. Therefore, the homogeneity was considered sufficient. In the short-term 228
and %RSDR*=
13
reproducibility CV (𝐶𝐶𝐶𝐶�∗) were calculated as 𝑆𝑆�∗� ��𝑆𝑆�̅∗��� �𝑆𝑆�∗��/2 and %𝑅𝑅𝑆𝑆𝑅𝑅�∗� 211
100𝑆𝑆�∗/�����̅�, respectively. Spearman’s rank correlation coefficient (rho, ρ) was calculated to 212
determine the relationship between the D% values of different test drugs paired with similar drug 213
concentration measurements.
214
For the result analysis, a multiple linear regression model was used to compare the slopes of the 215
calibration curves (non-weighted):
216
� � � 𝛽𝛽�� 𝛽𝛽�𝑋𝑋 � 𝛽𝛽�𝑋𝑋𝑅𝑅�� � 217
where the response value is Y, the assigned value of calibrator is X, and the dummy variable of the 218
conditions is 𝑅𝑅�. The t-test on coefficient 𝛽𝛽� was performed to determine whether the slopes 219
obtained from the reconstitution or the storage conditions were different from those at the baseline 220
conditions (A0 or A1), with P ≤ 0.05. Data integration, analysis, and visualization were performed 221
using R version 3.6.3 (R Foundation for Statistical Computing, Vienna, Austria).
222
223
RESULTS 224
Homogeneity and short-term stability of TAC-2 225
In the homogeneity test, the overall average of TAC-2 was 8.99 ng/mL. Because the variance of 226
sample averages was < 1/3 of the within-sample variance, the between-sample standard deviation 227
was estimated as 0. Therefore, the homogeneity was considered sufficient. In the short-term 228
respectively. Spearman’s rank correlation coefficient (rho, ρ) was calculated to determine the relationship between the D% values of different test drugs paired with similar drug concentration mea- surements.
For the result analysis, a multiple linear regression model was used to compare the slopes of the calibration curves (non-weighted):
Y= β0+β1X +β2XDC+ε
where the response value is Y, the assigned value of calibra- tor is X, and the dummy variable of the conditions is DC. The t- test on coefficient β2 was performed to determine whether the slopes obtained from the reconstitution or the storage conditions were different from those at the baseline conditions (A0 or A1), with P ≤0.05. Data integration, analysis, and visualization were performed using R version 3.6.3 (R Foundation for Statistical Computing, Vienna, Austria).
RESULTS
Homogeneity and short-term stability of TAC-2
In the homogeneity test, the overall average of TAC-2 was 8.99 ng/mL. Because the variance of sample averages was <1/3 of the within-sample variance, the between-sample standard devi- ation was estimated as 0. Therefore, the homogeneity was con- sidered sufficient. In the short-term stability test, the overall av- erage of TAC-2 was 8.88 ng/mL. Its difference from the homo- geneity mean was 0.11 ng/mL, which was lower than the calcu-
Kim HK, et al.
ILC of immunosuppressant measurement by LC-MS/MS
272 www.annlabmed.org https://doi.org/10.3343/alm.2021.41.3.268 lated check value (0.17, 0.3S
12
The standard deviation of the sample averages (𝑆𝑆�̅) is:
196
𝑆𝑆�̅� �� 𝑑𝑑��
�
���
/�� � ��
197
where 𝑑𝑑�� 𝑥𝑥̅�� 𝑥𝑥̿ and the average of the duplicate measurement results in the ith laboratory is 𝑥𝑥̅�, 198
and the average of the 𝑥𝑥̅ for one test sample is 𝑥𝑥̿.
199
When �𝑆𝑆�̅��� �𝑆𝑆���/2, the reproducibility standard deviation (𝑆𝑆�) is:
200
𝑆𝑆�� ��𝑆𝑆�̅��� �𝑆𝑆���/2 201
The reproducibility coefficient of variation (𝐶𝐶𝐶𝐶�) is:
202
𝐶𝐶𝐶𝐶�� ���𝑆𝑆�/𝑥𝑥̿
203
Robust statistical methods based on the medians were also used to describe the result distribution.
204
The robust repeatability standard deviation (𝑆𝑆�∗) was calculated using Algorithm S 205
(ISO13528:2015) [15, 16]. The robust standard deviation of the sample averages (𝑆𝑆�̅∗) is:
206
𝑆𝑆�̅∗� �������𝑑𝑑�|𝐷𝐷�|�
207
which is the scaled median absolute deviation (MADe), where 𝐷𝐷�� 𝑥𝑥̅�� ��𝑑𝑑�𝑥𝑥̅�. The percent 208
difference (D%) was used to describe the deviation in the individual laboratory results, calculated 209
as %D�� ���D�/��𝑑𝑑�𝑥𝑥̅�. The robust reproducibility standard deviation (𝑆𝑆�∗) and the robust 210
of TAC-2). Therefore, the stability was considered acceptable.
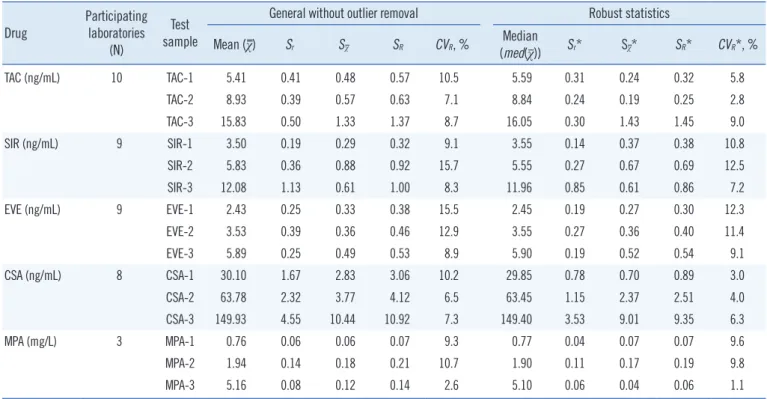
Measurement results of the participating laboratories Statistical summary of the laboratory measurement results is
shown in Table 2. The robust reproducibility CVs (CVR*) were
>10% for SIR-1, SIR-2, EVE-1, and EVE-2. A pattern suggesting a positive correlation among test samples was identified when the distribution of D% values was visualized using a heatmap table (Fig. 1A). For correlation analysis between the results for different
Table 2. Summary statistics of laboratory measurement results Drug Participating
laboratories (N)
Test sample
General without outlier removal Robust statistics Mean (χ) Sr Sχ SR CVR, % Median
(med(χ)) Sr* Sχ* SR* CVR*, %
TAC (ng/mL) 10 TAC-1 5.41 0.41 0.48 0.57 10.5 5.59 0.31 0.24 0.32 5.8
TAC-2 8.93 0.39 0.57 0.63 7.1 8.84 0.24 0.19 0.25 2.8
TAC-3 15.83 0.50 1.33 1.37 8.7 16.05 0.30 1.43 1.45 9.0
SIR (ng/mL) 9 SIR-1 3.50 0.19 0.29 0.32 9.1 3.55 0.14 0.37 0.38 10.8
SIR-2 5.83 0.36 0.88 0.92 15.7 5.55 0.27 0.67 0.69 12.5
SIR-3 12.08 1.13 0.61 1.00 8.3 11.96 0.85 0.61 0.86 7.2
EVE (ng/mL) 9 EVE-1 2.43 0.25 0.33 0.38 15.5 2.45 0.19 0.27 0.30 12.3
EVE-2 3.53 0.39 0.36 0.46 12.9 3.55 0.27 0.36 0.40 11.4
EVE-3 5.89 0.25 0.49 0.53 8.9 5.90 0.19 0.52 0.54 9.1
CSA (ng/mL) 8 CSA-1 30.10 1.67 2.83 3.06 10.2 29.85 0.78 0.70 0.89 3.0
CSA-2 63.78 2.32 3.77 4.12 6.5 63.45 1.15 2.37 2.51 4.0
CSA-3 149.93 4.55 10.44 10.92 7.3 149.40 3.53 9.01 9.35 6.3
MPA (mg/L) 3 MPA-1 0.76 0.06 0.06 0.07 9.3 0.77 0.04 0.07 0.07 9.6
MPA-2 1.94 0.14 0.18 0.21 10.7 1.90 0.11 0.17 0.19 9.8
MPA-3 5.16 0.08 0.12 0.14 2.6 5.10 0.06 0.04 0.06 1.1
Abbreviations: CSA, cyclosporine; EVE, everolimus; MPA, mycophenolic acid; TAC, tacrolimus; SIR, sirolimus.
Fig. 1. Correlation between the test samples. (A) The percent difference in individual laboratory results (D%) for each test sample. The cells are colored according to the D% values. The laboratory order is based on the average of the D% values, except for Lab E and Lab D, for pattern readability. (B) Correlation of D% values for test samples with similar concentrations for SIR and EVE. Test sample pairs are indi- cated by a triangle or circle, and the colors indicate the laboratory code.
Abbreviations: CSA, cyclosporine; EVE, everolimus; NA, not available; SIR, sirolimus; TAC, tacrolimus.
40
20
0
-20
-40
-40 -20 0 20 40
D% for sirolimus
D% for everolimus
Pair of test samples
Lab code SIR-1 and EVE-2 SIR-2 and EVE-3
A B C E F G H I J B
A
Test sample
Kim HK, et al.
ILC of immunosuppressant measurement by LC-MS/MS
drugs, the test samples were paired in similar concentrations:
SIR-1 and EVE-2 and SIR-2 and EVE-3 (N=18); TAC-1 and SIR-2 (N=9); and TAC-1 and EVE-3 (N=9). The ρ values between SIR and EVE, TAC and SIR, and TAC and EVE results were 0.334 (P =0.175), 0.383 (P =0.308), and -0.150 (P =0.700), respectively.
SIR and EVE results showed a weak positive correlation (Fig. 1B).
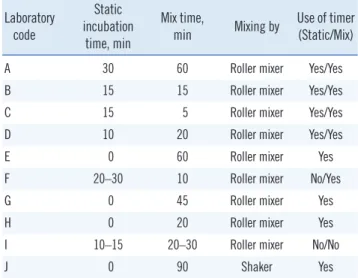
Calibrator reconstitution and storage conditions experiment Additional survey results for the calibrator reconstitution proto- cols are shown in Table 3. Based on the survey results, Condi- tions A0 (similar to Lab A protocol) and B0 (similar to Lab H pro- tocol) were selected. The slopes of the calibration curves did not significantly differ between these two conditions (Table 4).
In the experiment on storage conditions, the calibration curve slopes of SIR from Conditions A2 and A3 (P <0.001 and P = 0.030) and of EVE from Conditions A3 and A4 (P <0.001 and P =0.009) were significantly different from those of Condition A1. When the response value corresponding to a concentration, for example, of 6 ng/mL (similar to the mean concentrations of SIR-2) from the baseline condition calibration curve was entered into the experimental condition equation, positive biases were present in conditions A1–A3; however, the percent differences were expected to be in the range of 0.217–0.598% (Table 4).
DISCUSSION
This is the first interlaboratory comparison study of LC-MS/MS for immunosuppressive drug TDM in Korea. The test reproduc- ibility was generally good, and the robust reproducibility CVs were Table 3. Additional calibrator reconstitution survey results
Laboratory code
Static incubation
time, min
Mix time,
min Mixing by Use of timer (Static/Mix)
A 30 60 Roller mixer Yes/Yes
B 15 15 Roller mixer Yes/Yes
C 15 5 Roller mixer Yes/Yes
D 10 20 Roller mixer Yes/Yes
E 0 60 Roller mixer Yes
F 20–30 10 Roller mixer No/Yes
G 0 45 Roller mixer Yes
H 0 20 Roller mixer Yes
I 10–15 20–30 Roller mixer No/No
J 0 90 Shaker Yes
Table 4. Calibrator reconstitution and storage experiment results
Experiment Drug Condition Coefficient β2 (95% CI) P* Expected concentration at 6 ng/mL (%diff)
Reconstitution TAC A0 Baseline 6.000 (Baseline)
B0 0.00012 (-0.00034–0.00058) 0.612 5.997 (-0.049)
SIR A0 Baseline 6.000 (Baseline)
B0 -0.00005 (-0.00043–0.00032) 0.772 6.002 (0.029)
EVE A0 Baseline 6.000 (Baseline)
B0 -0.00015 (-0.00036–0.00005) 0.141 6.007 (0.112)
Storage TAC A1 Baseline 6.000 (Baseline)
A2 -0.00037 (-0.00102–0.00028) 0.257 6.009 (0.143)
A3 -0.00028 (-0.00093–0.00037) 0.386 6.007 (0.109)
A4 -0.00022 (-0.00087–0.00043) 0.496 6.005 (0.086)
SIR A1 Baseline 6.000 (Baseline)
A2 -0.00157 (-0.00239–-0.00076) <0.001 6.033 (0.555)
A3 -0.00091 (-0.00173–-0.00009) 0.030 6.019 (0.321)
A4 -0.00061 (-0.00143–0.00020) 0.138 6.013 (0.217)
EVE A1 Baseline 6.000 (Baseline)
A2 -0.00043 (-0.00098–0.00012) 0.121 6.013 (0.222)
A3 -0.00117 (-0.00172–-0.00062) <0.001 6.036 (0.598)
A4 -0.00075 (-0.00130–-0.00020) 0.009 6.023 (0.384)
*P from t-test on coefficient β2.
Abbreviations: CI, confidence interval; EVE, everolimus; TAC, tacrolimus; SIR, sirolimus.