ISSN 2234-3806 • eISSN 2234-3814
http://dx.doi.org/10.3343/alm.2016.36.3.235
Prevalence and Clinical Impact of Heterogeneous Vancomycin-Intermediate Staphylococcus aureus Isolated From Hospitalized Patients
Young Rae Koh, M.D.1, Kye-Hyung Kim, M.D.2, Chulhun L. Chang, M.D.1, and Jongyoun Yi, M.D.1,3,4
Department of Laboratory Medicine1, Pusan National University School of Medicine, Busan; Department of Internal Medicine2, Pusan National University Hospital, Busan; Research Institute for Convergence of Biomedical Science and Technology3, Pusan National University Yangsan Hospital, Yangsan;
Biomedical Research Institute4, Pusan National University Hospital, Busan, Korea
Background: We estimated the prevalence and clinical impact of heterogeneous vanco- mycin-intermediate Staphylococcus aureus (hVISA). The concordance between macro- method and glycopeptide resistance detection (GRD) E tests was determined. In addition, predictors of clinical outcomes in hospitalized patients with S. aureus bacteremia (SAB) or pneumonia (SAP) were evaluated.
Methods: We obtained 229 consecutive S. aureus isolates from all hospitalized patients at two university hospitals located in Busan and Yangsan, Korea. Standard, macromethod, and GRD E tests were performed. Additionally, we reviewed the medical records of all pa- tients. Among the 229 patients, predictors of clinical outcomes were analyzed for 107 pa- tients with SAB and 39 with SAP.
Results: Among the 229 isolates, 34.5% of S. aureus isolates and 50.7% of methicillin- resistant S. aureus isolates exhibited the hVISA phenotype based on the macromethod E test. hVISA was nearly associated with treatment failure in patients with SAB (P =0.054) and was significantly associated with treatment failure in patients with SAP (P =0.014).
However, hVISA was not associated with 30-day mortality in patients with SAB or SAP. The concordance between the macromethod and GRD E tests was 84.2%.
Conclusions: hVISA is quite common in the southeastern part of Korea. hVISA is associ- ated with treatment failure in patients with SAP.
Key Words: Heterogeneous vancomycin-intermediate Staphylococcus aureus, Macro- method E test, Glycopeptide resistance detection E test, S. aureus bacteremia, S. aureus pneumonia
Received: September 14, 2015 Revision received: February 10, 2016 Accepted: February 11, 2016 Corresponding author: Jongyoun Yi Department of Laboratory Medicine, Pusan National University Hospital, 179 Gudeok- ro, Seo-gu, Busan 49241, Korea Tel: +82-51-240-7417 Fax: +82-51-247-6560 E-mail: [email protected]
© The Korean Society for Laboratory Medicine This is an Open Access article distributed under the terms of the Creative Commons Attribution Non-Commercial License (http://creativecom- mons.org/licenses/by-nc/3.0) which permits unrestricted non-commercial use, distribution, and reproduction in any medium, provided the original work is properly cited.
INTRODUCTION
Methicillin-resistant Staphylococcus aureus (MRSA) has caused numerous invasive infections and deaths. Invasive MRSA infec- tion is a major public health problem [1]. Vancomycin has been the treatment of choice for serious MRSA infections since 1958.
However, its overuse has led to the emergence of vancomycin- intermediate and -resistant MRSA [2].
Vancomycin-intermediate S. aureus (VISA) develops via the heterogeneous vancomycin-intermediate S. aureus (hVISA) pre- cursor phenotype [3]. hVISA is defined as S. aureus with a van- comycin minimum inhibitory concentration (MIC) within the susceptible range, but with a subpopulation of cells in the van- comycin-intermediate range [4].
hVISA was first reported in Japan in 1997 [5] and has since been identified worldwide [6-8]. In Korea, VISA was first re-
ported in 2000 [9]. hVISA prevalence was 0.5% from all clinical S. aureus isolates in 2002 [10], 6.1% from all clinical MRSA isolates in 2004 [11], and 37.7% from MRSA bacteremia iso- lates in 2012 [12]. However, these data were obtained from sin- gle-center studies conducted only in Seoul. To date, no other studies have been subsequently conducted in other regions.
Therefore, it is necessary to investigate hVISA prevalence in re- gions other than Seoul.
Population analysis profiling (PAP) is considered the most ac- curate method for detecting hVISA [13]. However, PAP is time- consuming, labor-intensive, and expensive. Furthermore, results are generally not available within a clinically relevant time pe- riod, taking at least 3-5 days [14], which limits its use in most clinical microbiology laboratories.
Among hVISA detection methods, macromethod and glyco- peptide resistance detection (GRD) E tests demonstrate good sensitivity and specificity, when PAP is used as a reference method [15, 16]. However, only a few studies have determined the concordance between these two E tests [15-17], and further studies are needed to address this issue.
Moreover, it is still controversial whether hVISA exacerbates clinical outcomes in patients with S. aureus bacteremia (SAB) [18-24]. Additionally, predictors of clinical outcomes in patients with S. aureus pneumonia (SAP) have not been identified.
To resolve these issues, we first performed a hVISA detection study to obtain the hVISA prevalence in the southeastern part of Korea. Second, we estimated the concordance between the macromethod and GRD E tests. Third, we evaluated predictors of clinical outcomes in hospitalized patients with SAB or SAP.
METHODS
1. Collection of S. aureus isolates
We obtained consecutive S. aureus isolates from all hospitalized patients in two university hospitals located in Busan and Yang- san, Korea. The S. aureus isolates were obtained by culturing blood, body fluids (pleural fluid, peritoneal fluid, and joint fluid), bronchial fluid, pus, sputum, and urine. Isolates from other specimens were excluded. S. aureus was identified by using the VITEK 2 system (bioMérieux, Marcy-l’Etoile, France). This study was approved by the institutional review board of the two hospi- tals, and the requirement for informed consent was waived.
In total, 146 S. aureus isolates were collected between April and November 2012 at one hospital, and 268 were collected between April 2012 and April 2013 at the other hospital. Iso- lates from patients younger than 18 yr were excluded. Isolates
were excluded if bacterial species other than S. aureus were re- covered from the same specimen. If S. aureus isolates were ob- tained from more than one specimen for a patient, only one iso- late was selected. Isolate obtained from blood or body fluids was preferred, and the earliest cultured isolate during hospitalization was selected. Finally, 107 blood isolates and 122 non-blood iso- lates (body fluids, 27; bronchial fluid, 13; pus, 37; sputum, 34;
urine, 11) were obtained.
2. Standard E test
Vancomycin and teicoplanin MICs were determined by standard E test according to the manufacturer’s instruction. Each S. au- reus isolate was grown for 24 hr on a blood agar plate. A single colony was inoculated into saline, and saline suspensions ad- justed to match the 0.5 McFarland turbidity standard were inoc- ulated onto a Muller-Hinton agar plate (ASAN Pharmaceutical, Hwaseong, Korea). E test strips for vancomycin and teicoplanin were applied to the same plate. All plates were incubated at 35ºC for 48 hr. Vancomycin breakpoints were defined as follows: sus- ceptible at a vancomycin MIC of ≤2 μg/mL, intermediate at a vancomycin MIC of 4-8 μg/mL, and resistant at a vancomycin MIC of ≥16 μg/mL, according to the CLSI guideline [25].
3. Macromethod E test
Macromethod E test was performed according to the manufac- turer’s instruction. A McFarland suspension (200 μL) was pre- pared in brain heart infusion (BHI) broth, pipetted onto a 90- mm BHI agar plate (Becton, Dickinson and Company, Sparks, MD, USA), and swabbed evenly. E test strips for vancomycin and teicoplanin were applied to the same plate. All plates were incubated at 35ºC for 48 hr. The test was considered positive for hVISA, if (1) the teicoplanin MIC was ≥12 μg/mL or (2) the tei- coplanin and vancomycin MICs were ≥8 μg/mL.
4. Glycopeptide resistance detection E test
Among 229 isolates, 79 were positive for hVISA based on the macromethod E test. To determine the concordance between the macromethod and GRD E tests, the GRD E test was per- formed on 158 isolates (79 hVISA isolates and another ran- domly selected 79 vancomycin-susceptible [VSSA] isolates) ac- cording to the manufacturer’s instruction. A bacterial suspen- sion corresponding to the 0.5 McFarland standard prepared in BHI broth was inoculated on Mueller-Hinton agar with 5% blood agar plate (MH-BAP; Becton, Dickinson and Company). A GRD strip consisting of a double-sided gradient with vancomycin and teicoplanin was then applied to the MH-BAP. All plates were in-
cubated at 35ºC for 48 hr. The test was considered positive for hVISA, if the GRD E test strip result was ≥8 μg/mL for vanco- mycin or teicoplanin [15].
5. Predictors of clinical outcomes in patients with S. aureus bacteremia
We reviewed the medical records of all patients, and out of 229 patients, 107 with clinically significant SAB were analyzed for predictors of clinical outcomes. To meet the systemic inflamma- tory response syndrome (SIRS) criteria, two or more of the fol- lowing conditions were required: (1) body temperature >38°C or
<36°C; (2) respiratory rate >20 per minute or CO2 pressure on arterial blood gas analysis (PaCO2) <32 mm Hg; (3) heart rate
>90 per minute; (4) white blood cell (WBC) count >12.0 ×10⁹/ L or <4.0×10⁹/L, or band form >10%. SAB was defined by iso- lation of S. aureus from one or more blood cultures, and patients with polymicrobial bacteremia were excluded [26]. Patients who met the SIRS criteria at SAB onset were considered to have clini- cally significant SAB and were included in this study [27].
Clinical outcomes were analyzed as treatment failure and 30- day mortality. Treatment failure of SAB was defined by the iden- tification of positive blood cultures for ≥7 days [19]. 30-day mortality was defined as death within 30 days after SAB onset.
The following data from 107 patients were collected: age, gender, presence of MRSA, presence of hVISA, duration of hos- pital stay before SAB onset, mode of transmission, primary source of infection, presence of comorbidities, treatment prior to SAB onset (surgery within 30 days, cancer chemotherapy, im- munosuppressive therapy, and vancomycin therapy within 1 yr), and appropriate empirical therapy.
The primary sources of infection were determined by the fol- lowing definitions. Infective endocarditis was identified accord- ing to the Duke criteria [28]. An intravascular catheter-related infection was considered to be the source of bacteremia, if (1) the catheter had been in place for ≥72 hr; (2) the culture of the catheter tip from the insertion site showed growth of S. aureus with the same resistance pattern as those of culture isolates from peripheral blood, the clinical signs in the patient improved after the catheter was removed, or there was an inflammatory reaction at the catheter insertion site; and (3) no other source for bacteremia existed [29]. A diagnosis of osteomyelitis was based on radiological images showing a lytic center with a ring of sclerosis. Cultures from a bone biopsy were required to iden- tify the specific pathogen [30]. Pneumonia was considered to be the source of SAB, if the following conditions were met: (1) the chest radiograph showed new or progressive infiltrates
within 24 hr of the first S. aureus-positive blood collection; (2) S.
aureus was cultured from sputum or bronchial fluid within the 3 days before the collection of culture-positive blood; (3) the pul- monary infiltrates were not attributable to other causes [31].
Skin and soft tissue infections were considered to be the source of SAB, if the following conditions were met: (1) S. aureus was isolated from the patient’s affected tissue within the three days before the collection of culture-positive blood; (2) the patient had symptoms or signs of local infection; (3) there was no other cause of skin and soft tissue infection. Surgical wound infection was defined according to the definitions outlined by the U.S.
Centers for Disease Control and Prevention [32]. If the primary focus of infection could not be determined, it was considered unknown (primary bacteremia).
The initial empirical antibiotic therapy was considered to be appropriate, if the empirical regimen provided during the first 48 hr after the onset of bacteremia included one or more antibi- otics to which the isolate was susceptible (for methicillin-resis- tant S. aureus, always at least vancomycin or teicoplanin) and if the dose of the susceptible antibiotics was adequate.
6. Predictors of clinical outcomes in patients with S. aureus pneumonia
Of 229 patients, predictors of clinical outcomes, including treat- ment failure and 30-day mortality, were analyzed in 39 with clinically significant SAP. A diagnosis of SAP was made, if the following conditions were met: (1) the patient had lower respira- tory tract symptoms such as cough and sputum; (2) a chest ra- diograph showed new pulmonary infiltrates within 24 hr of the first S. aureus-positive culture result; (3) only S. aureus isolates were cultured from sputum, bronchial fluid, or blood; (4) there were no other causes of pneumonia [33].
Treatment failure of SAP was defined as the persistence of lower respiratory tract symptoms for ≥2 weeks and radiographic abnormalities for ≥4 weeks despite treatment with antibiotics to which the S. aureus isolate was susceptible in vitro [34]. The 30-day mortality was defined as death that occurred within 30 days after the first day of sputum, bronchial fluid, or blood col- lection.
The following data were collected: age, gender, presence of MRSA, presence of hVISA, duration of hospital stay before SAP onset, mode of transmission, presence of comorbidities, and treatment prior to SAP onset. The initial empirical antibiotic ther- apy was considered appropriate, if the empirical regimen pro- vided during the first 48 hr after the onset of pneumonia included one or more antibiotics to which the isolate was susceptible.
7. Statistical analysis
All statistical data were analyzed by using MedCalc software (version 14.12; MedCalc Software, Mariakerke, Belgium). Cate- gorical variables were compared by Chi-square test or Fisher’s exact test, and continuous variables were compared by using a t-test for sample sizes above 20 or Mann-Whitney U test for sample sizes below 20. In the multivariate analysis, all signifi- cant variables in the univariate analysis were subjected to logis- tic regression modeling to identify independent predictors of clinical outcomes for patients with SAB or SAP. All significance tests were two-tailed, and a P value of ≤0.05 was considered significant.
RESULTS
1. Prevalence of the hVISA phenotype based on the macromethod E test
The prevalence of hVISA and VSSA phenotypes based on the macromethod E test is shown in Table 1. Of 229 S. aureus iso- lates, 138 (60.3%) were MRSA and 91 (39.7%) were MSSA.
Based on the macromethod E test, 79 (34.5%) isolates dis- played the hVISA phenotype, and 150 (65.5%) had the VSSA phenotype. hVISA prevalence increased with vancomycin MICs in MRSA isolates.
2. Concordance between the macromethod and GRD E tests
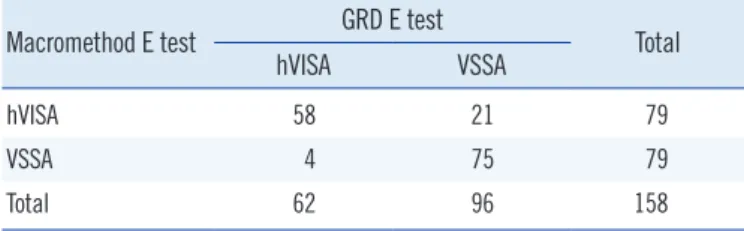
Based on the hVISA and VSSA phenotypes determined by themacromethod or GRD E test, the concordance between the two analyses was 84.2% (Table 2). Of 79 isolates found to display the hVISA phenotype based on the macromethod E test, 58 (73.4%) exhibited the hVISA phenotype, and 21 (26.6%) dem- onstrated the VSSA phenotype as determined by the GRD E test. Of the 79 isolates found to exhibit the VSSA phenotype based on the macromethod E test, 75 (94.9%) showed the VSSA phenotype, and four (5.1%) exhibited the hVISA pheno- type based on the GRD E test.
3. Predictors of treatment failure in patients with SAB
Results of a univariate analysis of the predictors of treatment failure in 107 patients with SAB are shown in Table 3. Of 107 patients, 34 (31.8%) patients experienced treatment failure, while 58 (54.2%) successfully responded to treatment within seven days. Data were not available for 15 (14.0%) patients.Previous surgery (P =0.0107) and prior vancomycin therapy (P =0.0214) were significantly associated with treatment failure.
The hVISA phenotype was considered nearly significant (P =0.054). The multivariate analysis indicated that they were not independently associated with treatment failure in patients with SAB.
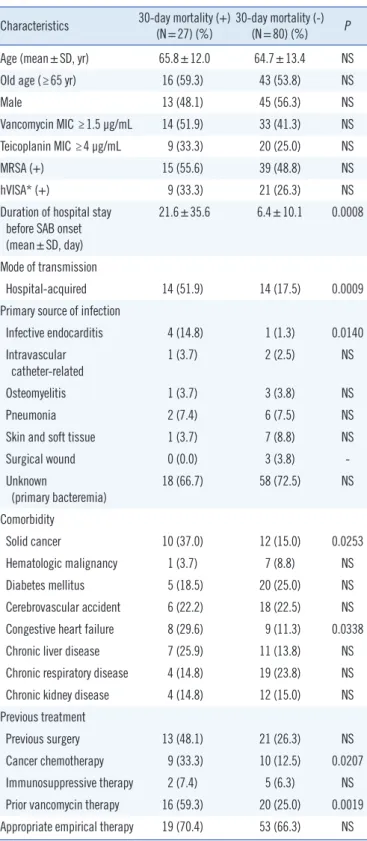
4. Predictors of 30-day mortality in patients with SAB
Results of a univariate analysis of the predictors of 30-day mor- tality in 107 patients with SAB are shown in Table 4. We ob- served that 27 (25.2%) patients died within 30 days of the on- set of SAB. The duration of hospital stay before SAB onset (P =0.0008), mode of transmission (P =0.0009), infective endo- carditis (P =0.014), solid cancer (P =0.0253), congestive heart failure (P =0.0338), cancer chemotherapy (P =0.0207), and prior vancomycin therapy (P =0.0019) were significantly associ- ated with the 30-day mortality in patients with SAB. A multivari- ate analysis of these variables indicated that the mode of trans- mission (adjusted odds ratio, 7.189; 95% confidence intervals Table 1. Prevalence of hVISA* and VSSA phenotypes based on themacromethod E test and the vancomycin MIC of standard E test Vancomycin MIC†
(μg/mL)
MRSA (N=138) MSSA (N=91) hVISA* (%) VSSA (%) hVISA* (%) VSSA (%)
0.25 0 (-) 0 (-) 0 (-) 1 (0.0)
0.5 0 (-) 7 (100.0) 0 (-) 0 (-)
0.75 1 (14.3) 6 (85.7) 1 (16.7) 5 (83.3)
1 22 (42.3) 30 (57.7) 0 (-) 45 (100.0)
1.5 38 (61.3) 24 (38.7) 7 (18.9) 30 (81.1)
2 8 (88.9) 1 (11.1) 1 (50.0) 1 (50.0)
3 1 (100.0) 0 (-) 0 (-) 0 (-)
Total 70 (50.7) 68 (49.3) 9 (9.9) 82 (90.1)
hVISA prevalences according to the vancomycin MICs were significantly dif- ferent in MRSA (P =0.0007) and MSSA (P =0.0149) isolates. Categorical variables were compared using the Chi-square test by 2xN table format.
*hVISA phenotype was identified by macromethod E test; †Vancomycin MICs were determined by standard E test.
Abbreviations: VSSA, vancomycin-susceptible S. aureus; hVISA, heteroge- neous vancomycin-intermediate S. aureus; MRSA, methicillin-resistant S.
aureus; MSSA, methicillin-susceptible S. aureus.
Table 2. Concordance between the macromethod E test and GRD E test
Macromethod E test GRD E test
Total
hVISA VSSA
hVISA 58 21 79
VSSA 4 75 79
Total 62 96 158
Concordance={(58+75)/158}×100=84.2%.
Abbreviations: GRD, glycopeptide resistance detection; VSSA, vancomycin- susceptible S. aureus; hVISA, heterogeneous vancomycin-intermediate S.
aureus.
Table 3. Univariate analysis of predictors for treatment failure in pa- tients* with SAB
Characteristics Treatment failure (+)
(N=34) (%) Treatment failure (-)
(N=58) (%) P
Age (mean±SD, yr) 62.1±12.3 65.3±13.5 NS
Old age (≥65 yr) 14 (41.2) 36 (62.1) NS
Male 23 (67.6) 32 (55.2) NS
Vancomycin MIC ≥1.5 μg/mL 17 (50.5) 23 (39.7) NS Teicoplanin MIC ≥4 μg/mL 13 (38.2) 12 (20.7) NS
MRSA (+) 21 (61.8) 25 (43.1) NS
hVISA† (+) 14 (41.2) 12 (20.7) NS (0.0540)
Duration of hospital stay before SAB onset (mean±SD, day)
14.9±27.7 7.6±14.1 NS
Mode of transmission
Hospital-acquired 10 (29.4) 14 (24.1) NS
Primary source of infection
Infective endocarditis 2 (5.9) 3 (5.2) NS
Intravascular
catheter-related 1 (2.9) 1 (1.7) NS
Osteomyelitis 1 (2.9) 3 (5.2) NS
Pneumonia 3 (8.8) 3 (5.2) NS
Skin and soft tissue 3 (8.8) 4 (6.9) NS
Surgical wound 1 (2.9) 2 (3.4) NS
Unknown
(primary bacteremia) 23 (67.6) 42 (72.4) NS Comorbidity
Solid cancer 5 (14.7) 14 (24.1) NS
Hematologic malignancy 4 (11.8) 4 (6.9) NS
Diabetes mellitus 9 (26.5) 12 (20.7) NS
Cerebrovascular accident 9 (26.5) 12 (20.7) NS Congestive heart failure 7 (20.6) 7 (12.1) NS
Chronic liver disease 3 (8.8) 12 (20.7) NS
Chronic respiratory disease 9 (26.5) 10 (17.2) NS
Chronic kidney disease 6 (17.6) 7 (12.1) NS
Previous treatment
Previous surgery 17 (50.0) 13 (22.4) 0.0107
Cancer chemotherapy 6 (17.6) 11 (19.0) NS
Immunosuppressive therapy 2 (5.9) 4 (6.9) NS
Prior vancomycin therapy 17 (50.0) 14 (24.1) 0.0214 Appropriate empirical therapy 25 (73.5) 42 (72.8) NS Categorical variables were compared using Fisher’s exact test, and continu- ous variables were compared using t-test.
*Data from 15 patients were not available; †The hVISA phenotype was iden- tified by macromethod E test.
Abbreviations: SAB, S. aureus bacteremia; MRSA, methicillin-resistant S.
aureus; hVISA, heterogeneous vancomycin-intermediate S. aureus; MIC, minimum inhibitory concentration; NS, not significant.
Table 4. Univariate analysis of predictors for 30-day mortality in pa- tients with SAB
Characteristics 30-day mortality (+)
(N=27) (%) 30-day mortality (-)
(N=80) (%) P
Age (mean±SD, yr) 65.8±12.0 64.7±13.4 NS
Old age (≥65 yr) 16 (59.3) 43 (53.8) NS
Male 13 (48.1) 45 (56.3) NS
Vancomycin MIC ≥1.5 μg/mL 14 (51.9) 33 (41.3) NS
Teicoplanin MIC ≥4 μg/mL 9 (33.3) 20 (25.0) NS
MRSA (+) 15 (55.6) 39 (48.8) NS
hVISA* (+) 9 (33.3) 21 (26.3) NS
Duration of hospital stay before SAB onset (mean±SD, day)
21.6±35.6 6.4±10.1 0.0008
Mode of transmission
Hospital-acquired 14 (51.9) 14 (17.5) 0.0009
Primary source of infection
Infective endocarditis 4 (14.8) 1 (1.3) 0.0140
Intravascular
catheter-related 1 (3.7) 2 (2.5) NS
Osteomyelitis 1 (3.7) 3 (3.8) NS
Pneumonia 2 (7.4) 6 (7.5) NS
Skin and soft tissue 1 (3.7) 7 (8.8) NS
Surgical wound 0 (0.0) 3 (3.8) -
Unknown
(primary bacteremia)
18 (66.7) 58 (72.5) NS
Comorbidity
Solid cancer 10 (37.0) 12 (15.0) 0.0253
Hematologic malignancy 1 (3.7) 7 (8.8) NS
Diabetes mellitus 5 (18.5) 20 (25.0) NS
Cerebrovascular accident 6 (22.2) 18 (22.5) NS Congestive heart failure 8 (29.6) 9 (11.3) 0.0338
Chronic liver disease 7 (25.9) 11 (13.8) NS
Chronic respiratory disease 4 (14.8) 19 (23.8) NS
Chronic kidney disease 4 (14.8) 12 (15.0) NS
Previous treatment
Previous surgery 13 (48.1) 21 (26.3) NS
Cancer chemotherapy 9 (33.3) 10 (12.5) 0.0207
Immunosuppressive therapy 2 (7.4) 5 (6.3) NS
Prior vancomycin therapy 16 (59.3) 20 (25.0) 0.0019 Appropriate empirical therapy 19 (70.4) 53 (66.3) NS Categorical variables were compared using Fisher’s exact test, and continu- ous variables were compared using t-test.
*The hVISA phenotype was identified by macromethod E test.
Abbreviations: SAB, S. aureus bacteremia; MRSA, methicillin-resistant S.
aureus; hVISA, heterogeneous vancomycin-intermediate S. aureus; MIC, minimum inhibitory concentration; NS, not significant.
[CI], 2.172-23.792) was independently associated with 30-day mortality. However, hVISA was not associated with 30-day mor- tality in patients with SAB.
5. Predictors of treatment failure in patients with SAP
Results of a univariate analysis of predictors of treatment failure in 39 patients with SAP are shown in Table 5. Of the 39 pa- tients, 12 (30.8%) were non-responsive to treatment, and 27 (69.2%) successfully responded to treatment. hVISA phenotype(P =0.0140) and teicoplanin MIC ≥4 μg/mL (P =0.0123) had a significant association with treatment failure in SAP patients. A multivariate analysis indicated that they were not independently associated with treatment failure in patients with SAP.
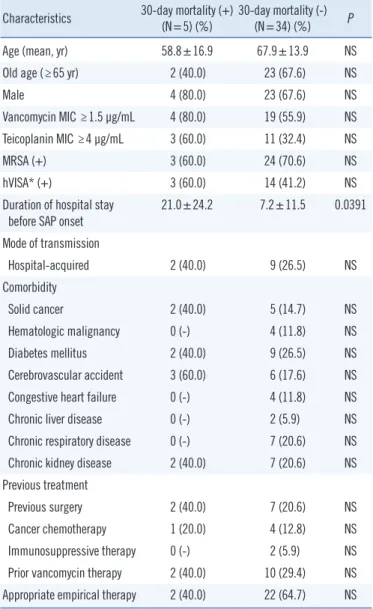
6. Predictors of 30-day mortality in patients with SAP
Results of a univariate analysis of risk factors for 30-day mortal- ity in 39 patients with SAP are shown in Table 6. We observed that five (12.8%) patients died within 30 days from the day of SAP onset. The duration of hospital stay before SAP onset Table 5. Univariate analysis of predictors for treatment failure in pa-tients with SAP
Characteristics Treatment failure (+)
(N=12) (%) Treatment failure (-)
(N=27) (%) P
Age (mean±SD, yr) 71.4±7.7 64.7±16.3 NS
Old age (≥65 yr) 10 (83.3) 15 (55.6) NS
Male 9 (75.0) 18 (66.7) NS
Vancomycin MIC ≥1.5 μg/mL 10 (83.3) 13 (48.1) NS
Teicoplanin MIC ≥4 μg/mL 8 (66.6) 6 (22.2) 0.0123
MRSA (+) 9 (75.0) 18 (66.7) NS
hVISA* (+) 9 (75.0) 8 (29.6) 0.014
Duration of hospital stay before SAP onset (mean±SD, day)
10.9±12.8 8.1±14.8 NS
Mode of transmission
Hospital-acquired 4 (33.3) 7 (25.9) NS
Comorbidity
Solid cancer 2 (16.7) 5 (18.5) NS
Hematologic malignancy 2 (16.7) 2 (7.4) NS
Diabetes mellitus 4 (33.3) 7 (25.9) NS
Cerebrovascular accident 2 (16.7) 7 (25.9) NS
Congestive heart failure 1 (8.3) 3 (11.1) NS
Chronic liver disease 1 (8.3) 1 (3.7) NS
Chronic respiratory disease 3 (25.0) 4 (14.8) NS
Chronic kidney disease 3 (25.0) 6 (22.2) NS
Previous treatment
Previous surgery 3 (25.0) 6 (22.2) NS
Cancer chemotherapy 2 (16.7) 3 (11.1) NS
Immunosuppressive therapy 1 (8.3) 1 (3.7) NS
Prior vancomycin therapy 4 (33.3) 8 (29.6) NS
Appropriate empirical therapy 7 (58.3) 17 (63.0) NS Categorical variables were compared using Fisher’s exact test, and continuous variables were compared using Mann-Whitney U test.
*The hVISA phenotype was identified by macromethod E test.
Abbreviations: SAP, S. aureus pneumonia; MRSA, methicillin-resistant S.
aureus; hVISA, heterogeneous vancomycin-intermediate S. aureus; MIC, minimum inhibitory concentration; NS, not significant.
Table 6. Univariate analysis of predictors for 30-day mortality in pa- tients with SAP
Characteristics 30-day mortality (+)
(N=5) (%) 30-day mortality (-)
(N=34) (%) P
Age (mean, yr) 58.8±16.9 67.9±13.9 NS
Old age (≥65 yr) 2 (40.0) 23 (67.6) NS
Male 4 (80.0) 23 (67.6) NS
Vancomycin MIC ≥1.5 μg/mL 4 (80.0) 19 (55.9) NS
Teicoplanin MIC ≥4 μg/mL 3 (60.0) 11 (32.4) NS
MRSA (+) 3 (60.0) 24 (70.6) NS
hVISA* (+) 3 (60.0) 14 (41.2) NS
Duration of hospital stay
before SAP onset 21.0±24.2 7.2±11.5 0.0391
Mode of transmission
Hospital-acquired 2 (40.0) 9 (26.5) NS
Comorbidity
Solid cancer 2 (40.0) 5 (14.7) NS
Hematologic malignancy 0 (-) 4 (11.8) NS
Diabetes mellitus 2 (40.0) 9 (26.5) NS
Cerebrovascular accident 3 (60.0) 6 (17.6) NS
Congestive heart failure 0 (-) 4 (11.8) NS
Chronic liver disease 0 (-) 2 (5.9) NS
Chronic respiratory disease 0 (-) 7 (20.6) NS
Chronic kidney disease 2 (40.0) 7 (20.6) NS
Previous treatment
Previous surgery 2 (40.0) 7 (20.6) NS
Cancer chemotherapy 1 (20.0) 4 (12.8) NS
Immunosuppressive therapy 0 (-) 2 (5.9) NS
Prior vancomycin therapy 2 (40.0) 10 (29.4) NS Appropriate empirical therapy 2 (40.0) 22 (64.7) NS Categorical variables were compared using Fisher’s exact test, and continu- ous variables were compared using Mann-Whitney U test.
*The hVISA phenotype was identified by macromethod E test.
Abbreviations: SAP, S. aureus pneumonia; MRSA, methicillin-resistant S.
aureus; hVISA, heterogeneous vancomycin-intermediate S. aureus; MIC, minimum inhibitory concentration; NS, not significant.
(P =0.0391) was significantly associated with 30-day mortality.
7. Impact of hVISA on clinical outcomes in MRSA and MSSA patients
We additionally analyzed the impact of hVISA on clinical out- comes in MRSA-SAB (Supplemental Data Tables S1 and S2), MRSA-SAP (Supplemental Data Table S3), and MSSA-SAB (Supplemental Data Tables S4 and S5) patients, respectively.
hVISA was significantly associated with treatment failure in MRSA-SAP patients (P =0.0088). However, hVISA was not as- sociated with treatment failure or 30-day mortality in MRSA- or MSSA-SAB patients. Since the cases of the treatment failure (+) group of MSSA-SAP patients and 30-day mortality (+) group of MRSA- or MSSA-SAP patients were too few (below 3), statistical analyses of these cases were inappropriate and not done.
DISCUSSION
hVISA has been reported in several countries [18-20, 35].
hVISA prevalence in the United States was 2.2% in 1986-1993, 7.6% in 1994-2002, and 8.3% in 2003-2007, among 1499 MRSA isolates by the macromethod E test and PAP at three hospitals in Detroit [35]. hVISA prevalence was found to be 14.5% based on 489 MRSA isolates from bacteremia patients by the macromethod E test at a single hospital in Detroit in 1996-2006 [19]. Approximately 9.4% of blood culture MRSA isolates obtained from a single health center in Australia be- tween July 2001 and June 2002 were found to exhibit the hVISA phenotype by PAP [18]. Moreover, a high rate of hVISA (49.6%) was observed in 117 MRSA isolates by PAP at a single hospital in Austrailia in 2005 [20]. A meta-analysis conducted in 2011 by Sebastiaan et al. showed that the overall hVISA prevalence was 1.3% among all MRSA isolates [36]. The differ- ence of hVISA prevalences may be explained by different testing methods, geographical regions, and patient populations. Addi- tionally, higher antibiotic selection pressures at tertiary care cen- ters may account for a higher prevalence of hVISA [37].
In Korea, hVISA prevalence was 0.5% in 2002. PAP con- firmed 24 out of 4,483 S. aureus isolates as hVISA at a single hospital from December 1998 to August 1999 [10]. In 2004, hVISA prevalence was 6.1% (28/457 MRSA isolates) by PAP at a single health center from January 1997 to March 2000 [11].
Furthermore, among 268 MRSA bacteremia isolates, 37.7%
were identified as hVISA by PAP at a single hospital from August 2008 to September 2010 [12].
In our study, PAP was not performed as a confirmatory test,
since several previous studies estimated hVISA prevalence us- ing only the macromethod E test [19, 21, 22]. Additionally, the macromethod E test has good sensitivity and specificity, with PAP used as the reference method. In 2008, Yusof et al. [15]
reported that the macromethod E test had a sensitivity of 94%
and a specificity of 96%, and GRD E test had a sensitivity of 94% and a specificity of 95%. In 2009, Leonard et al. [16] eval- uated that the macromethod E test was 83% sensitive and 94%
specific, and GRD E test was 93% sensitive and 82% specific compared with PAP. In 2011, Satola et al. [17] evaluated that the sensitivities of both E tests were relatively low at 57%, but the specificities were high at 96% and 97%, respectively. In our study, considering its slightly lower sensitivity, hVISA prevalence determined by the macromethod E test can be expected to be 6-17% lower than that determined by PAP. Therefore, hVISA prevalence (50.7% of MRSA isolates) in this study was greater than that (1.3-6.1% of MRSA isolates) found in previous studies in Korea [9-11]. hVISA is quite common, and its presence may be increasing in Korea.
It is controversial whether the presence of hVISA is associated with increased treatment failure. Horne et al. [20] reported that the rates of treatment failure were not statistically different be- tween patients with hVISA and VSSA infection from MRSA clini- cal isolates. Musta et al. [19] reported that hVISA infection was not significantly associated with persistent MRSA bacteremia.
However, Bae et al. [23] reported that MRSA bloodstream iso- lates from patients with hVISA had a higher rate of persistent bacteremia (P =0.029). Charles et al. [18] reported that hVISA infection from patients with MRSA bacteremia had a longer du- ration of fever (P <0.001), a greater number of positive blood cultures (P <0.001), a longer time until clearance of bacteremia (P =0.002), and a longer hospital stay (P =0.006). In our study, hVISA was nearly associated with treatment failure in patients with SAB, and significantly associated with treatment failure in patients with SAP. Patients with previous surgery and prior van- comycin therapy exhibit vancomycin selection pressure, which can cause VSSA to become more resistant to vancomycin [38].
Thus, VSSA isolates develop into hVISA. hVISA isolates may fail to respond to therapeutic doses of vancomycin. A significant as- sociation between the initial vancomycin trough level and van- comycin treatment failure was reported previously [39].
It is also controversial whether hVISA increases 30-day mor- tality for patients. Maor et al. [21] reported that death was re- lated to hVISA sepsis in eight (50%) of 16 patients with MRSA bacteremia. Neoh et al. [24] reported that hVISA infection was significantly associated with 30-day mortality in patients with
MRSA bacteremia. However, Bae et al. [23] reported that in- hospital mortality did not differ between hVISA- and non-hVISA- infected patients with MRSA bacteremia. Fong et al. [22] re- ported that there was no significant difference in 30-day mortal- ity between hVISA- and VSSA-infected patients with persistent MRSA infection. In our study, hVISA was not associated with 30-day mortality in patients with SAB or SAP. Patients with per- sistent bacteremia generally receive an alternative antibiotic treatment, such as linezolid, rifampicin, and fusidic acid, and these antibiotics may resolve persistent bacteremia and reduce 30-day mortality [40].
In our study, patients were hardly treated with therapeutic drug monitoring (TDM) of vancomycin (≤10% of the patients;
clinicians seldom ordered vancomycin TDM in this study pe- riod). Thus, the relationship between the TDM and hVISA and/
or clinical outcomes could not be analyzed. This is a limitation in our study.
In summary, 34.5% of S. aureus isolates and 50.7% of MRSA isolates exhibited the hVISA phenotype in our study. hVISA is quite common, and its presence may be increasing in Korea.
hVISA is nearly associated with treatment failure in patients with SAB and is significantly associated with treatment failure in pa- tients with SAP. Concordance between the macromethod and GRD E tests is 84.2%. Macromethod E test should be employed in clinical microbiology laboratories.
Authors’ Disclosures of Potential Conflicts of Interest
No potential conflicts of interest relevant to this article were re- ported.
Acknowledgments
This study was supported by a Research Institute for Conver- gence of Biomedical Science and Technology Grant (30-2012- 012), Pusan National University Yangsan Hospital. Kyung-Jun Kim is acknowledged for his technical assistance.
REFERENCES
1. Klevens RM, Morrison MA, Nadle J, Petit S, Gershman K, Ray S, et al.
Invasive methicillin-resistant Staphylococcus aureus infections in the United States. JAMA 2007;298:1763-71.
2. Appelbaum PC. The emergence of vancomycin-intermediate and van- comycin-resistant Staphylococcus aureus. Clin Microbiol Infect 2006;
12(S1):S16-23.
3. Cui L, Ma X, Sato K, Okuma K, Tenover FC, Mamizuka EM, et al. Cell wall thickening is a common feature of vancomycin resistance in Staph- ylococcus aureus. J Clin Microbiol 2003;41:5-14.
4. Hiramatsu K. Vancomycin-resistant Staphylococcus aureus: a new model of antibiotic resistance. Lancet Infect Dis 2001;1:147-55.
5. Hiramatsu K, Hanaki H, Ino T, Yabuta K, Oguri T, Tenover FC. Methicil- lin-resistant Staphylococcus aureus clinical strain with reduced vanco- mycin susceptibility. J Antimicrob Chemother 1997;40:135-6.
6. Hiramatsu K, Aritaka N, Hanaki H, Kawasaki S, Hosoda Y, Hori S, et al.
Dissemination in Japanese hospitals of strains of Staphylococcus aure- us heterogeneously resistant to vancomycin. Lancet 1997;350:1670-3.
7. Sieradzki K, Roberts RB, Haber SW, Tomasz A. The development of vancomycin resistance in a patient with methicillin-resistant Staphylo- coccus aureus infection. N Engl J Med 1999;340:517-23.
8. Smith TL, Pearson ML, Wilcox KR, Cruz C, Lancaster MV, Robinson- Dunn B, et al. Emergence of vancomycin resistance in Staphylococcus aureus. Glycopeptide-Intermediate Staphylococcus aureus Working Group. N Engl J Med 1999;340:493-501.
9. Kim MN, Pai CH, Woo JH, Ryu JS, Hiramatsu K. Vancomycin-interme- diate Staphylococcus aureus in Korea. J Clin Microbiol 2000;38:3879- 81.
10. Kim MN, Hwang SH, Pyo YJ, Mun HM, Pai CH. Clonal spread of Staph- ylococcus aureus heterogeneously resistant to vancomycin in a univer- sity hospital in Korea. J Clin Microbiol 2002;40:1376-80.
11. Song JH, Hiramatsu K, Suh JY, Ko KS, Ito T, Kapi M, et al. Emergence in Asian countries of Staphylococcus aureus with reduced susceptibility to vancomycin. Antimicrob Agents Chemother 2004;48:4926-8.
12. Park KH, Kim ES, Kim HS, Park SJ, Bang KM, Park HJ, et al. Compari- son of the clinical features, bacterial genotypes and outcomes of pa- tients with bacteremia due to heteroresistant vancomycin-intermediate Staphylococcus aureus and vancomycin-susceptible S. aurues. J Anti- microb Chemother 2012;67:1843-9.
13. Wootton M, Howe RA, Hillman R, Walsh TR, Bennett PM, MacGowan AP. A modified population analysis profile (PAP) method to detect het- ero-resistance to vancomycin in Staphylococcus aureus in a UK hospi- tal. J Antimicrob Chemother 2001;47:399-403.
14. Howden BP, Davies JK, Johnson PDR, Stinear TP, Grayson ML. Re- duced vancomycin susceptibility in Staphylococcus aureus, including vancomycin-intermediate and heterogeneous vancomycin-intermediate strains: resistance mechanisms, laboratory detection, and clinical impli- cations. Clin Microbiol Rev 2010;23:99-139.
15. Yusof A, Engelhardt A, Karlsson A, Bylund L, Vidh P, Mills K, et al. Eval- uation of a new E test vancomycin-teicoplanin strip for detection of gly- copeptide-intermediate Staphylococcus aureus (GISA), in particular, heterogeneous GISA. J Clin Microbiol 2008;46:3042-7.
16. Leonard SN, Rossi KL, Newton KL, Rybak MJ. Evaluation of the E test GRD for the detection of Staphylococcus aureus with reduced suscepti- bility to glycopeptides. J Antimicrob Chemother 2009;63:489-92.
17. Satola SW, Farley MM, Anderson KF, Patel JB. Comparison of detection methods for heteroresistant vancomycin-intermediate Staphylococcus aureus, with the population analysis profile method as the reference method. J Clin Microbiol 2011;49:177-83.
18. Charles PG, Ward PB, Johnson PD, Howden BP, Grayson ML. Clinical features associated with bacteremia due to heterogeneous vancomycin- intermediate Staphylococcus aureus. Clin Infect Dis 2004;38:448-51.
19. Musta AC, Riederer K, Shemes S, Chase P, Jose J, Johnson LB, et al.
Vancomycin MIC plus heteroresistance and outcome of methicillin-re- sistant Staphylococcus aureus bacteremia: trends over 11 years. J Clin Microbiol 2009;47:1640-4.
20. Horne KC, Howden BP, Grabsch EA, Graham M, Ward PD, Xie S, et al.
Prospective comparison of the clinical impacts of heterogeneous vanco- mycin-intermediate methicillin-resistant Staphylococcus aureus (MRSA) and vancomycin-susceptible MRSA. Antimicrob Agents Chemother 2009;53:3447-52.
21. Maor Y, Rahav G, Belausov N, Ben-David D, Smollan G, Keller N. Prev- alence and characteristics of heteroresistant vancomycin-intermediate Staphylococcus aureus bacteremia in a tertiary care center. J Clin Mi- crobiol 2007;45:1511-4.
22. Fong RK, Low J, Koh TH, Kurup A. Clinical features and treatment out- comes of vancomycin-intermediate Staphylococcus aureus (VISA) and heteroresistant vancomycin-intermediate Staphylococcus aureus (hVI- SA) in a tertiary care institution in Singapore. Eur J Clin Microbiol Infect Dis 2009;28:983-7.
23. Bae IG, Federspiel JJ, Miró JM, Woods CW, Park L, Rybak MJ, et al.
Heterogeneous vancomycin-intermediate susceptibility phenotype in bloodstream methicillin-resistant Staphylococcus aureus isolates from an international cohort of patients with infective endocarditis: prevalence, genotype, and clinical significance. J Infect Dis 2009;200:1355-66.
24. Neoh HM, Hori S, Komatsu M, Oguri T, Takeuchi F, Cui L, et al. Impact of reduced vancomycin susceptibility on the therapeutic outcome of MRSA bloodstream infections. Ann Clin Microbiol Antimicrob 2007;
6:13.
25. CLSI. Performance standards for antimicrobial susceptibility testing.
Twenty-fifth Informational supplement. CLSI document M100-S25.
Wayne, PA: Clinical and Laboratory Standards Institute, 2015.
26. Levy MM, Fink MP, Marshall JC, Abraham E, Angus D, Cook D, et al.
2001 SCCM/ESICM/ACCP/ATS/SIS International Sepsis Definitions Con- ference. Crit Care Med. 2003;31:1250-6.
27. Guilarde AO, Turchi MD, Martelli CM, Primo MG. Staphylococcus aure- us bacteraemia: incidence, risk factors and predictors for death in a Brazilian teaching hospital. J Hosp Infect 2006;63:330-6.
28. Durack DT, Lukes AD, Bright DK. New criteria for diagnosis of infective endocarditis: utilization of specific echocardiographic findings. Duke Endocarditis Service. Am J Med 1994;96:200-9.
29. Harbarth S, Rutschmann O, Sudre P, Pittet D. Impact of methicillin re- sistance on the outcome of patients with bacteremia caused by Staphy- lococcus aureus. Arch Intern Med 1998;158:182-9.
30. Lew DP and Waldvogel FA. Osteomyelitis. Lancet 2004;364:369-79.
31. Mylotte JM and Tayara A. Staphylococcus aureus bacteremia: predictors of 30-day mortality in a large cohort. Clin Infect Dis 2000;31:1170-4.
32. Horan TC, Gaynes RP, Martone WJ, Jarvis WR, Emori TG. CDC defini- tions of nosocomial surgical site infections, 1992: a modification of CDC definitions of surgical wound infections. Infect Control Hosp Epidemiol 1992;13:606-8.
33. González C, Rubio M, Romero-Vivas J, González M, Picazo JJ. Bactere- mic pneumonia due to Staphylococcus aureus: A comparison of dis- ease caused by methicillin-resistant and methicillin-susceptible organ- isms. Clin Infect Dis 1999;29:1171-7.
34. Kumar M, Biswal N, Bhuvaneswari V, Srinivasan S. Persistent pneumo- nia: Underlying cause and outcome. Indian J Pediatr 2009;76:1223-6.
35. Rybak MJ, Leonard SN, Rossi KL, Cheung CM, Sader HS, Jones RN.
Characterization of vancomycin-heteroresistant Staphylococcus aureus from the metropolitan area of Detroit, Michigan, over a 22-year period (1986 to 2007). J Clin Microbiol 2008;46:2950-4.
36. van Hal SJ and Paterson DL. Systemic review and meta-analysis of the significance of heterogeneous vancomycin-intermediate Staphylococ- cus aureus isolates. Antimicrob Agents Chemother 2011;55:405-10.
37. Liu C and Chambers HF. Staphylococcus aureus with heterogeneous resistance to vancomycin: epidemiology, clinical significance, and criti- cal assessment of diagnostic methods. Antimicrob Agents Chemother 2003;47:3040-5.
38. Sieradzki K and Tomasz A. Alterations of cell wall structure and metabo- lism accompany reduced susceptibility to vancomycin in an isogenic series of clinical isolates of Staphylococcus aureus. J Bacteriol 2003;
185:7103-10.
39. Kullar R, Davis SL, Levine DP, Rybak MJ. Impact of vancomycin expo- sure on outcomes in patients with methicillin-resistant Staphylococcus aureus bacteremia: support for consensus guidelines suggested targets.
Clin Infect Dis 2011;52:975-81.
40. Howden BP, Ward PB, Charles PG, Korman TM, Fuller A, du Cros P, et al. Treatment outcomes for serious infections caused by methicillin-re- sistant Staphylococcus aureus with reduced vancomycin susceptibility.
Clin Infect Dis 2004;38:521-8.