Printed in the Republic of Korea https://doi.org/10.5012/jkcs.2017.61.1.29
Formation of Au Particles in Cu
2−xICu
2IIO
3−δ(x
≈0.20; δ
≈0.10) Oxide Matrix by Sol-Gel Growth
Bidhu Bhusan Das*, Kuppan Palanisamy, Potu venugopal, Eesam Sandeep, and Karrothu Varun Kumar Functional Materials Chemistry Laboratory, Department of Chemistry, Pondicherry University, Pondicherry 605014, India.
*E-mail:[email protected].
(Received August 26, 2016; Accepted December 27, 2016)
ABSTRACT. Formation of Au particles in nonstoichiometric Cu2−xICu2IIO3−δ (x≈ 0.20; δ ≈ 0.10) oxide from aniline + hydrochloric acid mixtures and chloroauric acid in the ratios 30 : 1; 60 : 1; 90 : 1 (S1-S3) by volume and 0.01 mol of copper acetate, Cu(OCOCH3)2.H2O, in each case is performed by sol-gel growth. Powder x-ray diffraction (XRD) results show Au particles are dispersed in tetragonal nonstoichiometric dicopper (I) dicopper (II) oxides, Cu2−xICu2IIO3−δ (x≈ 0.20; δ ≈ 0.10). Average crystallite sizes of Au particles determined using Scherrer equation are found to be in the approximate ranges ~85−140 Å, ~85−150 Å and ~80−150 Å in S1-S3, respectively which indicate the formation of Au nano-micro size particles in Cu2−xICu2IIO3−δ (x≈ 0.20; δ ≈ 0.10)oxides.
Hysteresis behaviour at 300 K having low loop areas and magnetic susceptibility values ~ 5.835×10⁻⁶−9.889×10⁻⁶ emu/gG in S1-S3 show weakly ferromagnetic nature of the samples. Broad and isotropic electron paramagnetic resonance (EPR) lineshapes of S1-S4 at 300, 77 and 8 K having giso-values ~2.053±0.008−2.304±0.008 show rapid spin-lattice relaxation process in magnetic Cu2+ (3d9) sites as well as delocalized electrons in Au (6s1) nano-micro size particles in the Cu2−xICu2IIO3−δ (x≈ 0.20; δ ≈ 0.10) oxides. Broad and weak UV-Vis diffuse reflectance optical absorption band ~725 nm is assigned to 2B1g→2A1g transitions, and the weak band ~470 nm is due to 2B1g→2Eg transitions from the ground state 2B1g (|dx2
-y2>) of Cu2+ (3d9) ions in octahedral coordination having tetragonal distortion.
Key words: Sol-gel growth, Powder X-ray diffraction, Hysteresis loop, Electron paramagnetic resonance (EPR)
INTRODUCTION
Research in composite materials1−3 is one of the thrust areas in materials chemistry and physics because of their wide application potentials. Sol-gel growth2,4,5 of com- posite materials via various precursor routes is one of the most efficient and widely used processes for preparing the composite materials. A class of composite materials com- prises dispersion of metal nanoparticles/clusters in host metal oxide matrices1. Considering the wide application potentials of dispersed particles or clusters of Au or alike precious metals1−3 in this report, we discuss our salient results on the formation of gold nano-micro size particles in Cu4O3 oxides from copper acetate, chloroauric acid, aniline and hydrochloric acid precursors by sol-gel2,4,5 growth using a variety of direct structure - sensitive solid state techniques as described in the experimental section.
EXPERIMENTAL
Reagent grade chemicals are used to prepare the sam- ples. Three mixtures each containing 15 ml of toluene and 1:1 ratios by volume of aniline (C6H7N) and HCl are mixed with a fixed weight of chloroauric acid, HAuCl4 , (0.002 M)
in the ratios 30:1; 60:1; 90:1 by volume to prepare three sam- ples S1-S3, respectively. To each of the resulting solution 0.01 mol of copper acetate, Cu(OCOCH3)2.H2O, and 30 ml of 0.002 M citric acid solutions are added after stirring for 30 min. The resulting sol is air dried by stirring continuously for 15−25 h at 300 K until gel is obtained in each case. The gel thus formed are decomposed at ~400 K, and finally sintered in the range 673−773 K to obtain the finely pow- der samples.
Powder XRD patterns of the samples are recorded on a X-ray diffractometer (Model X’pert powder XRD) using Cu Kα1 radiation (λ=1.5406 Å) at 30 kV/40 mA power.
Scanning electron micrographs (SEM) are recorded using
‘Hitachi-S3400’ scanning electron microscope and energy dispersive analysis of X-rays (EDX) by ‘Super dryer-II’
model analyzer attached to the scanning electron micro- scope. Chemical analysis is done by wet chemistry meth- od6 and the density values of the samples are determined by liquid displacement method using carbon tetrachloride as the immersion liquid (density 1.596 g/cc at 300 K). Mag- netic moments at 300 K are measured using a vibrating sample magnetometer (VSM) (Model 7404 Series) in the magnetic field range ±10 kG. X-band EPR data at 300 K are recorded on a JEOL-JES-TE100-ESR spectrometer
system with 100 kHz magnetic field modulation. The g- values of the EPR lineshapes at 300 K are calibrated with respect to the resonance line of tempol (gTempol = 2.0032) which is used as a ‘field marker’. EPR data at 77 and 8 K are recorded at X-band on a Varian EPR spectrometer sys- tem using an Air Products Helitran cryostat. The magnetic field is calibrated using a Varian NMR Gaussmeter. Ultra- violet-visible diffuse reflectance spectra of the pressed pow- der samples recorded over the range 200−800 nm using a Varian model 5000 UV-VIS-NIR spectrophotometer fitted with external diffuse reflectance accessory (model External DRA 2500) consisting of a 150 mm diameter integrating sphere.
RESULTS AND DISCUSSION
Fig. 1 shows the observed powder XRD patterns of the samples S1-S3 prepared by sol-gel method as described in previous section. The peaks at the diffraction angles 38.2354°, 44.4493°, 64.6542° and 77.8077° in 2θ of S1-S3 are ascer- tained from earlier reported data as due to Au crystallites in the samples.7−9 The unit cells corresponding to the above peaks in the diffraction patterns determined using Full- prof (version 3.90) software package10 are found to be cubic having space group Fm-3m, and the corresponding unit cell parameters are found to be: a = 4.0742, 4.0764 and 4.0772 Å, respectively in S1-S3. This result is in agree- ment with the Au crystals reported earlier.7−9 Indexed lattice planes of Au crystals corresponding to the above diffrac- tion peaks in S1-S3 are shown in Fig. 1. Rest of the peaks of the diffraction patterns of the samples S1-S3 are found to be akin to tetragonal dicopper(I) dicopper(II) oxide, Cu2ICu2IIO3, phase in the samples.11 The lattice parameters determined from the diffraction peaks are shown in Table 1.
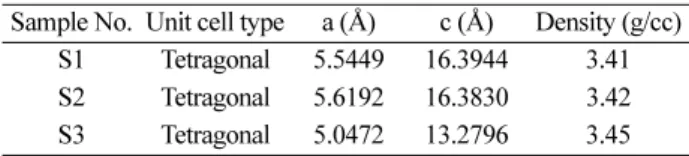
Average crystallites sizes of the dispersed Au crystal- lites determined by Scherrer equation12 are found to be in the ranges ~85−140 Å, ~85−150 Å and ~80−150Å in S1-S3, respectively. These results indicate the formation of dis- persed Au particles in nano-micro size ranges in the sam- ples. However, it may be mentioned that Scherrer relation probes only the approximate average crystallite sizes of the particles. Moreover, the fullwidth at half of the max- imum heights of the diffraction peaks have contribution from the instrumental broadening. Hence the above ranges of the average crystallite sizes of dispersed Au particles are presented with less precession. Chemical analysis result shows the concentrations of Cu1+ (3d10) and Cu2+ (3d9) ions are of the order of ~1022 ions/g in S1-S3 having con- centrations of Cu1+ (3d10) ions marginally less than those of Cu2+ (3d9) ions in each sample. It may be mentioned that the Cu+ ions are formed by partial reduction of Cu2+ ions in the oxide matrices during the formation of the final prod- uct. From the above chemical analysis result we conclude that the Au crystallites are dispersed in nonstoichiometric dicopper(I) dicopper(II) oxide, Cu2−xICu2IIO3−δ, (nonstoichi- ometry parameters: x ≈ 0.20; δ ≈ 0.10) phase in the sam- ples. Slight variation is lattice parameters in S3 as compared with those of S1 and S2 could be attributed to the bulk- iness of the precursor materials as well as the time of pro- cessing of the samples. Observed values of the densities (Table 1) show marginal variation in S1 to S3 which could also be attributed to the role of the bulkiness of the inter- mediate solvents during the solid state reaction on the for- mation of Cu2−xICu2IIO3−δ (x ≈ 0.20; δ ≈ 0.10) and the dispersion of Au crystallites in Cu2ICu2IIO3+δ (x ≈ 0.20; δ ≈ 0.10).
Fig. 2 shows the SEM micrographs of samples S1-S3.
The micrographs show somewhat porous surface structures with distributed dense phases of dispersed Au particles as irregular shiny structures. Representative EDX profile of sample S2 is shown in Fig. 3. The EDX profiles of the sam- ples are fairly in conformity with the formation of Au par- ticles in nonstoichiometric dicopper(I) dicopper(II) oxides.
However, trace amounts of K and Cl are also detected in the samples as impurities. Presence of K and Cl appear to be the impurities in the precursor chloroauric acid, HAu- Cl4.
Figure 1. Observed powder XRD patterns of samples S1-S3.
Indexed lattice planes are of dispersed Au particles diffraction peaks.
Table 1. Lattice parameters and observed densities of Cu2−xI
Cu2IIO3−δ (x≈ 0.20; δ ≈ 0.10) of samples S1-S3
Sample No. Unit cell type a (Å) c (Å) Density (g/cc) S1 Tetragonal 5.5449 16.3944 3.41 S2 Tetragonal 5.6192 16.3830 3.42 S3 Tetragonal 5.0472 13.2796 3.45
Fig. 4 shows the magnetic moments versus magnetic fields plots in the range ±10 kG at 300 K of the samples S1-S3. Hysteresis behaviour of the samples having very low loop areas shows weakly ferromagnetic nature of the samples at 300 K. Calculated values of the fairly low aver- age magnetic susceptibilities: 9.889×10⁻⁶ emu/gG, 9.745
×10−6 emu/gG and 5.835×10⁻⁶ emu/gG of the samples S1- S3, respectively are in agreement with weakly ferromag-
netic nature of the samples at 300 K also. However, it may be mentioned here that these composite metal-metal oxide samples contain Cu2+(3d9) ions and Au (6s1) atoms as the magnetic sites, and the contribution of the individual ions/
atoms to the magnetic behavoiur of the samples could be interpreted from the EPR response of the samples described in the next section.
Figure 2. SEM micrographs of the samples, (a) S1, (b) S2 and (c) S3.
Figure 3. EDX profile of the representative sample S2.
Figure 4. Magnetic moment versus magnetic field plots of S1- S3 at 300 K.
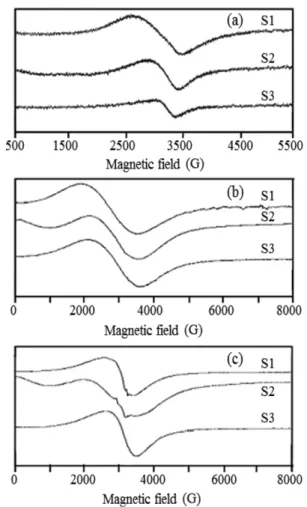
Figure 5. Observed X-band EPR lineshapes at (a) 300 K, (b) 77 K and (c) 8 K of the samples S1-S3.
Fig. 5 shows the observed EPR lineshapes of the samples S1-S3 at 300, 77 and 8 K. All the EPR lineshapes of S1-S3 at 300, 77 and 8 K are broad and isotropic in nature with- out any hyperfine structures. The observed giso-values of the EPR lineshapes are presented in Table 2. The mag- nitudes of the giso-values show significant positive g-shift with respect to the free electron ge-value = 2.00231913 which indicates that the lineshapes are predominantly due to the Cu2+ (3d9) sites14−16 of the Cu2−xICu2IIO3−δ (x≈ 0.20; δ ≈ 0.10) oxides. The broad unresolved lineshapes are attributed mainly due to the rapid spin-lattice relaxation time of the Cu2+ (3d9) sites in Cu2−xICu2IIO3−δ (x≈ 0.20; δ ≈ 0.10) oxides and also partly due to the highly delocalized Au (6s1) elec- trons in the nano-micro size Au metal particles containing cluster of atoms. Indication of very poor hyperfine features in some of the samples at 77 K and 8 K are due to 63 or 65Cu nuclei (nuclear spin I=3/2) hyperfine interactions. Fairly similar giso-values14-16 in the samples in the overall range ~2.053±
0.008−2.333±0.008 indicates the similar magnetic site symmetry distribution in the samples over the range 300-8 K.
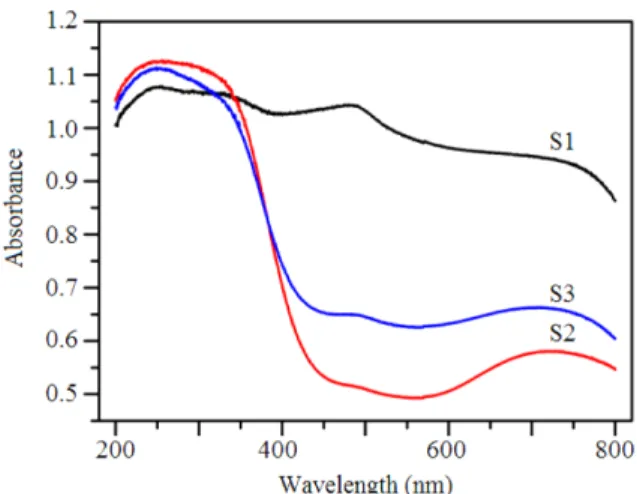
Fig. 6 shows the observed Ultraviolet-visible diffuse reflectance absorption spectra of the samples S1-S3 at 300 K. The spectra show metal-ligand charge-transfer bands
~240−350 nm caused by O2− ligands on UV exposure.17 Cu2+, being a d9 ion, experiences a strong Jahn-Teller dis-
tortion which leads to the splitting of the d-orbital energy levels18 and causes predominantly an elongated octahedral coordination with four short in-plane and two longer axial σ-bonds (D4h symmetry). Accordingly, the following three transitions, viz. 2B1g→2A1g, 2B1g→2B2g and 2B1g→2Eg are expected from the ground state18 B1g(|dx2
-y2>). But nor- mally only a single optical absorption maximum is observed in most of the cases.19 This single optical band is interpreted as the overlap of all the three transitions and is assigned to
2B1g→2B2g transitions.20 However, in the present case, the observed weak band ~470 nm is due to the 2B1g→2Eg tran- sitions,21 and the very broad and the weak absorption band
~725 nm is assigned to 2B1g→2A1g transitions19 in Cu2+ (3d9) ions in octahedral coordination having tetragonal distortion.
CONCLUSION
Sol-gel method is used to disperse Au particles in Cu2−xI Cu2IIO3−δ (x≈ 0.20; δ ≈ 0.10) oxide matrices. Powder XRD results and chemical analysis of the samples show rather nano-micro size Au particles are dispersed in tetragonal nonstoichiometric dicopper(I) dicopper(II) oxides, Cu2−xI Cu2IIO3−δ (x≈ 0.20; δ ≈ 0.10). Presence of hysteresis loops in the magnetic moments versus magnetic field plots having low loop areas show weakly ferromagnetic nature of the samples at 300 K. Observed EPR lineshapes of the sam- ples are broad and isotropic having giso-values in the range
~2.053±0.008−2.333±0.008 at 8, 77 and 300 K. The broad EPR lineshapes are due to the rapid spin-lattice relaxation process of the excited Cu2+ (3d9) sites in Cu2−xICu2IIO3−δ (x≈ 0.20; δ ≈ 0.10) oxide and also due to the delocalization of the Au (6s1) electrons in the dispersed Au nano-micro particles in Cu2−xICu2IIO3−δ (x≈ 0.20; δ ≈ 0.10) oxides. Ultra- violet-visible diffuse reflectance optical absorption spectra of samples S1-S3 show metal-ligand charge-transfer bands
~240−350 nm caused by O2− ligands on UV exposure, and d-d transitions ~470 nm and ~725 nm in Cu2+ (3d9) ions in octahedral coordination with tetragonal distortion in Cu2−xICu2IIO3−δ (x≈ 0.20; δ ≈ 0.10) oxides.
Acknowledgments. Publication cost of this paper was supported by the Korean Chemical Society.
REFERENCES
1. Jing-Si, W.; Fa-Zheng, J.; Hui-Chao, M.; Xiao-Bo, L.;
Ming-Yang, L.; Jing-Lan, K.; Gong-Jun, C.; Yu-Bin, D.
Inorg. Chem. 2016, 55, 6685.
2. Manna, A.; Imae, T.; Iida, M.; Hisamatsu, N. Langmuir Table 2. Observed giso-values at 300 K, 77 K and 8 K of samples
S1-S3
Sample No. giso-values
300 K 77 K 8 K
S1 2.187±0.009 2.333±0.008 2.101±0.008 S2 2.304±0.009 2.207±0.008 2.207±0.007 S3 2.255±0.009 2.183±0.008 2.053±0.008
Figure 6. Observed UV-Vis diffuse reflectance optical absorp- tion spectra of samples S1-S3 at 300 K.
2001, 17, 6000.
3. Manna, A.; Imae, T.; Yogo, T.; Akai, K.; Okai, M. J. Col- loid Interface Sci. 2002, 256, 297.
4. Hench, L. L.; West, J. K. Chem. Rev. 1990, 90, 33.
5. Yue, Z.; Li, L.; Zhou, J.; Zhang, H.; Gui, Z. Mater. Sci.
Eng. 1999, B64, 68.
6. Vogel, A. I. Textbook of Quantitative Chemical Analysis;
English Language Book Society: Longman, Essex, 1989;
p. 368.
7. Maeland, A.; Flanagan, T. B. Can. J. Phys. 1964, 42, 2364.
8. Owen, E. A.; Yates, E. L. J. Chem. Phys. 1935, 3, 605.
9. Suh, I.K.; Ohta, H.; Waseda, Y. J. Mater. Sci. 1988, 23, 757.
10. Roisnel, T.; Rodríquez-Carvajal, J. Mater. Sci. Forum 2001, 378-381, 118.
11. Morgan, P. E. D.; Partin, D. E.; Chamberland, B. L.;
O’Keeffe, M. J. Solid State Chem. 1996, 121, 33.
12. Patterson, A. L. Phys. Rev. 1939, 56, 978.
13. Bersohn, M.; Baird, A.C. An Introduction to Electron Para Magnetic Resonance; W. A. Benjamin, Inc.: New York, 1966; p. 66.
14. Das, B. B.; Aruna, S. Indian. J. Chem. 2003, 42A, 1590.
15. Das, B. B.; Deepa, J. Non-Cryst. Solids 2009, 355, 1663.
16. Das, B. B.; Srinivassan, A.; Yogapriya, M.; Kongara, M.
R.; Punnoose, A. J. Non-Cryst. Solids 2015, 427, 146.
17. Sohn, K. S.; Cho, B.; Park, H. D. J. Am. Ceram. Soc. 1999, 82, 2779.
18. Ohishi, Y.; Mitachi, S.; Kanamori, T.; Manabe, T. Phys.
Chem. Glasses 1983, 24, 135.
19. Balhausen, C. J. Introduction to Ligand Field Theory;
McGraw-Hill Book Company Inc: New York; 1962, p.
269.
20. Belford, R. L.; Calvin, M.; Belford, G. J. Chem. Phys.
1957, 26, 1165.
21. Chandra, S.; Gupta, K. Transition Met. Chem. 2002, 27, 329.