INTRODUCTION
Hepatocellular carcinoma (HCC) is the fifth most common tumor in the world, and the incidence of HCC has been increas- ing rapidly, especially in western countries (1, 2). Imaging diag- nosis is essential for planning the treatment and management of HCC. Contrast-enhanced ultrasound, contrast-enhanced com- puted tomography (CT), and magnetic resonance imaging (MRI) have made it possible to accurately detect and character-
ize HCC (3-5). MRI is particularly useful due to its high tissue contrast and the availability of tissue-specific contrast agents.
Various liver-specific MRI contrast agents have been introduced to increase the accuracy of hepatic imaging (6-8). Gadoxetic acid (Eovist or Primovist, Bayer Schering: Berlin, Germany) has been approved for hepatic imaging and is being widely used (9- 12). It is a liver-specific hepatobiliary contrast agent which can also be used extracellularly. It is taken up by functioning hepato- cytes and up to 50% is excreted into the bile (9, 13). There have
J Korean Soc Radiol 2013;69(3):213-222 http://dx.doi.org/10.3348/jksr.2013.69.3.213
Received May 9, 2013; Accepted June 26, 2013 Corresponding author: Jin-Young Choi, MD Department of Radiology, Severance Hospital, Yonsei University College of Medicine, 50 Yonsei-ro, Seodaemun-gu, Seoul 120-752, Korea.
Tel. 82-2-2228-7400 Fax. 82-2-393-3035 E-mail: [email protected]
This is an Open Access article distributed under the terms of the Creative Commons Attribution Non-Commercial License (http://creativecommons.org/licenses/by-nc/3.0) which permits unrestricted non-commercial use, distri- bution, and reproduction in any medium, provided the original work is properly cited.
Purpose: To compare diffusion-weighted imaging (DWI) and gadoxetic acid-en- hanced (Gdx) magnetic resonance imaging (MRI), whether alone or in combination, for the detection of hepatocellular carcinoma (HCC) by using 3 T.
Materials and Methods: 84 HCCs in 66 patients (57 men, 9 women; mean age 69.2 years) were examined using 3 T MRI. DWI (b values 0, 50, and 800 sec/mm2) and dy- namic gadoxetic acid-enhanced MRI as well as hepatobiliary phase were performed.
Images were retrospectively reviewed by two radiologists to compare the diagnostic performances of DWI and Gdx MRI alone and in combination for the detection of HCC. Alternative free response receiver operating characteristic analysis and com- parison of sensitivities were used for statistical analysis.
Results: The sensitivity of Gdx set (73/84, 87%) was significantly higher than that of DWI set (60.5/84, 72%) for both observers. The Az values of DWI and Gdx MRI for the detection of HCC were not statistically significant for either observer (Az for DWI = 0.818 and 0.864, Az for Gdx MR = 0.902 and 0.842, respectively, p = 0.107 for observer 1 and p = 0.738 for observer 2). The combination of both techniques did not increase the sensitivities of detecting HCC in either observer. When lesions smaller than 2 cm were considered, the DWI set yielded a significantly lower sensi- tivity as compared with either the Gdx set alone or the combination set.
Conclusion: Gadoxetic acid-enhanced MRI was better than DWI for detection the HCC by using 3 T MRI. The combination of DWI and Gdx MRI did not contribute to the successful detection of HCC.
Index terms
Hepatocellular Carcinoma Diffusion-Weighted Imaging Magnetic Resonance Imaging High-Field Magnetic Resonance Hepatobiliary Contrast Agent
Detection of Hepatocellular Carcinoma: Comparison of Gadoxetic Acid-Enhanced MRI, Diffusion-Weighted Imaging, and Combined Interpretation at 3 T MRI
1간세포암의 발견: 3테슬라 자기공명영상에서 확산강조영상, Gadoxetic Acid 조영증강영상, 두 영상 조합의 비교1
Seung Hyun Park, MD
1, Yong Eun Chung, MD
1, Hye Suk Hong, MD
2, Ki Whang Kim, MD
1, Myeong-Jin Kim, MD
1, Jin-Young Choi, MD
11Department of Radiology and Research Institute of Radiological Science, Severance Hospital, Yonsei University College of Medicine, Seoul, Korea
2Department of Radiology, Hallym University College of Medicine, Seoul, Korea
tients (56 men, 9 women; range 36-80 years, mean age 58.5 years) were included in this study. 49 patients had solitary le- sions, 13 had two lesions, and three had three lesions. 51 pa- tients had hepatitis B-related cirrhosis, 5 had hepatitis C-related cirrhosis, 2 had alcoholic cirrhosis, and the remaining 7 had no known underlying diseases. A total of 84 HCCs were identified in these 65 patients. A diagnosis of HCC was based on surgical findings (n = 31), percutaneous biopsy (n = 5), a typical clinical history and tumor marker levels in combination with lipiodol uptakes after TACE or the progressions of the disease as depict- ed on follow-up CT or MRI obtained at least one year after the initial imaging (n = 30).
Magnetic Resonance Imaging
All MRI examinations were performed using a 3 T imaging system (MAGNETOM Tim Trio, Siemens Healthcare sector, Erlangen, Germany), equipped with a phased-array coil (MAG- NETOM Tim Trio, Siemens, Erlangen, Germany). We did not use any anti-peristaltic agents or oral contrast agents.
The MRI protocol consisted of a breath-hold transverse T1- weighted in- and out-of-phase two-dimensional gradient-re- called echo (GRE) sequence [repetition time (TR)/in-phase echo time (TE), 150/2.4 msec; out-of-phase TE = 1.2 msec; flip angle, 65°; field of view, 32-38 × 25-29 cm; matrix, 256 × 256;
section thickness, 6 mm; slice spacing, 1.2 mm; one signal ac- quired; number of slices = 30]; a single slice turbo spin echo (TR/
TE, 466/148; field of view, 32-36 × 25-29 cm; matrix, 288 × 230;
section thickness, 4 mm; slice spacing, 1 mm) using the spectral fat suppression technique; and a breath-hold transverse three- dimensional (3D)-GRE (TR/TE, 2.5/0.9 msec; flip angle, 13°;
field of view, 32-36 × 25-36 cm; matrix, 320 × 224; section thick- ness, 2 mm; no gap; acquisition time, 23 sec).
For contrast-enhanced dynamic MRI, the gadoxetic acid di- sodium (Eovist or Primovist, Bayer Schering; 0.025 mmol/kg) was injected as a rapid bolus, immediately followed by a saline flush of 15-20 mL. A 3D spoiled GRE sequence with chemically selective fat suppression was performed during suspended res- piration 30-35 seconds (arterial phase), 65-70 seconds (portal phase), 100-120 seconds (hepatic venous phase) and five min- utes (equilibrium phase) following the injection of the intrave- nous contrast agent. Additional hepatobiliary phase images were obtained 20 minutes after injection. An automatic infusion been several reports stating that gadoxetic acid-enhanced (Gdx)
MRI improves the detection of HCC (4, 10, 11, 14). Furthermore, hepatobiliary phase imaging assists in surgical planning (14).
Recently, diffusion-weighted imaging (DWI) has been ap- plied to liver MRI. DWI is sensitive to the molecular diffusion of water in biological tissues, and recent technological advance- ments in MRI have enabled the production of high quality DWI images on the liver. DWI is therefore often incorporated into routine liver MRI. It has been reported that DWI improves the accuracy of detection of hepatic metastases as compared to that of superparamagnetic iron-oxide (SPIO)-enhanced MRI (15).
Moreover, higher signal to noise ratio at 3 T allows the use of higher b values, which are more sensitive to diffusion and less sensitive to transverse relaxation time (T2) and perfusion-relat- ed motion (16-18). However, the magnetic field inhomogene- ities that degrade diffusion-weighted images are exacerbated at 3 T (19-21). It is important to assess the diagnostic value of DWI for the detection of HCC in a high field system because 3 T MRI is widely used for routine liver imaging (19, 20). To our knowledge, there has been no literature comparing the diagnos- tic performances of DWI and gadoxetic acid-enhanced MR im- aging for the detection of HCC in the 3 T system. Therefore, the purpose of this study is to compare DWI, gadoxetic acid-en- hanced MRI, and a combination of both techniques for the de- tection of HCC at 3 T.
MATERIALS AND METHODS
Patients
This study was approved by our institutional review board, and informed consent was not required due to its retrospective nature. By searching the radiological reports of the Department of Radiology between May 2007 and January 2009, a total of 143 patients who underwent gadoxetic acid-enhanced and diffu- sion-weighted MRI for evaluation of HCC were found. MRI ex- aminations had been performed for ruled out or confirmed HCC because of suspected focal hepatic lesions on ultrasound or CT or due to elevated levels of serum tumor markers (alpha- fetoprotein or protein induced by vitamin K absence-II). The exclusion criteria were patients with a prior history of transarte- rial chemoembolization (TACE) (n = 60), radiofrequency abla- tion (n = 6), or more than five HCCs (n = 12). A total of 65 pa-
each lesion with the following four-point confidence rating scale: 1, definitely not HCC; 2, probably not HCC; 3, indetermi- nate; 4, probably HCC; 5, definitely HCC. Lesions rated as a 4 or 5 were classified as positive. Each lesion was documented as ac- curately as possible according to sizes and segmental locations using the template. All images were reviewed using a local pic- ture archiving and communication system monitor (Centricity;
GE Medical systems, Milwaukee, WI, USA). By comparing the scoring results from the two observers with the standard of refer- ence, we calculated the number of true-positive, true-negative, false-positive and false-negative lesions for each observer. Quan- titative analyses of ADCs were not performed because the aim of this study was to compare the sensitivity for detections of HCC.
Statistical Analysis
Statistical analyses were performed using statistical software (SPSS version 14.0, SPSS Inc., Chicago, IL, USA; MedCalc ver- sion 9.3.6.0, Mariakerke, Belgium). An alternative-free response receiver operating characteristic (ROC) curve was fitted to each observer’s confidence ratings using maximum likelihood esti- mation. Sensitivity of MRI for detecting HCCs were calculated according to the lesion sizes. The generalized estimating equa- tion method was used to compare the sensitivities, specificities, positive predictive values, and negative predictive values of the three MRI sets (Gdx, DWI, and the combined). Sensitivities were calculated as the number of true-positive lesions divided by the total number of HCCs. p values less than < 0.05 were considered statistically significant.
RESULTS
The areas under the ROC curve (Az) for each observer’s abili- system (Sonic shot 50, Nemoto Kyorindo Co., Ltd., Tokyo, Ja-
pan) was used. The actual pulse sequence started manually when the fluoroscopic sequence revealed that the contrast mate- rial bolus had reached the abdominal aorta.
Respiratory-triggered fat-suppressed single-shot echo-planar diffusion-weighted imaging was performed in the transverse plane with tri-directional diffusion gradients by using three val- ues (b values = 0, 50, 800 s/mm2). The other parameters for DWI were as follows: TR/TE, 2000/88; flip angle, 150 degrees; field of view, 400 mm; matrix, 192 × 108; section thickness, 5 mm; slice spacing, 6 mm; one signal acquired; number of slices = 96.
Image Analysis
Two radiologists (H.S.H., Y.E.C. with nine and five years of experience in abdominal imaging, respectively) independently reviewed three sets of MR images in random order: the DWI set [unenhanced T1-weighted images, DWI, and apparent diffu- sion coefficient (ADC) map]; the Gdx set (unenhanced, gadox- etic acid-enhanced dynamic and hepatobiliary phase images);
and a combination set of both techniques. The two observers were blinded to the patient history, laboratory results, findings of other imaging modalities and final diagnosis. The interval be- tween the reviews of the two sets of images was at least one month. The criteria for diagnosis of HCC were as follows (12- 14, 22, 23): I) a nodule with increased enhancement on arterial phase and washout on late venous or equilibrium phases; II) a nodule with arterial enhancement and hypointensity on hepato- biliary phase; III) a nodule larger than 1.5 cm with no uptake of contrast agent on hepatobiliary phase images; IV) a nodule showing hyperintensity on DWI and with almost equivalent or lower ADCs as compared with that of the surrounding liver pa- renchyma. Each observer recorded the possibility of HCC for
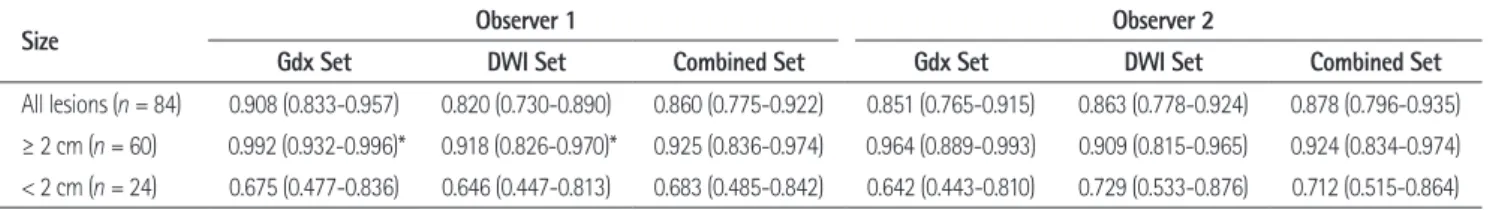
Table 1. Area Under the Curve (Az) Values for the Detection of HCC
Size Observer 1 Observer 2
Gdx Set DWI Set Combined Set Gdx Set DWI Set Combined Set
All lesions (n = 84) 0.908 (0.833-0.957) 0.820 (0.730-0.890) 0.860 (0.775-0.922) 0.851 (0.765-0.915) 0.863 (0.778-0.924) 0.878 (0.796-0.935)
≥ 2 cm (n = 60) 0.992 (0.932-0.996)* 0.918 (0.826-0.970)* 0.925 (0.836-0.974) 0.964 (0.889-0.993) 0.909 (0.815-0.965) 0.924 (0.834-0.974)
< 2 cm (n = 24) 0.675 (0.477-0.836) 0.646 (0.447-0.813) 0.683 (0.485-0.842) 0.642 (0.443-0.810) 0.729 (0.533-0.876) 0.712 (0.515-0.864) Note.-Numbers in brackets are the 95% confidence intervals.
*The difference between Az values in the Gdx set and in the DWI set was significant (p = 0.04) for observer 1 when considering lesions larger than or equal to 2 cm.
Combined set = unenhanced, gadolinium-enhanced dynamic and hepatobiliary phase images, and diffusion-weighted images, DWI set = unenhanced, diffusion-weighted images, Gdx set = unenhanced, gadolinium-enhanced dynamic and hepatobiliary phase images, HCC = hepatocellular carcinoma
server 1 and p = 0.0012 for observer 2). When lesions smaller than 2 cm were considered, the DWI set yielded a significantly lower sensitivity as compared to either the Gdx set or the com- bination of both sets (p = 0.0186, 0.0001 for observer 1 and, p = 0.0005, 0.008 for observer 2, respectively) (Fig. 2). The sensitivi- ty of observer 2 was not statistically significant when lesions larger than or equal to 2 cm were considered (p = 0.1731). The combination of both techniques did not increase the sensitivities of detecting HCC for either observer. Although the sensitivity of the combination set (92%) in observer 1 was higher than that of the Gdx set (85%), it did not reach statistical significances (p = 0.292). In observer 2, the sensitivity of the combination set (93%) was lower than that of the Gdx set (95%) (p = 0.412), which was not statistically significant.
The diagnostic performance, including the sensitivities, speci- ficities, with positive and negative predictive values for HCC de- tection for each reviewer and for each image set, is summarized ty to detect HCCs are shown in Table 1. The Az values for the
Gdx and DWI sets were not significantly different when consid- ering all lesions. The difference in Az values between the Gdx and DWI sets was statistically significant (p = 0.04) for observer 1 when considering lesions larger than or equal to 2 cm. The combination of the two techniques did not increase the Az val- ues for either observers.
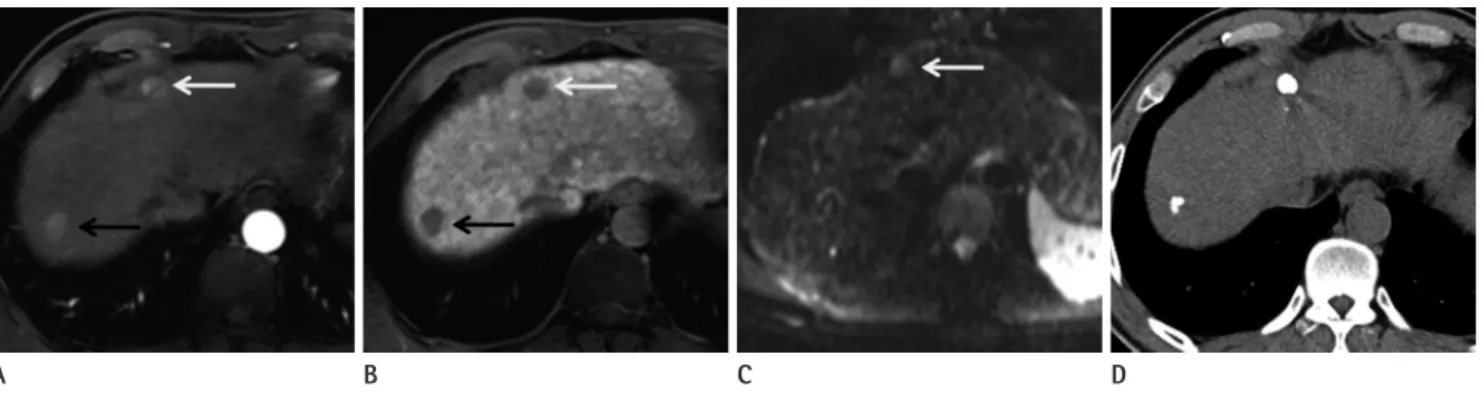
Of a total of 84 HCCs, observer 1 detected 71 lesions using Gdx MRI (85%) and 57 lesions were detected on DWI (68%), whereas observer 2 noted 75 lesions using Gdx MR imaging (89%) and 64 lesions using DWI (76%) (Fig. 1). Thirty-six le- sions were located in the subphrenic (n = 30) or subcardiac area (n = 6), with 48 lesions located elsewhere. The sensitivities of de- tection of HCCs in the two image sets for the two observers are shown in Table 2. Overall, the sensitivities in the Gdx set (mean of 73 lesions detected) were significantly higher than those in the DWI set (mean of 60.5 lesions detected) (p = 0.0004 for ob- Fig. 1. Two hepatocellular carcinomas in a 48-year-old man.
A. Gadoxetic acid-enhanced MRI image during the arterial phase shows two enhancing masses, one in the right hepatic lobe (black arrow) and one in segment 4 (white arrow).
B. A hepatobiliary phase image 20 minutes after contrast administration shows hypointense masses at the same locations (black and white ar- rows).
C. Diffusion-weighted image (DWI) demonstrates a hyperintense lesion (arrow) at S4. However, the lesion in the right hepatic lobe is not depicted on DWI.
D. Follow-up unenhanced CT one month after transarterial chemoembolization shows iodized oil retention in S4 and the right lobe.
A B C D
Table 2. Comparison of Sensitivities among the Three Imaging Sets in the Detection of HCC
Size Observer 1 Observer 2
Gdx Set DWI Set Combined Set Gdx Set DWI Set Combined Set
All lesions (n = 84) 71/84 (85%) 57/84 (68%)* 77/84 (92%) 75/84 (89%) 64/84 (76%)* 73/84 (87%)
≥ 2 cm (n = 60) 56/60 (93%) 48/60 (80%)* 59/60 (98%) 57/60 (95%) 54/60 (90%) 56/60 (93%)
< 2 cm (n = 24) 15/24 (63%) 9/24 (38%)* 18/24 (75%) 18/24 (75%) 10/24 (42%)* 17/24 (71%) Note.-Data are numbers of correct diagnoses; numbers in parentheses are percentages.
*When lesions smaller than 2 cm were considered, the DWI set yielded a significantly lower sensitivity compared with those of either the Gdx set alone or the combination set (p = 0.0186, 0.0001 for observer 1, and p = 0.0005, 0.008 for observer 2, respectively). The sensitivity of observer 2 was not statistically significant for lesions larger than or equal to 2 cm (p = 0.1731).
Combined set = unenhanced, gadolinium-enhanced dynamic and hepatobiliary phase images, and diffusion-weighted images, DWI set = unenhanced, diffusion-weighted images, Gdx set = unenhanced, gadolinium-enhanced dynamic and hepatobiliary phase images, HCC = hepatocellular carcinoma
set, four lesions in four patients were erroneously interpreted as positive findings, while in the DWI set, two lesions in two patients were erroneously interpreted as positive findings. The combined set showed five false-positive findings in five patients. On retro- spective review, the false-positive interpretations for the Gdx set and combined set were attributed to presumed dysplastic nod- ules (Fig. 3).
DISCUSSION
This study found that gadoxetic acid-enhanced dynamic and hepatobiliary phase MRI is more sensitive for detecting HCC than the DWI when using 3 T MRI. Additions of DWI to ga- doxetic acid-enhanced dynamic and hepatobiliary phase MRI did not increase the diagnostic performances for HCC detec- tions. It has been indicated that detection and precise localiza- tion of HCC are known to be difficult with DWI alone because of its poor anatomic capabilities (24-26). Moreover, DWI has lower resolutions than hepatobiliary phase MRI and may lead to in Table 3. For observer 2, specificity with DWI set was higher
than Gdx set, while for observer 1, specificity with DWI set was lower than Gdx set. There were no significant differences among the mean positive predictive values and negative predictive val- ues for the three image sets.
Eight lesions in 29 patients, which were confirmed via histo- pathological exam or imaging follow-up, but were not detected with a high confidence score of 4 or 5 by either observers on any image set, and were thus deemed false-negative lesions. In the Gdx lesion set, 14 lesions in 12 patients were not detected with high confidence by either of the observers. For the DWI set, 31 lesions in 27 patients were not detected with high confidence by either of the observers. All lesions detected in the DWI set were also seen in the Gdx set. Eight lesions (0.7-2.3 cm in size) were not noted in the DWI set, but were visualized in the Gdx set.
The rates of false-positive reports for all lesions were 6.1% (6 of 98) for observer 1 and 7.1% (7 of 98) for observer 2, with a mean false positive rate of 2.5% (5 of 196) for Gdx set, 1.5% (3 of 196) for DWI set, and 4.5% (9 of 196) for combined set. In the Gdx
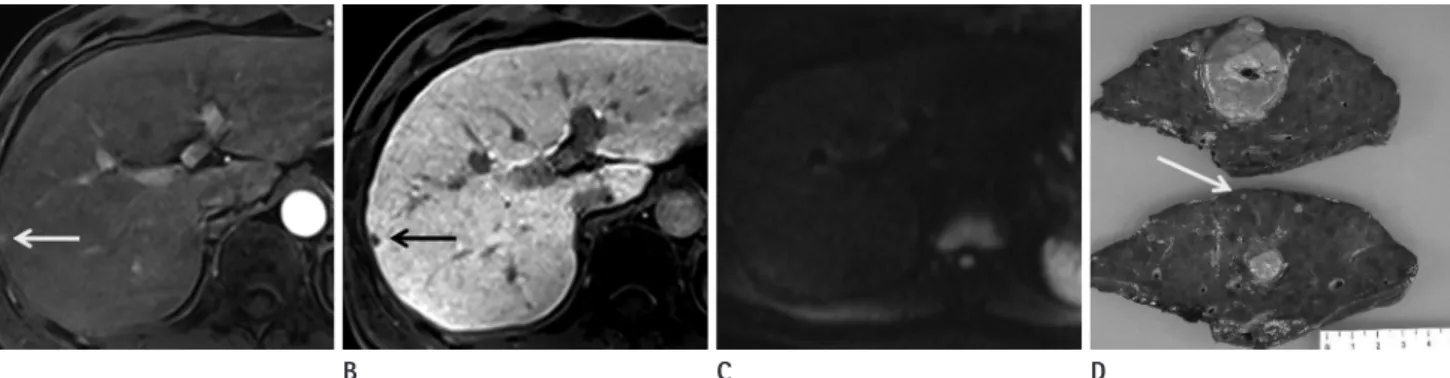
Fig. 2. Hepatocellular carcinoma in a 42-year-old man. The main mass, 4 cm sized expansile hypervascular tumor at S6, is not shown here.
A, B. Gadoxetic acid-enhanced MR image during arterial phase (A) and hepatobiliary phase (B) show a satellite nodule in the right hepatic lobe (arrows).
C. The lesions are not visible on DWI using b values of 50 s/mm2.
D. Photograph of the surgical specimen shows a main mass and a small hepatocellular carcinoma (arrow).
Note.-DWI = diffusion-weighted imaging
A B C D
Table 3. Diagnostic Performance of Observers of Gdx Set, DWI Set, and Combined Set in the Detection of HCC
Observer 1 Observer 2
Gdx Set DWI Set Combined Set Gdx Set DWI Set Combined Set
Sensitivity 71/84 (85%) 57/84 (68%) 77/84 (92%) 75/84 (89%) 64/84 (76%) 73/84 (87%)
Specificity 13/14 (93%) 12/14 (86%) 9/13 (69%) 10/14 (71%) 13/14 (93%) 10/14 (71%)
PPV 71/72 (99%) 57/59 (97%) 77/82 (94%) 75/79 (95%) 64/65 (98%) 73/77 (95%)
NPV 13/26 (50%) 27/39 (69%) 7/16 (44%) 9/19 (47%) 20/33 (61%) 11/21 (52%)
Note.-Data are number of correct diagnosis; numbers in parentheses are percentage.
Combined set = unenhanced, gadolinium-enhanced dynamic and hepatobiliary phase images, and diffusion-weighted images, DWI set = unenhanced, diffusion-weighted images, Gdx set = unenhanced, gadolinium-enhanced dynamic and hepatobiliary phase images, HCC = hepatocellular carcinoma, NPV = negative predictive value, PPV = positive predictive value
portant shortcomings of DWI are artifacts caused by cardiac motions and a susceptibility to artifacts caused by air (17, 26).
Therefore, the subcardiac or subphrenic signal loss may signifi- cantly decrease the sensitivity for the detection of HCC in the left lobe or the hepatic dome. Our study results suggest that the degradation of DWI at 3 T outweighs the benefit of using DWI.
Optimization of DWI at 3 T remains a work in progression, and future technical advancements could aid to overcome the low specificity and image quality of DWI.
Although DWI has been incorporated into the routine liver MRI protocol, it may not be helpful for diagnosis and character- ization of HCC. DWI has been reported to be an unreliable pre- dictor of local HCC recurrence after transarterial chemoemboli- zation as compared to gadolinium-enhanced MRI (34), and it did not appear to contribute to the detection of HCC with well- differentiated components (31, 35). The limited performance of DWI for the detection of HCC is probably due to the cirrhotic or fibrotic background in patients with HCC. The presence of increased connective tissues in the cirrhotic liver is poor in pro- tons and the decrease of blood flow results in restricted diffu- sions on DWI (18). Therefore, the lesion-to-liver contrast be- tween the tumors and background liver may not be evident on DWI. Parikh et al. (25) found a sensitivity of 80.5% for HCC de- tection by DWI. In our study, the sensitivity (76%) was similar to the previous study for HCC detection using DWI, while in- creased sensitivity (89%) was achieved with dynamic and hepa- tobiliary phase imaging.
A hepatobiliary contrast agent provides both a dynamic and poor depictions of small focal hepatic lesions (26). All lesions
detected on DWI were also seen on dynamic and hepatobiliary images. Therefore, we believe that DWI may not be helpful for the detection of HCC with 3 T MRI. Although sensitivity for HCC detection was increased in gadoxetic acid-enhanced dy- namic and hepatobiliary phase of MRI as compared to that of DWI, the Az values for HCC detection did not reach statistical significances. This may be attributed to false positive findings in the hepatobiliary phase images. Small hepatic nodules (1-2 cm) only being noted on hepatobiliary phase imaging may lead to a false positive diagnosis of HCC, resulting in a lower Az value.
The potential usefulness of DWI for detecting and character- izing focal hepatic lesions including HCCs and metastases has been reported (25-29). In addition, combined reading of DWI and T2-weighted images were found to be superior to the SPIO- enhanced MRI (25, 26, 30), and the addition of DWI to conven- tional diagnostic criteria increased the sensitivity for HCC diag- nosis (23). However, it is important to emphasize that most studies which evaluate the usefulness of DWI in the diagnosis of hepatic tumors use 1.5 T MRI scanners (23, 31, 32). Recently, 3 T MRI imaging is widely used in clinical practices because it al- lows high spatial and temporal resolution by increasing the sig- nal-to-noise ratios. Higher b values are used for 3 T MRI, result- ing in increased sensitivity to diffusions and less sensitivity to transverse relaxation time (T2) and perfusion-related motion (33). Therefore, 3 T scanners with DWI are widely used for rou- tine liver MRI. Unfortunately, the magnetic field inhomogene- ities that degrade DWI are increased with 3 T (19-21). Two im- Fig. 3. Hepatocellular carcinoma in a 45-year-old man.
A. Gadoxetic acid-enhanced MR images during the arterial phase show two enhancing nodules in the left hepatic lobe (black and white arrows).
B. The lesions show hypointensity on hepatobiliary phase images at the same location (black and white arrows).
C. Only the lesion at S3 is visible on DWI using b values of 800 s/mm2 (arrow).
D. Follow-up CT shows compact iodized oil retention at S3. The lesion at S4 did not show any enhancement or washout during the follow-up pe- riod of one and a half years.
Note.-DWI = diffusion-weighted imaging
A B C D
small HCCs in cirrhosis (39). In our study, when lesions smaller than 2 cm were considered, the DWI set had a significantly low- er sensitivity as compared with either the Gdx set alone or the combination of both sets. However, small sized lesions (1-2 cm) only seen when using the hepatobiliary phase are also problem- atic. Because there are definite overlaps of size between early HCC and dysplastic nodules, indeterminate lesions may lead to false positive diagnoses. Further studies are needed to better de- fine the criteria of early HCC.
Our study had several limitations. First, since we did not ob- tain a biopsy of every hepatic nodule, thus, not all lesions were histopathologically confirmed. However, if we had included only those lesions confirmed by histopathology, there would have been a chance of verification bias. Second, small (< 1.5 cm) nod- ules only seen on the hepatobiliary phase images were regarded as benign when there was no proven evidence of HCC during a fol- low-up period of one year. Given that an early HCC may require a substantial amount of time to increase in size, it may have been too early to determine whether those lesions were truly benign.
The fates of indeterminate lesions should be documented in a long-term follow-up study. Third, optimization of DWI sequence parameters remains a work in progress for 3 T MRI. Further tech- nical advancements could help overcome the problems of image quality in DWI while maintaining the specificity of 3 T MRI.
In conclusion, the gadoxetic acid-enhanced dynamic and hepatobiliary imaging was superior to DWI for detecting HCC with 3 T MRI. Additions of DWI to the dynamic and hepatobil- iary imaging did not contribute to the detections of HCC.
REFERENCES
1. El-Serag HB. Hepatocellular carcinoma: an epidemiologic view. J Clin Gastroenterol 2002;35(5 Suppl 2):S72-S78 2. El-Serag HB. Hepatocellular carcinoma: recent trends in
the United States. Gastroenterology 2004;127(5 Suppl 1):S27-S34
3. Baron RL, Brancatelli G. Computed tomographic imaging of hepatocellular carcinoma. Gastroenterology 2004;127(5 Suppl 1):S133-S143
4. Kim SH, Kim SH, Lee J, Kim MJ, Jeon YH, Park Y, et al. Ga- doxetic acid-enhanced MRI versus triple-phase MDCT for the preoperative detection of hepatocellular carcinoma.
hepatobiliary phase. Previous studies have shown that a combi- nation of dynamic imaging and a hepatobiliary phase improves HCC diagnostic performance (4, 14). Three-dimensional GRE MRI using a hepatobiliary contrast agent provides thin sections with no gaps, high signal-to-noise ratio, and high sensitivity for detecting sub-centimeter-sized hepatocellular lesions (5, 36-38).
Three-dimensional GRE MRI also avoids the respiratory or sus- ceptibility artifacts that are a problem in DWI. Therefore, ga- doxetic acid-enhanced MRI appears to be better than DWI for the diagnosis of HCC when considering both diagnostic perfor- mances and image qualities of 3 T MRI.
Our results suggest that the addition of DWI to dynamic and hepatobiliary phase imaging may not be helpful for the detec- tion of HCC. Nishie et al. (31) reported that an SPIO-enhanced MRI + DWI set outperformed the SPIO-enhanced set in HCC depiction when using a 1.5 T scanner. The average area under the ROC curve (Az) of the SPIO-enhanced MRI + DWI set (Az
= 0.870) was significantly higher than that of SPIO-enhanced set (Az = 0.820) for detecting HCC. In our study, the combined in- terpretation of both DWI and gadoxetic acid-enhanced MRI did not increase the diagnostic performances of HCC detection.
It has been reported that DWI may not contribute to the detec- tions of HCC with well-differentiated components (27, 31).
However, the gadoxetic acid-enhanced hepatobiliary phase of MR imaging has been reported to be useful for preoperative di- agnosis of early HCC in a preliminary report (14). Therefore, gadoxetic acid-enhanced MRI appears to be more beneficial than DWI for depicting HCC. Cirrhotic patients with suspected HCC and impaired hepatobiliary enhancement due to de- creased hepatic functions may benefit from DWI because it can detect HCCs in the absence of contrast materials (27). DWI can also be used for screening patients for hepatocellular lesions, by reducing the number of overlooked lesions.
HCC size is an important prognostic factor for patient surviv- als. Gadoxetic acid-enhanced dynamic and hepatobiliary phase of MRI have been reported to be helpful for the detection of small HCCs (4). However, DWI may simulate suspicious lesions and result in false-positive findings due to susceptibility arti- facts. Sub-centimeter-sized hepatocellular lesions in the sub- phrenic space or left hepatic lobe may be missed due to artifacts.
Furthermore, DWI with a high b value may not be superior to standard T2-weighted imaging in terms of lesion conspicuity of
MR imaging in the diagnosis of hepatocellular carcinoma.
Radiology 2010;255:459-466
15. Nasu K, Kuroki Y, Nawano S, Kuroki S, Tsukamoto T, Yama- moto S, et al. Hepatic metastases: diffusion-weighted sensitivity-encoding versus SPIO-enhanced MR imaging.
Radiology 2006;239:122-130
16. Hollingsworth KG, Lomas DJ. Influence of perfusion on hepatic MR diffusion measurement. NMR Biomed 2006;
19:231-235
17. Koh DM, Collins DJ. Diffusion-weighted MRI in the body:
applications and challenges in oncology. AJR Am J Roent- genol 2007;188:1622-1635
18. Taouli B, Koh DM. Diffusion-weighted MR imaging of the liver. Radiology 2010;254:47-66
19. Choi JY, Kim MJ, Chung YE, Kim JY, Jones AC, de Becker J, et al. Abdominal applications of 3.0-T MR imaging: com- parative review versus a 1.5-T system. Radiographics 2008;
28:e30
20. Merkle EM, Dale BM, Paulson EK. Abdominal MR imaging at 3T. Magn Reson Imaging Clin N Am 2006;14:17-26 21. Soher BJ, Dale BM, Merkle EM. A review of MR physics: 3T
versus 1.5T. Magn Reson Imaging Clin N Am 2007;15:277- 290, v
22. Choi SH, Lee JM, Yu NC, Suh KS, Jang JJ, Kim SH, et al. He- patocellular carcinoma in liver transplantation candidates:
detection with gadobenate dimeglumine-enhanced MRI.
AJR Am J Roentgenol 2008;191:529-536
23. Piana G, Trinquart L, Meskine N, Barrau V, Beers BV, Vilgrain V. New MR imaging criteria with a diffusion-weighted se- quence for the diagnosis of hepatocellular carcinoma in chronic liver diseases. J Hepatol 2011;55:126-132
24. Namimoto T, Yamashita Y, Sumi S, Tang Y, Takahashi M. Fo- cal liver masses: characterization with diffusion-weighted echo-planar MR imaging. Radiology 1997;204:739-744 25. Parikh T, Drew SJ, Lee VS, Wong S, Hecht EM, Babb JS, et al.
Focal liver lesion detection and characterization with diffu- sion-weighted MR imaging: comparison with standard breath-hold T2-weighted imaging. Radiology 2008;246:
812-822
26. Zech CJ, Herrmann KA, Dietrich O, Horger W, Reiser MF, Schoenberg SO. Black-blood diffusion-weighted EPI ac- quisition of the liver with parallel imaging: comparison AJR Am J Roentgenol 2009;192:1675-1681
5. Kwak HS, Lee JM, Kim YK, Lee YH, Kim CS. Detection of hepatocellular carcinoma: comparison of ferumoxides- enhanced and gadolinium-enhanced dynamic three-di- mensional volume interpolated breath-hold MR imaging.
Eur Radiol 2005;15:140-147
6. Kanematsu M, Kondo H, Goshima S, Tsuge Y, Watanabe H.
Magnetic resonance imaging of hepatocellular carcinoma.
Oncology 2008;75 Suppl 1:65-71
7. Kim MJ, Choi JY, Chung YE, Choi SY. Magnetic resonance imaging of hepatocellular carcinoma using contrast me- dia. Oncology 2008;75 Suppl 1:72-82
8. Willatt JM, Hussain HK, Adusumilli S, Marrero JA. MR Im- aging of hepatocellular carcinoma in the cirrhotic liver:
challenges and controversies. Radiology 2008;247:311- 330
9. Bartolozzi C, Crocetti L, Lencioni R, Cioni D, Della Pina C, Campani D. Biliary and reticuloendothelial impairment in hepatocarcinogenesis: the diagnostic role of tissue-specif- ic MR contrast media. Eur Radiol 2007;17:2519-2530 10. Frericks BB, Loddenkemper C, Huppertz A, Valdeig S,
Stroux A, Seja M, et al. Qualitative and quantitative evalu- ation of hepatocellular carcinoma and cirrhotic liver en- hancement using Gd-EOB-DTPA. AJR Am J Roentgenol 2009;193:1053-1060
11. Hammerstingl R, Huppertz A, Breuer J, Balzer T, Blakebor- ough A, Carter R, et al. Diagnostic efficacy of gadoxetic acid (Primovist)-enhanced MRI and spiral CT for a thera- peutic strategy: comparison with intraoperative and his- topathologic findings in focal liver lesions. Eur Radiol 2008;18:457-467
12. Huppertz A, Haraida S, Kraus A, Zech CJ, Scheidler J, Breuer J, et al. Enhancement of focal liver lesions at gadoxetic acid-enhanced MR imaging: correlation with histopatho- logic findings and spiral CT--initial observations. Radiolo- gy 2005;234:468-478
13. Reimer P, Rummeny EJ, Shamsi K, Balzer T, Daldrup HE, Tombach B, et al. Phase II clinical evaluation of Gd-EOB- DTPA: dose, safety aspects, and pulse sequence. Radiology 1996;199:177-183
14. Ahn SS, Kim MJ, Lim JS, Hong HS, Chung YE, Choi JY. Add- ed value of gadoxetic acid-enhanced hepatobiliary phase
33. Le Bihan D, Breton E, Lallemand D, Aubin ML, Vignaud J, Laval-Jeantet M. Separation of diffusion and perfusion in intravoxel incoherent motion MR imaging. Radiology 1988;
168:497-505
34. Goshima S, Kanematsu M, Kondo H, Yokoyama R, Tsuge Y, Shiratori Y, et al. Evaluating local hepatocellular carcino- ma recurrence post-transcatheter arterial chemoemboli- zation: is diffusion-weighted MRI reliable as an indicator?
J Magn Reson Imaging 2008;27:834-839
35. Kim YK, Kim CS, Han YM, Lee YH. Detection of liver malig- nancy with gadoxetic acid-enhanced MRI: is addition of diffusion-weighted MRI beneficial? Clin Radiol 2011;66:
489-496
36. Choi JY, Choi JS, Kim MJ, Lim JS, Park MS, Kim JH, et al.
Detection of hepatic hypovascular metastases: 3D gradi- ent echo MRI using a hepatobiliary contrast agent. J Magn Reson Imaging 2010;31:571-578
37. Kim YK, Ko SW, Hwang SB, Kim CS, Yu HC. Detection and characterization of liver metastases: 16-slice multidetec- tor computed tomography versus superparamagnetic iron oxide-enhanced magnetic resonance imaging. Eur Radiol 2006;16:1337-1345
38. Kim YK, Lee JM, Kim CS. Gadobenate dimeglumine-en- hanced liver MR imaging: value of dynamic and delayed imaging for the characterization and detection of focal liver lesions. Eur Radiol 2004;14:5-13
39. Wang H, Wang XY, Jiang XX, Ye ZX. Comparison of diffu- sion-weighted with T2-weighted Imaging for detection of small hepatocellular carcinoma in cirrhosis: preliminary quantitative study at 3-T. Acad Radiol 2010;17:239-243 with a standard T2-weighted sequence for detection of
focal liver lesions. Invest Radiol 2008;43:261-266
27. Nasu K, Kuroki Y, Tsukamoto T, Nakajima H, Mori K, Mina- mi M. Diffusion-weighted imaging of surgically resected hepatocellular carcinoma: imaging characteristics and re- lationship among signal intensity, apparent diffusion co- efficient, and histopathologic grade. AJR Am J Roentgenol 2009;193:438-444
28. Shinya S, Sasaki T, Nakagawa Y, Guiquing Z, Yamamoto F, Yamashita Y. The efficacy of diffusion-weighted imaging for the detection of colorectal cancer. Hepatogastroenter- ology 2009;56:128-132
29. Xu PJ, Yan FH, Wang JH, Lin J, Ji Y. Added value of breath- hold diffusion-weighted MRI in detection of small hepato- cellular carcinoma lesions compared with dynamic contrast- enhanced MRI alone using receiver operating characteristic curve analysis. J Magn Reson Imaging 2009;29:341-349 30. Holzapfel K, Bruegel M, Eiber M, Ganter C, Schuster T, Hein-
rich P, et al. Characterization of small (≤10 mm) focal liver lesions: value of respiratory-triggered echo-planar diffu- sion-weighted MR imaging. Eur J Radiol 2010;76:89-95 31. Nishie A, Tajima T, Ishigami K, Ushijima Y, Okamoto D, Hi-
rakawa M, et al. Detection of hepatocellular carcinoma (HCC) using super paramagnetic iron oxide (SPIO)-enhanced MRI: Added value of diffusion-weighted imaging (DWI). J Magn Reson Imaging 2010;31:373-382
32. Hardie AD, Naik M, Hecht EM, Chandarana H, Mannelli L, Babb JS, et al. Diagnosis of liver metastases: value of dif- fusion-weighted MRI compared with gadolinium-en- hanced MRI. Eur Radiol 2010;20:1431-1441
간세포암의 발견: 3테슬라 자기공명영상에서 확산강조영상, Gadoxetic Acid 조영증강영상, 두 영상 조합의 비교1
박승현
1· 정용은
1· 홍혜숙
2· 김기황
1· 김명진
1· 최진영
1목적: 간세포암의 발견에 있어 3 T 자기공명영상에서의 확산강조영상, gadoxetic acid 조영증강영상, 그리고 두 영상의 조합해석의 진단능을 비교하고자 한다.
대상과 방법: 3 T 자기공명영상에서 간세포암으로 의심된 66명의 환자(57명의 남자, 9명의 여자, 평균연령 69.2세)에서 84예의 간세포암을 대상으로 하였다. 확산강조영상(b값 0, 50, 800 sec/mm2)과 역동적 gadoxetic acid 조영증강영상을 얻었고 2명의 영상의학과 의사가 후향적으로 두 영상을 단독으로 혹은 조합하여 판독하였다. 통계분석은 receiver oper- ating characteristic 곡선과 민감도의 비교를 통해 이루어졌다.
결과: Gadoxetic acid 조영증강영상군의 민감도(73/84, 87%)는 확산강조영상군의 민감도(60.5/84, 72%)보다 통계적 으로 유의하게 높았다. 두 영상을 조합하여 판독해도 민감도가 올라가지는 않았다. 확산강조영상군과 gadoxetic acid 조 영증강영상군의 Az값은 통계적으로 유의한 차이를 보이지 않았다(관찰자 1, p = 0.107, 관찰자 2, p = 0.738). 병변이 2 cm 미만인 경우 확산강조영상군은 gadoxetic acid 조영증강영상군 혹은 두 영상의 조합군보다 더 낮은 민감도를 보였다.
결론: 간세포암의 발견에 있어 3 T 자기공명영상에서의 확산강조영상은 gadoxetic acid 조영증강영상보다 진단능이 낮 다. 두 영상을 조합하여 판독해도 간세포암을 발견하는 데 있어서 진단능이 향상되지는 않는다.
1연세대학교 의과대학 세브란스병원 영상의학과, 2한림대학교 의과대학 영상의학과