Received:March 1, 2016, Revised:April 8, 2016, Accepted:June 30, 2016
Corresponding to:Young Ho Lee, Division of Rheumatology, Department of Internal Medicine, Korea University Anam Hospital, Korea University College of Medicine, 73 Inchon-ro, Seongbuk-gu, Seoul 02841, Korea. E-mail:[email protected]
pISSN: 2093-940X, eISSN: 2233-4718
Copyright ⓒ 2016 by The Korean College of Rheumatology. All rights reserved.
This is a Free Access article, which permits unrestricted non-commerical use, distribution, and reproduction in any medium, provided the original work is properly cited.
Comparison of Disease Activity Score 28 Using C-reactive Protein and Disease Activity Score 28 Using Erythrocyte Sedimentation Rate in Assessing Activity and Treatment Response in Rheumatoid Arthritis: A Meta-analysis
Gwan Gyu Song, Young Ho Lee
Division of Rheumatology, Department of Internal Medicine, Korea University College of Medicine, Seoul, Korea
Objective. We compared the Disease Activity Score 28 (DAS28) using C-reactive protein (DAS28-CRP) with DAS28 using er- ythrocyte sedimentation rate (DAS28-ESR) in assessing rheumatoid arthritis (RA) activity and determining European League Against Rheumatism (EULAR) response criteria. Methods. We searched the PubMed, EMBASE, and Cochrane databases and performed a meta-analysis to examine comparisons between DAS28-CRP and DAS28-ESR by RA activity and EULAR response criteria. Results. A total of ten studies were included in this meta-analysis. Significantly more patients were classified as having remission or low disease activity when using DAS28-CRP than when using DAS28-ESR (odds ratio [OR]=1.869, 95% con- fidence interval [CI]=1.180 to 2.959, p=0.008; OR=1.411, 95% CI=1.256 to 1.586, p=7.0×10⁻⁸), whereas fewer patients were classified as having high disease activity when using DAS28-CRP than when using DAS28-ESR (OR=0.534, 95%
CI=0.388 to 0.734, p=1.1×10⁻⁴). More patients were classified as having good response with criteria were based on DAS28-CRP than with DAS28-ESR (OR=1.390, 95% CI=1.183 to 1.632, p=6.10×10⁻⁵). Conclusion. Our meta-analysis demonstrates that DAS28-CRP underestimates disease activity and overestimates response by the EULAR response criteria compared to DAS28-ESR. (J Rheum Dis 2016;23:241-249)
Key Words. DAS28-CRP, DAS28-ESR, Rheumatoid arthritis
INTRODUCTION
Rheumatoid arthritis (RA) is a chronic inflammatory disease that predominantly affects the synovial joints, causing significant morbidity and shortened life expect- ancy [1]. The Disease Activity Score based on 28 joints (DAS28) has been widely used and validated in clinical practice and trials to monitor RA disease activity and de- termine treatment response using the European League Against Rheumatism (EULAR) response criteria [2].
DAS28 is calculated from 4 components: number of ten- der joints, number of swollen joints, visual analogue scale score of the patient’s global health, and erythrocyte sed- imentation rate (ESR) [3]. Since ESR is used as an in-
flammation marker, this version is referred to as DAS28-ESR. ESR is affected by age, sex, anemia, fibri- nogen levels, hypergammaglobulinemia, plasma vis- cosity, and reflects disease activity of the past few weeks [4], while C-reactive protein (CRP) is less confounded by these factors, and reflects more short-term changes in disease activity [5]. DAS28 using CRP (DAS28-CRP) was developed by the modification of DAS28‐ESR, which had previously been developed by modification of the DAS [3]. DAS28-CRP and DAS28-ESR have been considered comparable and interchangeable when assessing RA pa- tients, but the DAS28-CRP is not as well established as the DAS28-ESR, because its validity is inferred by com- parison with DAS28-ESR [6,7]. Studies have not shown
similar results on comparison between DAS28-CRP and DAS28-ESR in assessing RA activity and treatment response.
Comparative studies between DAS28-CRP and DAS- 28-ESR have shown inconsistent results when classifying RA activity and determining EULAR response criteria [6-16]. This disparity may be due to small sample sizes, low statistical power, and/or clinical heterogeneity.
Therefore, in order to overcome the limitations of in- dividual studies, resolve inconsistencies, and increase precision, we performed a meta-analysis. The present study aimed to compare DAS28-CRP with DAS28-ESR in assessing RA activity and determining EULAR response criteria, mean levels of DAS28-CRP and DAS28-ESR in RA patients, and correlation coefficients between DAS28-CRP and DAS28-ESR using the meta-analysis approach.
MATERIALS AND METHODS
Identification of eligible studies and data extraction
We performed a literature search for studies that exam- ined the comparison between DAS28-CRP and DAS28-ESR in RA patients. The PubMed, EMBASE, and Cochrane da- tabases were searched to identify all available articles (up to July 2015). The following key words and subject terms were used in the search: “DAS28,” “correlation,” “activity,”“response criteria”, “rheumatoid arthritis,” and “RA.” All references cited were also reviewed to identify additional studies not indexed by the above-mentioned electronic databases. Studies were considered eligible if: (1) they provided data on levels of DAS28-CRP and DAS28-ESR in RA patients, (2) they provided data on the correlation coefficient of DAS28-CRP and DAS28-ESR, or (3) they provided data on the comparison between DAS28-CRP and DAS28-ESR in assessing RA activity [3] or determin- ing EULAR response criteria [2]. Response according to the EULAR response criteria was categorized as good (improvement >1.2 and current DAS28 ≤3.2), moder- ate (improvement >0.6 to ≤1.2 and current DAS28
≤5.1; or improvement >1.2 and current DAS28 >3.2), or no response (improvement ≤0.6 or improvement
>0.6 to ≤1.2 and current DAS28 >5.1) [2]. No lan- guage restriction was applied. We excluded studies if: (1) they contained overlapping or insufficient data, or (2) they were reviews. The following information was ex- tracted from each study: first author, year of publication, country, ethnicity, number of participants, age, disease
duration, DAS28-CRP and DAS28-ESR levels, data on the comparison between DAS28-CRP and DAS28-ESR, and correlation coefficients between DAS28-CRP and DAS28-ESR. We scored the quality of each included study based on the Newcastle-Ottawa Scale [17]. The highest score was 9, and a score in the 7 to 9 range was considered to indicate high methodological quality.
Evaluation of statistical associations
We performed meta-analyses to examine comparisons between mean levels of DAS28-CRP and DAS28-ESR in RA patients, correlation coefficients between DAS28-CRP and DAS28-ESR, and comparisons between DAS28-CRP and DAS28-ESR in assessing disease activity and de- termining EULAR response criteria. For continuous data, results are presented as standardized mean differences (SMDs) and 95% confidence intervals (CIs). Odds ratios (ORs) and 95% CIs were calculated for dichotomous data. Cochran’s Q-statistic was used to assess within- and between-study variations and heterogeneities [18]. This heterogeneity test was used to assess the probability of the null hypothesis that all studies evaluated showed the same effect. When a significant Q-statistic (p<0.10) in- dicated heterogeneity across studies, the random effects model was used for meta-analysis, but when hetero- geneity across studies was not indicated, the fixed effects model was used. This model assumes that genetic factors have similar effects on disease susceptibility across all studies and that observed variations between studies are caused by chance alone [18]. In contrast, the random ef- fects model assumes that different studies show sub- stantial diversity, and assesses both within-study sam- pling errors and between-study variances [19]. The ran- dom effects model is used in the presence of significant between-study heterogeneity. We quantified the effects of heterogeneity by using a recently developed measure, namely, I2=100%×(Q−df)/Q [20]. I2 ranges between 0%∼100% and represents the proportion of inter-study variability attributable to heterogeneity rather than chance. I2 values of 25%, 50%, and 75% were defined as low, moderate, and high estimates, respectively. Statistical manipulations were performed using the Comprehensive Meta-Analysis computer program (Biosta, Englewood, NJ, USA).
Heterogeneity, sensitivity test, and publication bias
A between-study heterogeneity observed in a meta-analy- sis indicates variability in results across studies. A sensi-Figure 1. Flow diagram of study selection process.
tivity test was performed to assess the influence of each individual study on the pooled OR by omitting each study individually. While funnel plots are often used to detect publication bias, they require diverse study types of vary- ing sample sizes, and the interpretation of the plots in- volves subjective judgment. Considering this, we eval- uated publication bias using Egger’s linear regression test [21], which measures funnel plot asymmetry using a nat- ural logarithm scale of ORs.
RESULTS
Studies included in the meta-analysis
We identified 468 studies using electronic and manual searching methods. Two hundred and eighteen studies were excluded due to repeated publication, and 236 were excluded due to irrelevance, and thus 14 of these were se- lected for full-text review based on the title and abstract.
Three of these were excluded, because they had no data, or were a review. Thus, a total of 11 articles including 15,353 RA patients met the inclusion criteria [6-16]
(Table 1, Figure 1). Seven of these studies provided data on comparisons between DAS28-CRP and DAS28-ESR based on RA activity, and four of these studies provided data on comparisons between DAS28-CRP and DAS28-ESR in determining EULAR response criteria. Five examined the mean levels of both DAS28-CRP and DAS28-ESR, and 7 studies provided the correlation coefficient of
Table 1. Characteristics of individual studies included in the meta-analysis First authorCountryEthnicityNumber of patientAge, yr (SD)Female, %Disease duration, yr (SD)Correlation coefficientDAS28-CRP (SD)DAS28-ESR (SD)DataStudy qualityActivityResponse Nielung, 2015 [8]DenmarkCaucasian7559.7 (NA)736---+-7 Sengul, 2015 [16]TurkeyTurkish11255.0 (12.4)89.390.93----8 Son, 2015 [9]KoreaAsian54053.2 (12.8)82.832.9 (41.2)*0.8673.44 (1.15)3.65 (1.37)++9 Siemons, 2014 [10]NetherlandsCaucasian68257.69 (13.85)62.80∼51† 0.945--+-7 Tamhane, 2013 [6]USAAfrican23352.6 (12.4)84.66.6 (9.3)-3.90 (1.50)4.80 (1.50)+-8 Hensor, 2010 [11]UKCaucasian52057.7 (14.1)64.26.0*-5.80 (1.31)6.15 (1.38)++8 Crowson, 2009 [12]USACaucasian2,41750.7 (12.3)81.5NA0.965.71 (1.84)6.18 (1.98)--7 Wells, 2009 [13]CanadaCaucasian75250.8 (12.7)77.28.5 (7.1)----+8 Castrejón, 2008 [7]SpainCaucasian22051 (16)76.4 5.1 (2.9)0.91--+-7 Inoue, 2007 [14]JapanAsian6,72960 (NA)82.190.946----8 Matsui, 2007 [15]JapanAsian3,07361.1 (11.4)84.113.5 (10.6)0.9453.59 (1.25)4.31 (1.32)++7 SD: standard deviation, DAS: disease activity score, CRP: C-reactive protein, ESR: erythrocyte sedimentation rate, NA: not available, +: presence, -: absence. *months, † range.
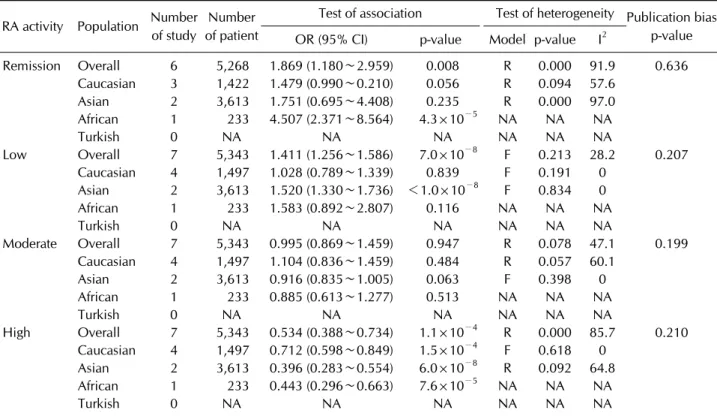
Table 2. Meta-analysis of comparison between DAS28-CRP and DAS28-ESR according to RA activity RA activity Population Number
of study
Number of patient
Test of association Test of heterogeneity Publication bias p-value OR (95% CI) p-value Model p-value I2
Remission Overall 6 5,268 1.869 (1.180∼2.959) 0.008 R 0.000 91.9 0.636 Caucasian 3 1,422 1.479 (0.990∼0.210) 0.056 R 0.094 57.6
Asian 2 3,613 1.751 (0.695∼4.408) 0.235 R 0.000 97.0
African 1 233 4.507 (2.371∼8.564) 4.3×10⁻⁵ NA NA NA
Turkish 0 NA NA NA NA NA NA
Low Overall 7 5,343 1.411 (1.256∼1.586) 7.0×10⁻⁸ F 0.213 28.2 0.207
Caucasian 4 1,497 1.028 (0.789∼1.339) 0.839 F 0.191 0
Asian 2 3,613 1.520 (1.330∼1.736) <1.0×10⁻⁸ F 0.834 0
African 1 233 1.583 (0.892∼2.807) 0.116 NA NA NA
Turkish 0 NA NA NA NA NA NA
Moderate Overall 7 5,343 0.995 (0.869∼1.459) 0.947 R 0.078 47.1 0.199 Caucasian 4 1,497 1.104 (0.836∼1.459) 0.484 R 0.057 60.1
Asian 2 3,613 0.916 (0.835∼1.005) 0.063 F 0.398 0
African 1 233 0.885 (0.613∼1.277) 0.513 NA NA NA
Turkish 0 NA NA NA NA NA NA
High Overall 7 5,343 0.534 (0.388∼0.734) 1.1×10⁻⁴ R 0.000 85.7 0.210 Caucasian 4 1,497 0.712 (0.598∼0.849) 1.5×10⁻⁴ F 0.618 0
Asian 2 3,613 0.396 (0.283∼0.554) 6.0×10⁻⁸ R 0.092 64.8 African 1 233 0.443 (0.296∼0.663) 7.6×10⁻⁵ NA NA NA
Turkish 0 NA NA NA NA NA NA
DAS28: disease activity score 28, CRP: C-reactive protein, ESR: erythrocyte sedimentation rate, RA: rheumatoid arthritis, OR: odds ratio, CI: confidence interval, F: fixed effects model, R: random effects model, NA: not available.
DAS28-CRP and DAS28-ESR in RA patients. The quality assessment score of each study ranged from 7 to 9, in- dicating high methodological quality. Table 1 shows the characteristic features of the studies’ participants as well as the studies’ reported quality assessments.
Meta-analysis of comparison between DAS28-CRP and DAS28-ESR in assessing rheumatoid arthritis activity and determining EULAR response criteria
The number of patients in each disease activity group evaluated by DAS28-CRP and DAS28-ESR were compared.
A higher number of patients were classified as having re- mission or low disease activity when using DAS28-CRP than when using DAS28-ESR (OR=1.869, 95% CI=1.180∼
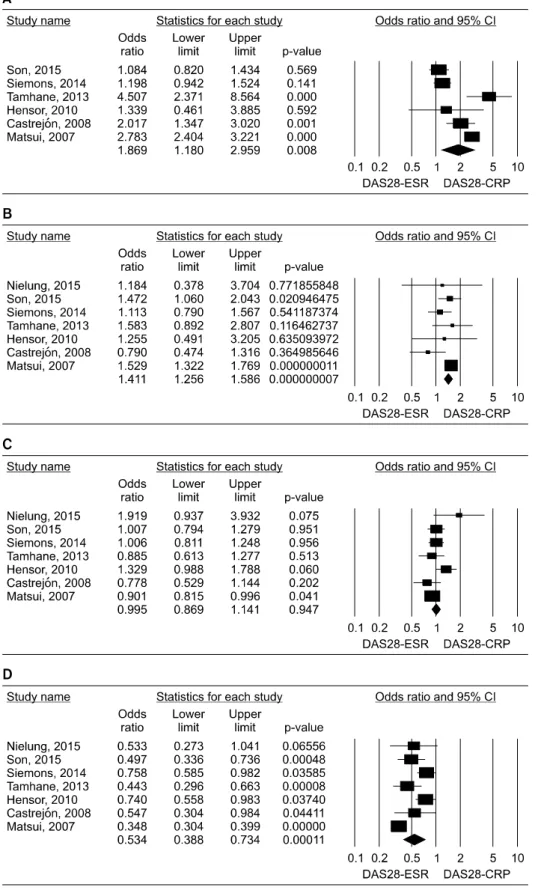
2.959, p=0.008; OR=1.411, 95% CI=1.256∼1.586, p=7.0×10⁻⁸) (Table 2, Figure 2). However, there was no difference between DAS28-CRP and DAS28-ESR regard- ing the number of patients classified as having moderate disease activity. In contrast, a lower number of patients were classified as having high disease activity when using DAS28-CRP than when using DAS28-ESR (OR=0.534, 95% CI=0.388∼0.734, p=1.1×10⁻⁴) (Table 2, Figure 2).
On stratification by ethnicity, a lower number of patients were classified as having high disease activity when using DAS28-CRP than when using DAS28-ESR in Caucasian patients (OR=0.712, 95% CI=0.598∼0.849, p=1.5×10⁻⁴) and in Asian patients (OR=0.396, 95% CI=0.283∼
0.554, p=6.0×10⁻⁸) (Table 2).
The numbers of patients in each response group as categorized by EULAR response criteria using DAS28-CRP and EULAR response criteria using DAS28-ESR were compared. A higher number of patients were classified as showing a good response when EULAR response criteria were determined using DAS28-CRP than when the criteria were determined using DAS28-ESR (OR=1.390, 95%
CI=1.183∼1.632, p=6.10×10⁻⁵) (Table 3, Figure 3). On stratification by ethnicity, this association was significant in Caucasian patients (OR=1.420, 95% CI=1.152∼1.752, p=0.001) and in Asian patients (OR=1.347, 95% CI=1.048
∼1.732, p=0.020) (Table 3). However, the number of patients showing a moderate response or no response did not differ according to whether the criteria were based on DAS28-CRP or DAS28-ESR (Table 3).
Figure 2. Meta-analysis of com- parison between DAS28-CRP and DAS28-ESR in assessing rheumatoid arthritis activity.
DAS28: disease activity score 28, CRP: C-reactive protein, ESR: erythrocyte sedimentation rate, CI: confidence interval.
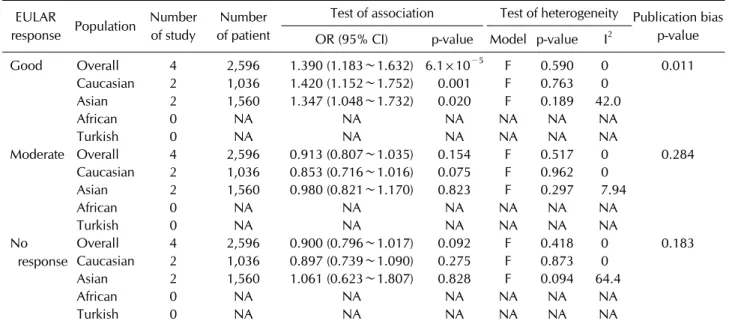
Table 3. Meta-analysis of comparison between DAS28-CRP and DAS28-ESR according to EULAR response criteria EULAR
response Population Number of study
Number of patient
Test of association Test of heterogeneity Publication bias p-value OR (95% CI) p-value Model p-value I2
Good Overall 4 2,596 1.390 (1.183∼1.632) 6.1×10⁻⁵ F 0.590 0 0.011
Caucasian 2 1,036 1.420 (1.152∼1.752) 0.001 F 0.763 0
Asian 2 1,560 1.347 (1.048∼1.732) 0.020 F 0.189 42.0
African 0 NA NA NA NA NA NA
Turkish 0 NA NA NA NA NA NA
Moderate Overall 4 2,596 0.913 (0.807∼1.035) 0.154 F 0.517 0 0.284
Caucasian 2 1,036 0.853 (0.716∼1.016) 0.075 F 0.962 0
Asian 2 1,560 0.980 (0.821∼1.170) 0.823 F 0.297 7.94
African 0 NA NA NA NA NA NA
Turkish 0 NA NA NA NA NA NA
No response
Overall 4 2,596 0.900 (0.796∼1.017) 0.092 F 0.418 0 0.183
Caucasian 2 1,036 0.897 (0.739∼1.090) 0.275 F 0.873 0
Asian 2 1,560 1.061 (0.623∼1.807) 0.828 F 0.094 64.4
African 0 NA NA NA NA NA NA
Turkish 0 NA NA NA NA NA NA
DAS28: disease activity score 28, CRP: C-reactive protein, ESR: erythrocyte sedimentation rate, EULAR: European League Against Rheumatism, OR: odds ratio, CI: confidence interval, F: fixed effects model, NA: not available.
Figure 3. Meta-analysis of com- parison between DAS28-CRP and DAS28-ESR in determin- ing EULAR response criteria.
DAS28: disease activity score 28, CRP: C-reactive protein, ESR: erythrocyte sedimentation rate, EULAR: European League Against Rheumatism, CI: con- fidence interval.
Meta-analysis of mean differences, and correlation coefficient between DAS28-CRP and DAS28-ESR in rheumatoid arthritis
Meta-analysis showed that values of DAS28-CRP were significantly lower than those of DAS28-ESR in RA pa- tients (SMD=−0.363, 95% CI=−0.545∼[−0.181], p=9.4×10⁻⁵). Meta-analysis of correlation coefficients showed a significant positive correlation between DAS- 28-CRP and DAS28-ESR (correlation coefficient=0.935, 95% CI=0.919∼0.948, p<1.0×10⁻⁸). Ethnicity-specific meta-analysis revealed a significant correlation between DAS28-CRP and DAS28-ESR in Caucasians (correlation coefficient=0.943, 95% CI=0.915∼0.961, p<1.0×10⁻⁸) and Asians (correlation coefficient=0.927, 95% CI=
0.899∼0.948, p<1.0×10⁻⁸).
Heterogeneity, sensitivity test, and publication bias
Between-study heterogeneity was identified during the meta-analysis of comparison between DAS28-CRP and DAS28-ESR according to RA activity (Table 2). However, the meta-analytic ORs in high and low disease activity groups showed a same directionality, suggesting that the heterogeneity observed may not affect significantly the meta-analysis results. There was no heterogeneity ob- served in the meta-analysis of DAS28-CRP and DAS- 28-ESR based on EULAR response criteria (Table 3).Sensitivity analysis showed that no individual study signi ficantly affected the pooled OR, indicating that the results of this meta-analysis are robust. Funnel plots to detect publication bias showed symmetry, and Egger’s re- gression analysis showed no evidence of publication bias for the meta-analyses of DAS28-CRP and DAS28-ESR ad- dressed, except for the meta-analysis for good response (Table 3).
DISCUSSION
The original DAS was calculated based on the Ritchie ar- ticular index and 44-swollen joint count, and has been used as a tool to monitor disease activity in RA [22]. The DAS28-ESR was developed through modification of the original DAS for reasons of convenience [23], and the DAS28-CRP was proposed as a substitute for the DAS28-ESR because of the faster response of CRP to in- flammation changes compared to that of ESR.
In this meta-analysis, we combined the evidence com- paring DAS28-CRP and DAS28-ESR in assessing RA ac- tivity and the EULAR response criteria. This meta-analy-
sis of published studies showed a strong positive correla- tion between DAS28-CRP and DAS28-ESR, but values of DAS28-CRP were significantly smaller than those of DAS28-ESR in RA patients. In addition, DAS28-CRP yielded a higher number of patients classified as being in remission or with low disease activity than DAS28-ESR, while DAS28-CRP yielded a lower number of patients with high disease activity than DAS28-ESR. DAS28-CRP yielded a higher number of patients with good response than DAS28-ESR. Our meta-analysis demonstrates a sig- nificant discordance between DAS28-CRP and DAS28-ESR in evaluating RA activity and the EULAR response criteria. Although a positive correlation was found be- tween DAS28-CRP and DAS28-ESR, this correlation does not necessarily indicate that both scores agree with each other. DAS28-CRP values have been developed to produce equivalent results to those of DAS28-ESR, but our meta-analysis supports that DAS28-CRP and DAS28-ESR values may be not interchangeable. The dif- ference between DAS28-CRP and DAS28-ESR in assess- ing RA activity and EULAR response may be caused by the difference between CRP and ESR. ESR reflects dis- ease activity of the past few weeks, whereas CRP reflects more short-term changes in disease activity [5]. Thus, CRP is more sensitive to short-term changes in disease activity. Furthermore, ESR level is more affected by sev- eral factors including sex, age, immunoglobulin levels, fi- brinogen levels, rheumatoid factor, and anemia than CRP level [4].
When the cut-off values for DAS28-ESR are applied to DAS28-CRP, the disease activity could be overestimated, and the proportion of patients classified as being in re- mission could be increased. The DAS28-CRP may need lower cut-offs for categorizing disease activity than the DAS28-ESR. Whether the criteria of disease activity and the response criteria for DAS28-ESR could be applied to DAS28-CRP needs to be validated, because validated threshold values for DAS28-CRP have not been de- termined yet, and the discordance between DAS28-CRP and DAS28-ESR could result in different treatment deci- sions in RA patients.
The present study has some shortcomings that should be considered. First, the studies included in the meta-analysis were heterogeneous in their demographic characteristics and clinical features. The heterogeneity and confounding factors may have affected our results, which may be compounded by the limited information provided on clinical status and disease activity in the pop-
ulations involved. Second, ten studies were included in this meta-analysis, but all of these studies did not provide all type of data: The meta-analysis may be underpowered, especially in the comparison between DAS28-CRP and DAS28-ESR according to the EULAR response cri- teria, because only four studies were included in the meta-analysis.
Nevertheless, this meta-analysis also has its strengths.
Compared to individual studies, our meta-analysis study was able to provide more accurate data on the comparison between DAS28-CRP and DAS28-ESR in assessing RA activity and determining treatment response criteria by increasing the statistical power and resolution through pooling of the results of independent analyses.
In conclusion, our meta-analysis demonstrates that DAS28-CRP correlates well with DAS28-ESR, but DAS28-CRP underestimates disease activity and over- estimates response according to the EULAR response cri- teria compared to DAS28-ESR. Our data suggests that the DAS28-CRP needs to be evaluated using different cutoffs from those used for DAS28-ESR.
CONFLICT OF INTEREST
The authors have no financial or non-financial conflict of interest to declare.
REFERENCES
1. Scott DL, Wolfe F, Huizinga TW. Rheumatoid arthritis.
Lancet 2010;376:1094-108.
2. Fransen J, van Riel PL. The disease activity score and the EULAR response criteria. Clin Exp Rheumatol 2005;23(5 Suppl 39):S93-9.
3. Prevoo ML, van 't Hof MA, Kuper HH, van Leeuwen MA, van de Putte LB, van Riel PL. Modified disease activity scores that include twenty-eight-joint counts. Development and validation in a prospective longitudinal study of patients with rheumatoid arthritis. Arthritis Rheum 1995;38:44-8.
4. Talstad I, Scheie P, Dalen H, Röli J. Influence of plasma pro- teins on erythrocyte morphology and sedimentation. Scand J Haematol 1983;31:478-84.
5. van Leeuwen MA, van Rijswijk MH, van der Heijde DM, Te Meerman GJ, van Riel PL, Houtman PM, et al. The acute- phase response in relation to radiographic progression in early rheumatoid arthritis: a prospective study during the first three years of the disease. Br J Rheumatol 1993;32 Suppl 3:9-13.
6. Tamhane A, Redden DT, McGwin G Jr, Brown EE, Westfall AO, Reynolds RJ 4th, et al. Comparison of the disease activ- ity score using erythrocyte sedimentation rate and C-re- active protein in African Americans with rheumatoid arthritis. J Rheumatol 2013;40:1812-22.
7. Castrejón I, Ortiz AM, García-Vicuña R, Lopez-Bote JP, Humbría A, Carmona L, et al. Are the C-reactive protein val- ues and erythrocyte sedimentation rate equivalent when es- timating the 28-joint disease activity score in rheumatoid arthritis? Clin Exp Rheumatol 2008;26:769-75.
8. Nielung L, Christensen R, Danneskiold-Samsøe B, Bliddal H, Holm CC, Ellegaard K, et al. Validity and agreement be- tween the 28-joint disease activity score based on C-reactive protein and erythrocyte sedimentation rate in patients with rheumatoid arthritis. Arthritis 2015;2015:401690.
9. Son KM, Kim SY, Lee SH, Yang CM, Seo YI, Kim HA.
Comparison of the disease activity score using the eryth- rocyte sedimentation rate and C-reactive protein levels in Koreans with rheumatoid arthritis. Int J Rheum Dis 2015 Jul 22 [Epub]. DOI: 10.1111/1756-185X.12698.
10. Siemons L, Vonkeman HE, ten Klooster PM, van Riel PL, van de Laar MA. Interchangeability of 28-joint disease activ- ity scores using the erythrocyte sedimentation rate or the C-reactive protein as inflammatory marker. Clin Rheumatol 2014;33:783-9.
11. Hensor EM, Emery P, Bingham SJ, Conaghan PG.
Discrepancies in categorizing rheumatoid arthritis patients by DAS-28(ESR) and DAS-28(CRP): can they be reduced?
Rheumatology (Oxford) 2010;49:1521-9.
12. Crowson CS, Rahman MU, Matteson EL. Which measure of inflammation to use? A comparison of erythrocyte sed- imentation rate and C-reactive protein measurements from randomized clinical trials of golimumab in rheumatoid arthritis. J Rheumatol 2009;36:1606-10.
13. Wells GA, Boers M, Li T, Tugwell PS. Investigating the val- idity of the minimal disease activity state for patients with rheumatoid arthritis treated with abatacept. J Rheumatol 2009;36:260-5.
14. Inoue E, Yamanaka H, Hara M, Tomatsu T, Kamatani N.
Comparison of Disease Activity Score (DAS)28- erythrocyte sedimentation rate and DAS28- C-reactive protein thresh- old values. Ann Rheum Dis 2007;66:407-9.
15. Matsui T, Kuga Y, Kaneko A, Nishino J, Eto Y, Chiba N, et al. Disease Activity Score 28 (DAS28) using C-reactive pro- tein underestimates disease activity and overestimates EULAR response criteria compared with DAS28 using er- ythrocyte sedimentation rate in a large observational cohort of rheumatoid arthritis patients in Japan. Ann Rheum Dis 2007;66:1221-6.
16. Sengul I, Akcay-Yalbuzdag S, Ince B, Goksel-Karatepe A, Kaya T. Comparison of the DAS28-CRP and DAS28-ESR in patients with rheumatoid arthritis. Int J Rheum Dis 2015;18:640-5.
17. Stang A. Critical evaluation of the Newcastle-Ottawa scale for the assessment of the quality of nonrandomized studies in meta-analyses. Eur J Epidemiol 2010;25:603-5.
18. Davey Smith G, Egger M. Meta-analyses of randomised con- trolled trials. Lancet 1997;350:1182.
19. DerSimonian R, Laird N. Meta-analysis in clinical trials.
Control Clin Trials 1986;7:177-88.
20. Higgins JP, Thompson SG. Quantifying heterogeneity in a meta-analysis. Stat Med 2002;21:1539-58.
21. Egger M, Davey Smith G, Schneider M, Minder C. Bias in meta-analysis detected by a simple, graphical test. BMJ 1997;315:629-34.
22. van der Heijde DM, van 't Hof MA, van Riel PL, Theunisse
LA, Lubberts EW, van Leeuwen MA, et al. Judging disease activity in clinical practice in rheumatoid arthritis: first step in the development of a disease activity score. Ann Rheum Dis 1990;49:916-20.
23. Prevoo ML, van 't Hof MA, Kuper HH, van Leeuwen MA, van
de Putte LB, van Riel PL. Modified disease activity scores that include twenty-eight-joint counts. Development and validation in a prospective longitudinal study of patients with rheumatoid arthritis. Arthritis Rheum 1995;38:44-8.