The Washout Effect of Precipitation on Atmospheric PM
10Concentrations in Busan Metropolitan City
Sunyurp Park*
부산광역시 대기 중 PM
10농도에 대한 강수의 세정효과 분석
박선엽*
Abstract : Frequent occurrences of high PM10(particulate matter ≤10μm) concentrations have become a serious environmental concern in Korea due to their direct threat to public health, but the impacts of rainfall factors on PM10 concentrations are not well known. This study analyzed 15-year long PM10 data over Busan Metro- politan City(BMC) to quantify the washout effect of precipitation on PM10 concentrations in the city. Two different washout ratios, the aggregated washout ratio(AWR) and the immediate washout ratio(IWR), were suggested as a washout indicator. Seasonal mean washout ratios were highest in spring followed by summer, fall, and winter for both washout ratios. However, monthly analyses showed that rainfall variables, such as its amount, frequency, intensity, and the number of consecutive rainy days, did not have consistent correlations with the washout ratios. The cumulative impact of consecutive rainy days, typically ranging from 1 to 4 days, on the PM10 washout effect was also inconsistent. Study results indicated that the cumulative rainfall during a rainy period and the length of a rainy period had only a limited correlation with IWR on the monthly basis.
Key Words : PM10, washout effect, aggregated washout ratio, immediate washout ratio
요약 :우리나라 대기 중 고농도 PM10 현상의 빈번한 발생은 공중 보건을 직접적으로 위협하는 심각한 환경문제
로 인식되고 있으나, PM10 농도에 미치는 강수 인자의 영향은 충분히 알려져 있지 않다. 본 연구는 부산광역시에
서 지난 15년간 관측된 PM10 자료를 분석하여 대기 PM10 농도에 대한 강수현상의 세정효과를 파악하고자 하였 다. 강수의 세정효과는 합산세정율(Aggregated Washout Ratio, AWR)과 개별강우세정율(Immediate Washout Ratio, IWR) 등 두 가지 서로 다른 세정율로 지표화하였다. 계절별 세정효과의 크기는 합산세정율과 개별강우 세정율 모두 봄>여름>가을>겨울 순으로 나타났다. 그러나 월별로 세분한 분석결과에 따르면, 각 세정율은 강우 량, 강우강도, 강우빈도, 연속강우일수 등의 주요 강수변수와 일관된 상관관계를 보이지 않았다. 대부분 1~4일
범위에 걸쳐있는 연속강우일수와 연속강우기간 중 누적 강우량 역시 PM10 세정율과 일관성 있는 상관성을 나타
내지 않았다. 연속강우일수 또는 연속강우기간 누적강우량이 PM10농도의 개별강우세정율과 유의한 상관관계를
보이는 경우는 월별로 제한적으로 나타났다.
주요어 :PM10, 세정효과, 합산세정율, 개별강우세정율
This research was financially supported by the Basic Science Research Program through the National Research Foundation(NRF) of Ko- rea funded by the Ministry of Education, Science and Technology(grant number NRF-2010-0024819).
* Associate Professor, Department of Geography Education, Pusan National University, [email protected]
1. Introduction
Particulate matter in the atmosphere is an impor- tant component of the urban air quality and public health, and it has a significant influence on climate change(Dockery and Pope, 1994; Kaufman et al., 2002;
Kwon et al., 2002; Davidson et al., 2005; Remer et al., 2008; Lee et al., 2009; Jeong et al., 2013; Jo et al., 2017).
Suspended particles, such as particulate matter with a diameter ≤10μm(PM10), became a serious concern in Ko- rea due to their frequent threat to public health. It is well known that PM10 concentrations have a distinct seasonal and spatial pattern(Lee et al., 2011; Jeon, 2012; Kim and Lee, 2013). Long-term meteorological records indicated that the air quality of Korea was significantly influenced by Asian dust, and more than 80% of Asian dust events occurred in spring(Kim, 2008; Kim and Lee, 2013). De- spite the strong influence of Asian dust on the air quality, the number of Asian dust days is no more than 2% of the whole year. It is believed that most of particulate matter has anthropogenic sources, and more than two thirds of PM10 comes from external origins(Lee et al., 2011; Park, 2017).
The impact of pollutants from East China on the sea- sonal air quality over the Korean Peninsula is substantial due to rapid industrialization and agricultural activities in the region(Richter et al., 2005; Kim et al., 2007; Lee et al., 2005; Song et al., 2009; Lee et al., 2010; Lee et al., 2011; Kim and Lee, 2013). Recent studies reported that spring and winter were the most polluted seasons in East China while the lowest PM10 concentration was ob- served in summer, which was associated with the Asian monsoon(Qu et al., 2010; Wang et al., 2015). In addi- tion, significant correlations between the diurnal and weekly cycles of PM10 concentrations and human activi- ties in metropolitan cities are a clear evidence of internal sources of the pollutant(Jeon, 2003; Jin et al., 2003; Jeon, 2010). These anthropogenic aerosols have typical radii
from 0.001 to 10μm, and their atmospheric lifetimes are mostly less than a week(Haywood and Boucher, 2000;
Ramanathan et al., 2001). Therefore, the short-term behavior of PM10 concentrations needs to be treated as a crucial aspect in the pollutant management of the urban environment(Kim et al., 2014).
Since airborne particulate matter has become a day-to- day problem nationwide due to its broad geographic cov- erage and persistent characteristics, more stringent regu- lations on the levels of particulate matter concentrations should be considered(Jo et al., 2017; Zhang et al., 2017).
In fact, daily statistics of PM10 observations showed that the number of days exceeding the World Health Organization(WHO)’s standard(50μg/m3) was 57.1%
and 41.6% in spring and winter, respectively and had reached up to 65.9% locally in a metropolitan city(Park, 2017). To better establish air-quality standards for public health and environmental security, intimate relationships between atmospheric pollutants and meteorological fac- tors have to be determined on various temporal scales.
The washout effect of rainfall on particulate matter is an important mechanism of pollutant removal in the atmosphere. Given the seasonally uneven distribution of precipitation in Korea, understanding of the role of precipitation in PM10 washout is a critical issue of public health in the region. Most previous studies on urban PM10 dynamics focused primarily on the emission, trans- port, and dispersion of PM10 in relation to meteorological factors(Lee et al., 2011; Jeon, 2012; Kim and Lee, 2013).
However, an investigation on PM10 washout effects by rainfall has been rare, and the spatiotemporal analyses of PM10 washout effects are very limited in metropoli- tan cities(Lim et al., 2012; Lim et al., 2013; Kim et al., 2014; Yoo et al., 2014). Lack of studies on PM10 washout is in part due to the shortage of air quality data. The national networks of PM10 monitoring systems were not established until recently, and long-term PM10 observa- tion records are limited on the national scale(Park and Choi, 2016). The washout effect of rainfall on atmo-
spheric PM10 was previously assessed by comparing the PM10 concentrations of rainy days against those of dry days over an entire year or multi-years in a cumulative way(Lim et al., 2012; Lim et al., 2013). However, the impact of individual rainfall events on PM10 concen- tration changes could not be adequately evaluated by the annually or multi-annually integrated relationship between precipitation and PM10 concentrations. Since a washout effect of air pollutants is dependent upon the temporal characteristics of precipitation, it is valuable to consider the amount, intensity, frequency, and dura- tion of rainfall in PM10 studies. This study investigates the impacts of rainfall episodes on PM10 concentration changes in Busan Metropolitan City(BMC), Korea dur- ing 2001~2015.
2. Materials and Methods
1) Study area
BMC is the largest port city in Korea, and it is the economic, educational, and cultural center in the south- eastern region of the nation with its population of 3.5 million(Figure 1). The city has humid subtropical winter- dry climate, and it is hot and wet in summer and cold and dry in winter. The city’s annual mean temperature and total precipitation are 14.7°C and 1,519mm, respectively.
More than a half(51%) of annual total precipitation is concentrated in summer from June to August, while precipitation in winter takes up only 7% of the annual precipitation. Degradation of the city’s air quality is an urgent environmental problem, and it is primarily due to industrial development, urban sprawl, and the increase of fine dust concentration. It has been reported that the increase of the PM10 concentration of the coastal city is accelerated due to the emission of ships on the shore in addition to the rapid increase of the traffic volume(Jeon,
2010).
2) Data analyses
PM10 concentration records from 2001 to 2015 were collected from the network of the air quality monitoring system operated by the National Institute of Environ- mental Research(NIER). Hourly records were averaged for 24 hours to compute daily data, and monthly mean was computed by averaging daily records if the number of observations were 20 days or more per month(Jeon, 2010). For seasonal analyses, monthly records were di- vided into four seasons; spring(March, April, and May), summer(June, July, and August), fall(September, Octo- ber, and November), and winter(December, January, and February). PM10 concentrations are strongly influenced by the Asian dust especially in spring over the Korean Peninsula(Chun et al., 2001; Chun et al., 2008; Kim and Lee, 2013). To avoid the influence of Asian dust events, PM10 data on Asian dust days were excluded from data analyses. Daily precipitation and Asian dust occurrence data during the study period were acquired from 12 au- tomatic weather systems(AWS) and 1 automatic synoptic observing system(ASOS) managed by the Korea Meteo- rological Administration(KMA). Locations of weather stations and PM10 monitoring sites do not correspond to each other. For comparative analyses of PM10 and precipi- tation data, the closest weather station was selected for each PM10 monitoring site.
A washout effect refers to a process by which atmo- spheric pollutants are removed by hydrometeors, such as rain and snow, and deposited to the ground, and it is quantitatively assessed by a washout or scavenging ratio(Chate et al., 2003; Hicks, 2005; González and Aristizábal, 2012). Determination of the amount of particulate matter removed by rainfall is a difficult task.
This is simply because rainfall events are a variable phe- nomenon in terms of their amount, duration, frequency, and intensity. Often, these rainfall characteristics vary
over time, and the concentrations of particulate matter are not measured at the same geographic locations as weather stations. Even during a rainfall event, separate, multiple sub-events of rainfall may exist(Kim et al., 2014). For comparative analyses between monthly and rainfall-event washout effects, two separate rainfall- washout indices were newly formulated for non-Asian- dust days in this study. The first one is the aggregated washout ratio(AWR). This ratio is based on the difference between the mean PM10 concentrations of dry(Cdry_mn) and rainy(Crain_mn) days, which is then converted into its proportion of the mean PM10 concentration of dry days per month:
AWR(%)= Cdry_mn-Crain_mn
Cdry_mn ×100
The second one is the immediate washout ratio (IWR).
IWR is an individual rainfall episode-based measure, and it compared the PM10 concentration of a rainy day and that of a dry day(Cdry) preceding the rainy day(Crain).
Then, it computed the difference between the two quan- tities divided by the PM10 concentration of that dry day.
Then, individual IWRs were finally averaged over the month:
IWR(%)= Cdry-Crain
Cdry ×100
When the impact of consecutive rainy days on the Figure 1. Busan Metropolitan City. The locations of PM10 monitoring stations are provided with the shaded-relief
image draped over the city
rainfall washout effect was evaluated, the mean PM10
concentration of the consecutive rainy days was used in the computation.
3. Results and Discussion
1) Seasonal characteristics of PM10
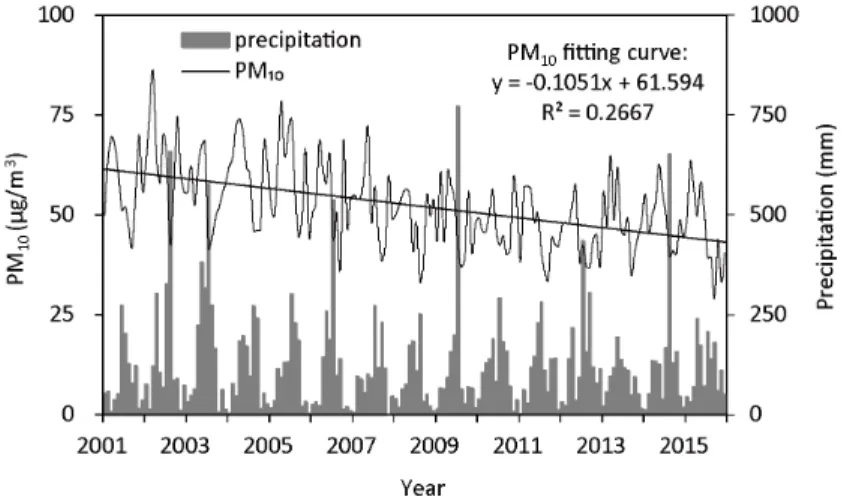
PM10 concentrations on non-Asian dust days of BMC showed an obvious declining pattern during the study period(Figure 2). However, 36.8% of the city’s daily mean observations(2,018 days out of 5,478 days) ex- ceeded WHO’s 24-hour mean PM10 standard of 50μg/
m3. Seasonally speaking, 55.4% and 41.0% of the daily observations exceeded the 24-hour mean PM10 standard of WHO in spring and winter, respectively. By contrast, the domestic PM10 standard(100μg/m3) is much more lenient compared to that of WHO. The number of days, where mean PM10 concentrations were higher than the national standard, were only 7.2% and 4.8% of all observations under consideration in spring and winter, respectively. Considering the significant discrepancy be- tween the two different air-quality standards, it is urgent
to revise the national measures to better control the PM10
concentration over major urban areas in the nation(Park, 2017). Monthly mean records showed that the highest PM10 concentration was typically observed in spring (57.7±2.0μg/m3) followed by winter(49.6±2.5μg/m3), summer(47.0±2.0μg/m3), and fall(45.2±2.3μg/m3).
These interannual and monthly PM10 concentra- tion patterns were not statistically correlated with the distributions of annual and monthly precipitation, respectively(Figure 3). Studies reported that the role of precipitation in wet deposition had varied from month to month in East Asia(Wu, 2014; Feng et al., 2017). The seasonal frequency of high PM10 concentrations(>100μg/
m3) was observed in the order of spring(7.2%) > win- ter(4.8%) > fall(3.2%) > summer(3.0%), but the their mean concentration was found in the order of spring(118.6μg/m3) > fall(118.4μg/m3) > winter(117.9μg/
m3) > summer(116.3μg/m3). Therefore, the seasonal dy- namics of particulate matter in terms of its accumulation and removal are very complex, and the impact of precipi- tation on PM10 concentrations needs to be evaluated on the basis of individual rainfall events.
A frequency analysis showed that PM10 concentrations ranging from 20μg/m3 to 60μg/m3 were most common and they accounted for 65.9% of all daily observations.
Figure 2. Monthly mean PM10 concentration and precipitation(2001~2015)
The mode of PM10 concentration varied within the range depending on locations. In terms of the distribution of PM10 concentrations, skewness and kurtosis increased as the mean PM10 concentration of a location increased.
In other words, the distribution of PM10 concentra- tions skewed to the right and the peak of the frequency distribution curve became taller with increasing PM10
concentrations(Figure 4). These descriptive statistics indicated that land use characteristics were contribut-
ing factors of local PM10 concentration levels. High- level PM10 concentrations were recorded in industrial areas(Daejeo and Janglim), while mountain and resi- dential areas(Gudeoksan and Jwadong) were associated with lower concentrations. Commercial areas(Yeonsan and Deokcheon) showed mid-range PM10 concentra- tions. However, the relationship between land uses and PM10 concentrations is not fully evident because the spatial distributions of PM10 concentrations had a west- Figure 3. Monthly means of precipitation and PM10 concentrations(2001~2015).
Standard error bars for each data set are also provided
Figure 4. Frequency distributions of daily PM10 concentrations for industrial(Daejeo and Janglim), commercial(Yeonsan and Deokcheon), residential(Jwadong), and mountain(Gudeoksan) areas during
2001~2015. Only six characteristic sites are selected for visual clarity
high and east-low pattern, which is spatiotemporally attributed to the influence of pollutants coming from eastern China(Chun et al., 2001; Lee et al., 2011; Jeon, 2012). The overall levels of PM10 concentrations changed with seasons, but the typical west-high and east-low pat- tern persisted throughout the year. PM10 concentrations tended to decrease as the PM10 monitoring sites went from west to east during the four seasons(Figure 5).
2) Impacts of rainfall variables
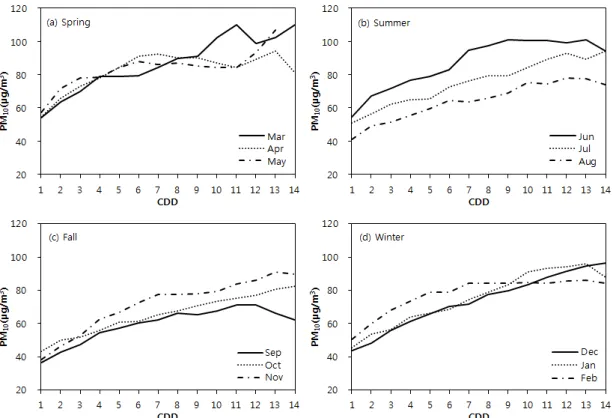
The number of consecutive dry days(CDD) before pre- cipitation typically ranged from 1 to 7 days(76.2%), and
it was compared with the changes of PM10 concentration.
Cumulative mean PM10 concentrations did not change consistently over the year as the dry period became longer. For instance, PM10 concentrations did not show an apparent increasing trend in spring or summer. In fall and winter(October~January), however, cumulative mean PM10 concentrations increased more consistently as CDD increased. Unlike cumulative mean PM10 concen- trations, the maximum PM10 concentration of a dry pe- riod significantly increased with increasing CDD(Figure 6). Since the minimum PM10 concentration of a dry pe- riod decreased as CDD increased, there were significant variations of PM10 concentrations during a continuous Figure 5. Mean PM10 concentrations in four different seasons. Data on Asian dust days were excluded.
dry period.
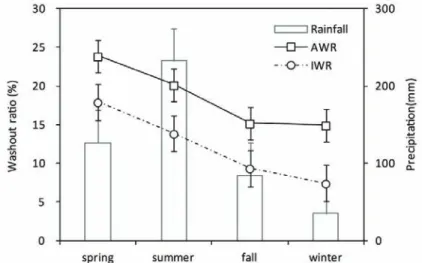
It is obvious that the amount of rainfall is the most important variable in the washout effect, but the im- pact of rainfall on the washout process also depends on the range of rainfall amount, rainfall intensity, and the temporal phase of rainfall(Engelmann, 1971; Cas- tro et al., 2010; Lim et al., 2013). The seasonal means of both washout ratios were highest in spring(AWR 23.9±1%, IWR 17.9±0.6%,) followed by summer(AWR 20.1±1.0%, IWR 13.9±0.9%), fall(AWR 15.2±1.2%, IWR 9.4±1.2%), and winter(AWR 14.9±2.8%, IWR 7.4±1.3%). The washout ratios were highest in spring, which is the second wettest season in the city. Daily mean rainfall was 15.7±0.5mm in spring, and it is believed that the amount and intensity of spring rainfall was high enough to reduce a large amount of particulate matter in the atmosphere. The washout ratios in summer were
higher than those in fall in general due to the signifi- cantly higher rainfall amount in summer(232.8mm) compared to that in fall(84.6mm) (Figure 7). On the other hand, the washout ratios were lowest in winter, and it may be associated with its lowest seasonal rainfall and intensity with the daily mean rainfall of 7.3±0.2mm.
Knowing that the second highest seasonal mean PM10
concentration was observed in winter, this result has an important implication for PM10 management plans and policies of the city. The magnitude of external in- put of PM10 is directly influenced by aerosol emission from eastern China due to dominant westerly winds in the region. Moreover, it is well known that most cit- ies in eastern China have wintertime maxima in PM10
concentrations(Qu et al., 2010; Wang et al., 2015). Since it has been increasingly reported that air quality in a location could be affected by air transport of pollutants
Figure 6. Seasonal comparisons of maximum PM10 concentrations with the increasing number of consecutive dry days(CDD)
from distant sources, the transboundary impacts of PM10
emission need to be assessed for proper PM10 mitigation policies in BMC(Jaff e et al., 1999; Liu et al. 2009; Zhang et al., 2017).
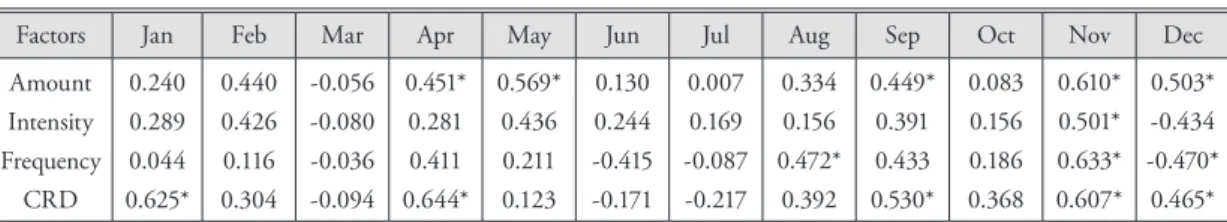
Monthly analysis results showed that the impact of rainfall on AWR varied in terms of its amount, fre- quency, intensity, and the number of consecutive rainy days(CRD). Overall, rainfall amount and CRD had a stronger correlation with AWR compared to rainfall frequency and intensity(Figure 8). It is noticeable that
none of the four rainfall variables were statistically cor- related with AWR in March, June, and July. In addi- tion, an unexpected negative correlation was observed between AWR and rainfall amount, frequency, and intensity in December during the study period(Table 1). Knowing that December is the lowest month in frequency(4.3days/month) of rainy days and the second lowest month in rainfall amount(30.8mm/month) and intensity(6.8mm/day), weak washout effects and atmo- spheric inversion at the surface under cold environment
Figure 8. Correlations between AWR and four different precipitation parameters (rainfall amount, intensity, frequency, and CRD)
Figure 7. Comparison between seasonal precipitation and two seasonal mean washout ratios, AWR and IWR
may have contributed to the negative correlation in that month(Jeon, 2012).
3) Impacts of individual rainfall episodes
The washout effect of individual rainfall episodes(716 rainfall periods on average) immediately after a dry pe- riod was evaluated during the study period. Individual IWRs were averaged by month and compared with monthly mean rainfall and rainfall intensity(Figure 9).
Their correlation was found significant from January to July, but it declined afterwards. One unexpected result was a negative correlation between IWR and rainfall factors(both rainfall amount and intensity) in April. This negative correlation means that immediate PM10 wash- out ratios tended to diminish as the amount and intensity of rainfall right after a dry day increased. Although this
is an anomalous outcome, the reason for this eccentric relationship is unclear.
The length of a rainy period was expressed as CRD, which ranged from 1 to 4 days in most cases(95.9%). The cumulative rainfall during a rainy period and the length of a rainy period had selective correlations with IWR from month to month. The cumulative rainfall during a rainy period had significant correlations with IWR in January, June, and July while CRD was correlated with IWR in January, April, September, and December(Table 2). Statistically, neither the cumulative rainfall during a rainy period nor the length of a rainy period showed any significant correlation with IWR in February, March, May, August, October, and November. This inconsistent correlation between IWR and cumulative rainfall fac- tors indicated that ambient atmospheric conditions, such as winds, air pressure systems, humidity, and air tem- Table 1. Pearson’s Correlation coefficients calculated between AWR and precipitation parameters
(amount, intensity, frequency of rainfall, and CRD)
Factors Jan Feb Mar Apr May Jun Jul Aug Sep Oct Nov Dec
Amount Intensity Frequency
CRD
0.240 0.289 0.044 0.625*
0.440 0.426 0.116 0.304
-0.056 -0.080 -0.036 -0.094
0.451*
0.281 0.411 0.644*
0.569*
0.436 0.211 0.123
0.130 0.244 -0.415 -0.171
0.007 0.169 -0.087 -0.217
0.334 0.156 0.472*
0.392 0.449*
0.391 0.433 0.530*
0.083 0.156 0.186 0.368
0.610*
0.501*
0.633*
0.607*
0.503*
-0.434 -0.470*
0.465*
* Significance, p<0.05
Figure 9. Correlations coefficients between precipitation and IWR
perature, should be further considered in the pollutant washout process(Giri et al., 2008; Jo et al., 2017). Shin et al.(2007) analyzed PM10 concentrations in Incheon, the second largest coastal city in the nation, and concluded that westerly winds and stagnant wind conditions were strongly associated with high PM10 concentrations. As the largest coastal city in the nation, BMC tends to be more vulnerable to air pollution caused by port activities and sea breeze than any other port cities. Therefore, ad- ditional effort should be sought to better determine the influences of these coastal factors on PM10 concentrations and obtain more comprehensive understanding of PM10
dynamics in the city.
4. Conclusions
Study results showed that the order of seasonal PM10
concentrations did not correspond to that of washout ra- tios in the city. Especially, both washout ratios, AWR and IWR, were lowest in winter, when PM10 concentrations were the second highest for the year in BMC. The low washout effect in wintertime is problematic for PM10 con- trols and management because high PM10 concentrations in winter in East China may have an adverse influence on the Korean peninsula due to constant westerly winds.
These seasonal and geographical characteristics of PM10
are crucial for the environmental policy-making pro- cesses of the city. Unfortunately, it is very difficult to ac- curately identify the external sources of PM10 because the
pollutant is transported over long distances and spread into broad areas. Anthropogenic pollutants are common- ly mixed with natural substances, such as particles from forest fires and the Asian dust, and it is often difficult to trace back to their origins(Lemire et al., 2002; Davidson et al., 2005). This means that seasonal and international perspectives are required for PM10 controls and manage- ment of the city.
The washout ratios had inconsistent correlations with rainfall factors. AWR measured how PM10 concentra- tions on rainy days were different from those on dry days in an integrative manner, and it was influenced more strongly by rainfall amount and the number of consecutive rainy days compared to rainfall intensity and frequency. On the other hand, analyses of rainfall event-based IWR showed that the PM10 washout effect of individual rainfall events right after a dry period was significantly different from the aggregated washout ef- fect. Although IWR had fairly similar correlations with the amount and intensity of rainfall, the influence of the length of a rainy period on PM10 washout was not critical.
These short-term analyses of the washout effects indi- cated that rainfall factors might play selective or variable roles in PM10 concentration changes. Since the overall level of PM10 concentrations is evaluated significantly high in BMC against the WHO’s standards, individual rainfall-based washout effects rather than seasonally or yearly averaged ones should be considered more proac- tively in the policy-making processes of the city.
Table 2. Pearson’s Correlation coefficients calculated between IWR and consecutive rainfall factors (cumulative rainfall and CRD)
Factors Jan Feb Mar Apr May Jun Jul Aug Sep Oct Nov Dec
Rainfall CRD
0.853**
0.555*
0.414 0.289
0.044 0.053
0.340 0.571*
0.270 -0.066
0.641**
0.156
0.509*
0.403 0.370 0.454
0.401 0.556*
0.352 0.237
0.501 0.157
0.017 0.524*
* Significance, p<0.05, **p<0.01
References
Castro, A., Alonso-Blanco, E., González-Colino, M., Calvo, A.I., Fernández-Raga, M., and Fraile, R., 2010, Aerosol size distribution in precipitation events in León, Spain, Atmospheric Research, 96, 421-435.
Chate, D.M., Rao, P.S.P., Naik, M.S., Momin, G.A., Safai, P.D., and Ali, K., 2003, Scavenging of aerosols and their chemical species by rain, Atmospheric Environ- ment, 37, 2477-2484.
Chun, Y., Boo, K.O., Kim, J., Park, S.U., and Lee, M., 2001, Synopsis, transport, and physical characteristics of Asian dust in Korea, Journal of Geophysical Research, 106, 18461-18469.
Chun, Y., Cho, H.K., Chung, H.S., and Lee, M., 2008, Historical records of Asian dust events (Hwangsa) in Korea, Bulletin of the American Meteorological So- ciety, 89, 823-827.
Davidson, C.I., Phalen, R.F., and Solomon, P.A., 2005, Airborne particulate matter and human health: a review, Aerosol Science and Technology, 39, 737-749.
Dockery, D.W. and Pope, C.A., 1994, Acute respiratory ef- fects of particulate air pollution, Annual Review of Public Health, 15, 107-132.
Engelmann, R., 1971, Scavenging prediction using ratios of concentrations in air and precipitation, Journal of Applied Meteorology, 10, 493-497.
Feng, J., Li, J., Zhu, J., Liao, H., and Yang, Y., 2017, Simu- lated contrasting influences of two La Niña Modoki events on aerosol concentrations over eastern China, Journal of Geophysical Research: Atmosphere, 122, 2734-2749, doi:10.1002/2016JD026175.
Giri, D., Murthy, K., and Adhikary, P.R., 2008, The influ- ence of meteorological conditions on PM10 concen- trations in Kathmandu Valley, International Journal of Environmental Research, 2, 49-60.
González, C.M. and Aristizábal, B.H., 2012, Acid rain and particulate matter dynamics in a mid-sized Andean city: the effect of rain intensity on ion scavenging, Atmospheric Environment, 60, 164-171.
Haywood, J. and Boucher, O., 2000, Estimates of the direct and indirect radiative forcing due to tropospheric
aerosols: a review, Reviews of Geophysics, 38, 513- 543.
Hicks, B.B., 2005, A climatology of wet deposition scaveng- ing ratios for the United States, Atmospheric Envi- ronment, 39, 1585-1596.
Jaffe, D., Anderson, T., Covert, D., Kotchenruther, R., Trost, B., Danielson, J., Simpson, W., Berntsen, T., Karls- dottir, S., Blake, D., Harris, J., Carmichael, G., and Uno, I., 1999, Transport of Asian air pollution to North America, Geophysical Research Letters, 26, 711-714.
Jeon, B.I., 2003, Characteristics of spacio-temporal variation for PM10 concentration in Busan, Journal of the Envi- ronmental Sciences, 12, 1033-1041.
Jeon, B.I., 2010, Characteristics of spacio-temporal variation for PM10 and PM2.5 concentration in Busan, Journal of the Environmental Sciences, 19, 1013-1023.
Jeon, B.I., 2012, Meteorological characteristics of wintertime high PM10 concentration episodes in Busan, Journal of the Environmental Sciences, 21, 815-824.
Jeong, J. H., Kim, H.S., Kim, J.T., Park, Y.P., and Choi, H.J., 2013, An analysis of aerosol direct radiative forcing using satellite data in East Asia during 2001-2010, Journal of Environmental Science International, 22, 1053-1062.
Jin, Y.H., Koo, H.J., Kim, B.M., Kim, Y.P., and Park, S.U., 2003, Variations of the PM10 concentrations ob- served in eleven cities in South Korea between 1995 and 2000, Journal of Korean Society for Atmospheric Environment, 19, 231-245.
Jo, E.J., Lee, W.S., Jo, H.Y., Kim, C.H., Eom, J.S., Mok, J.H., Kim, M.H., Lee, K., Kim, K.U., Lee, M.K., and Park, H.K., 2017, Effects of particulate matter on respiratory disease and the impact of meteorolog- ical factors in Busan, Korea, Respiratory Medicine, 124, 79-87.
Kaufman, Y.J., Tanré, D., and Boucher, O., 2002, A satellite view of aerosols in the climate system, Nature, 419, 215-223.
Kim, J., 2008, Transport routes and source regions of Asian dust observed in Korea during the past 40 years (1965-2004), Atmospheric Environment, 42, 4778-
4789.
Kim, S., Hong, K.H., Jun, H., Park, Y.J., and Park, M., 2014, Effect of precipitation on air pollutant concentration in Seoul, Korea, Asian Journal of Atmospheric Envi- ronment, 8, 202-211.
Kim, S. and Lee, S., 2013, The analysis of the weather charac- teristics by source region of the Asian Dust observed in South Korea, Journal of the Korean Geographical Society, 48, 167-183.
Kim, S.W., Yoon, S.C., Kim, J., and Kim, S.Y., 2007, Sea- sonal and monthly variations of columnar aerosol optical properties over East Asia determined from multi-year MODIS, Lidar, and AERONET sun/
sky radiometer measurements, Atmospheric Environ- ment, 41, 1634-1651.
Kwon, H.J., Cho, S.H., Chun, Y., Lagarde, F., and Persha- gen, G., 2002, Effects of the Asian dust events on daily mortality in Seoul, Korea, Environmental Re- search Section A, 90, 1-5.
Lee, S., Ho, C.H., and Choi, Y.S., 2011, High-PM10 concen- tration in Seoul, Korea: background sources and related meteorological conditions, Atmospheric En- vironment, 45, 7240-7247.
Lee, K.H., Kim, J.E., Kim, Y.J., Kim, J., and von Hoynin- gen-Huenec, W., 2005, Impact of the smoke aerosol from Russian forest fires on the atmospheric envi- ronment over Korea during May 2003, Atmospheric Environment, 39, 85-99.
Lee, K., Li, Z., Kim, Y., and Kokhanovsky, A., 2009, Atmo- spheric aerosol monitoring from satellite observa- tions: a history of three decades, in Kim, Y., Platt, U., Gu, M.B., and Iwahashi, H., Atmospheric and Biological Environmental Monitoring, Springer, New York, 13-38.
Lee, Y.C., Yang, X., and Wenig, M., 2010, Transport of dusts from East Asian and non-East Asian sources to Hong Kong during dust storm related events 1996- 2007, Atmospheric Environment, 44, 3728-3738.
Lemire, K.R., Allen, D.T., Klouda, G.A., and Lewis, C.W., 2002, Fine particulate matter source attribu- tion for Southwest Texas using 14C/13C ratios, Journal of Geophysical Research, 107 (D22), 4613,
doi:10.1029/2002JD002339.
Lim, D., Lee, T.J., and Kim, D.S., 2012, Quantitative esti- mation of precipitation scavenging and wind disper- sion contributions for PM10 and NO2 using long- term air and weather monitoring database during 2000~2009 in Korea, Journal of Korean Society for Atmospheric Environment, 28, 325-347.
Lim, D., Lee, T.J., and Kim, D.S., 2013, Development and validation test of effective wet scavenging contribu- tion regression models using long-term air monitor- ing and weather database, Journal of Korean Society for Atmospheric Environment, 29, 297-306.
Liu, J., Mauzerall, D.L., and Horowitz, L.W., 2009, Evaluat- ing inter-continental transport of fine aerosols:(2) global health impact, Atmospheric Environment, 43, 4339-4347.
Park, S., 2017, Spaciotemporal distributions of PM10 concen- tration and their correlation with local temperature changes: a case study of Busan Metropolitan City, Journal of the Korean Association of Regional Geogra- phers, 23, 151-167.
Park, S. and Choi, J., 2016, Satellite-measured atmospheric aerosol content in Korea: anthropogenic signals from decadal records, GIScience & Remote Sensing, 53, 634-650.
Qu, W.J., Arimoto, R., Zhang, X.Y., Xhao, C.H., Wang, Y.Q., Sheng, L.F., and Fu, G., 2010, Spatial distri- bution and interannual variation of surface PM10
concentrations over eighty-six Chinese cities, Atmo- spheric Chemistry and Physics, 10, 5641-5662.
Ramanathan, V., Crutzen, P.J., Kiehl, J.T., and Rosenfeld, D., 2001, Aerosols, climate, and the hydrological cycles, Science, 294, 2119-2124.
Remer, L.A., Kleidman, R.G., Levy, R.C., Kaufman, Y.J., Tanré, D., Mattoo, S., Martins, J.V., Ichoku, C., Koren, I., Yu, H., and Holben, B.N., 2008, Global aerosol climatology from the MODIS satellite sen- sors, Journal of Geophysical Research, 113, D14S07, doi:10.1029/2007JD009661.
Richter, A., Burrows, J.P., Nüß, H., Granier, C., and Nie- meier, U., 2005, Increase in tropospheric nitrogen dioxide over China observed from space, Nature,
437, 129-132.
Shin, M.K., Lee, C.D., Ha, H.S., Park, C.S., and Kim, Y.H., 2007, The influence of meteorological factors on PM10 concentration in Incheon, Journal of Korean Society for Atmospheric Environment, 23, 322-331.
Song, C.K., Ho, C.H., Park, R.J., Choi, Y.S., Kim, J., Gong, D.Y., and Lee, Y.B., 2009, Spatial and seasonal variations of surface PM10 concentration and MO- DIS aerosol optical depth over China, Asia-Pacific Journal of Atmospheric Sciences, 416, 33-43.
Wang, Y.Q., Zhang, X.Y., Sun, J.Y., Zhang, X.C., Che, X.C., and Li, Y., 2015, Spatial and temporal variations of the concentrations of PM10, PM2.5 and PM1 in Chi- na, Atmospheric Chemistry and Physics, 15, 13585- 13598.
Wu, R., 2014, Seasonal dependence of factors of year-to-year variations in South china AOD and Hong Kong air quality, International Journal of Climatology, 34, 3204-3220.
Yoo, J.M., Lee, Y.R., Kim, D., Jeong, M.J., Stockwell, W.R., Kundu, P.K., Oh, S.M., Shin, D.B., and Lee, S.J., 2014, New indices for wet scavenging of air pollut-
ants (O3, CO, NO2, SO2, and PM10) by summer- time rain, Atmospheric Environment, 82, 226-237.
Zhang, Q., Jiang, X., Tong, D., Davis, S.J., Zhao, H., Geng, G., Feng, T., Zheng, B., Lu, Z., Streets, D.G., Ni, R., Brauer, M., von Donkelaar, A., Martin, R.V., Huo, H., Liu, Z., Pan, D., Kan, H., Yan, Y., Lin, J., He, K., and Guan, D., 2017, Transboundary health impacts of transported global air pollution and in- ternational trade, Nature, 543, 705-709.
Correspondence: Sunyurp Park, Department of Geography Education, Pusan National University, Busan 46241, Korea (e-mail: [email protected], telephone: 82-51-510-2655, fax:
82-51-510-2655)
교신: 박선엽, 46241, 부산광역시 금정구 부산대학로 63 번길 2, 부산대학교 사범대학 지리교육과(이메일: spark
@pusan.ac.kr, 전화: 051-510-2655, 팩스: 051-510-2655)
Recieved May 12, 2017 Revised June 8, 2017 Accepted June 21, 2017