Depletion of Mitochondrial DNA Stabilizes C1qTNF-Related Protein 6 mRNA in Muscle Cells
Mutation and reduction of mitochondrial DNA (mtDNA) have been suggested as factors in the pathogenesis of several metabolic diseases. Recently, we demonstrated that C1qTNF- related protein-6 (CTRP6) is involved in fatty acid metabolism in muscle cells. In this study, we showed that expression of CTRP6 was up-regulated in mtDNA-depleted C2C12 cells, which displayed a marked decrease in cellular mtDNA and ATP content. Replacement of mtDNA normalized the expression level of CTRP6 similar to that in normal C2C12 cells, indicating that CTRP6 expression was up-regulated by mtDNA depletion. However, CTRP6 promoter activity remained unchanged in mtDNA-depleted cells. We also found that mtDNA depletion inhibited decay of CTRP6 mRNA. Taken together, mtDNA depletion induces an increase in CTRP6 expression by increasing mRNA stability.
Key Words: DNA, Mitochondrial; CTRP6; C1qTNF-6; mRNA Stability; C2C12 Cells Mi-Jin Kim*, Wan Lee*, Eun-Ju Park,
and Seung-Yoon Park
Department of Biochemistry, Dongguk University School of Medicine, Gyeongju, Korea
*Mi-Jin Kim and Wan Lee contributed equally to this work.
Received: 3 October 2011 Accepted: 26 January 2012 Address for Correspondence:
Seung-Yoon Park, MD
Department of Biochemistry, Dongguk University School of Medicine, 87 Dongdae-ro, Gyeongju 780-714, Korea Tel: +82.54-770-2421, Fax: +82.54-770-2447 E-mail: psyoon@dongguk.ac.kr
This study was supported by the Basic Science Research Program through the National Research Foundation of Korea (NRF) funded by the Ministry of Education, Science and Technology (2011- 0016102) and by a grant from 21C Frontier Functional Proteomics Project from Ministry of Education, Science and Technology (M108KM010008-08K1301-00810).
http://dx.doi.org/10.3346/jkms.2012.27.5.465 • J Korean Med Sci 2012; 27: 465-470
INTRODUCTION
C1qTNF-related protein 6 (CTRP6) was initially identified as a member of adiponectin paralogs (1). It consists of an N-termi- nal signal peptide, a collagen repeat, and a C-terminal globular domain, and it is widely expressed in many tissues. We previ- ously demonstrated that CTRP6 is involved in fatty acid metab- olism in muscle cells by activating AMP-activated protein kinase (AMPK) (2). Recently, we showed that CTRP6 and its globular domain induce IL-10 expression in macrophages (3). However, the regulatory mechanism of CTRP6 expression remains largely unknown.
Mitochondrial dysfunction has been implicated in several metabolic diseases, such as obesity, hyperlipidemia, and diabe- tes (4). We previously showed that depletion of mtDNA in mus- cle cells decreases the expression of insulin receptor substrate-1 (IRS-1), thereby causing impaired glucose utilization and insu- lin resistance (5). Mitochondria-to-nucleus stress signaling re- sults in a variety of changes in nuclear gene expression (6-8). A recent study observed that CTRP6 expression is increased in adipose tissue of 8-week-old and 12-week-old ob/ob mice (1).
The activity of mitochondrial respiratory chain complexes in ob/ob mice is between 30% to 50% lower compared to that in
wild-type animals (9). Our recent study showed that mtDNA depletion increases the expression of C1qTNF-related protein 5 (CTRP5) gene (10), which shares structural and functional prop- erties with CTRP6. Thus, we investigated the change in CTRP6 expression in response to mtDNA depletion. In this study, we provide evidence that depletion of mtDNA up-regulated CTRP6 expression via an increase in mRNA stability.
MATERIALS AND METHODS Reagents and antibodies
Polyclonal anti-CTRP6 antibody was purchased from Abcam (Cambridge, MA, USA). Polyclonal anti-actin antibody was ob- tained from Sigma (St. Louis, MO, USA). Horseradish peroxidase (HRP)-conjugated anti-mouse IgG and anti-rabbit IgG were ob- tained from Santa Cruz Biotechnology (Santa Cruz, CA, USA).
Oligonucleotide primers were purchased from Bionics (Seoul, Korea). Sodium pyruvate, uridine, and actinomycin D were ob- tained from Sigma.
Cell culture
C2C12 cells were maintained in DMEM (high glucose) medium supplemented with 10% (v/v) fetal bovine serum (FBS, Invitro-
gen, Carlsbad, CA, USA) and appropriate antibiotics. Depletion of mtDNA was induced by treatment with ethidium bromide (EtBr, 0.2 μg/mL) for 2-3 weeks. EtBr-treated C2C12 cells were grown in the presence of 1 mM sodium pyruvate and 50 μg/mL uridine, which have been shown to be essential for the growth of cells lacking mtDNA (11). Control C2C12 cells were maintained for the same time period under normal culture conditions. Re- moval of EtBr from the medium restored the mtDNA content to a level similar to that of control C2C12 cells within 4 weeks.
Genomic DNA extraction and polymerase chain reaction (PCR)
Total genomic DNA was isolated from control, mtDNA-depleted, and reverted C2C12 cells using a DNeasy Tissue kit in accor- dance with the manufacturer’s instructions (Qiagen, Valencia, CA, USA). The amplification of mtDNA was performed under the following conditions: 94°C for 2 min (initial denaturation);
94°C for 30 sec, 55°C for 30 sec, 72°C for 30 sec (25 cycles for COX- III and GAPDH; 30 cycles for COX-I and COX-IV); and 72°C for 10 min (final extension). The primers used in this study are shown in Table 1.
RNA extraction, RT-PCR, and quantitative real-time PCR Total RNA was extracted from control, mtDNA-depleted, and reverted C2C12 cells using Trizol reagent in accordance with the manufacturer’s instructions (Invitrogen). The reverse transcrip- tion reaction was performed using M-MLV reverse transcriptase according to the manufacturer’s instructions (Promega, Madi- son, WI, USA). The amplification of CTRP6 was performed un- der the following conditions: 94°C for 2 min (initial denatur- ation); 94°C for 30 sec, 55°C for 30 sec, 72°C for 45 sec (30 cycles for CTRP6; 25 cycles for β-actin); and 72°C for 10 min (final ex- tension). The primers used in this study are shown in Table 1.
For real-time PCR, the resulting cDNA was diluted 2.5-fold and used to amplify CTRP6 or β-actin as a control. Real-time PCR am- plification was carried out using SYBR green master mix (Roche
Applied Science) in a LightCycler 480 (Roche Applied Science, Mannheim, Germany) as follows: initial denaturation at 95°C for 5 min; 45 cycles of amplification with denaturation at 95°C for 30 sec, annealing at 58°C for 30 sec, and extension at 72°C for 30 sec; 1 cycle of melting curves at 95°C for 5 sec, 65°C for 1 min, and 97°C continuous; and a final cooling step at 40°C for 30 sec.
The comparative cycle threshold (CT) method was used to ana- lyze the data by generating relative values of the amount of tar- get cDNA as previously described (5).
Measurement of cellular ATP levels
Cellular ATP levels were measured using a Somatic cell ATP as- say kit (Sigma, St. Louis, MO, USA) as previously described (12).
Briefly, cells were lysed with an ATP releasing solution (Sigma), and the lysates were assayed for luciferase activity in accordance with the manufacturer’s instructions (Sigma). ATP-dependent formation of light was measured in a Luminometer (Berthold Technologies, Bad Wildbad, Germany) with appropriate ATP standards.
Western blotting
Equal amounts (20 μg) of total cell lysates were subjected to SDS- PAGE on 10% resolving gels as previously described (13). Sepa- rated proteins were electrophoretically transferred to a nitrocel- lulose membrane (Bio-Rad, Philadelphia, PA, USA). The mem- brane was blocked with 5% skim milk in Tris-buffered saline (TBS), followed by incubation with anti-CTRP6 or anti-actin antibody overnight at 4°C. After washing with TTBS (TBS with 0.1% Tween 20), the membrane was incubated with HRP-con- jugated anti-mouse or anti-rabbit IgG for 1 hr at room tempera- ture. Blots were developed using an enhanced chemilumines- cence (ECL) kit (Amersham, Buckinghamshire, UK).
Dual luciferase reporter assay
The mouse CTRP6 promoter region (pCTRP6-1064/+126) was amplified from genomic DNA of C2C12 cells by PCR using the following primers: forward primer, 5´-AAA AGC TAC CCT CGT TCC ACC CCT AGT C-3´; reverse primer, 5´-AAA ACT CGA GCC TGC GGC CTC AAC GTG AAC-3´. The PCR product was cloned into the NheI-XhoI sites of the pGL3/basic vector (Promega, Madison, WI, USA). Control, mtDNA-depleted, and reverted C2C12 cells in a 6-well plate were cotransfected with pCTRP6- luc vector together with pRL-SV40 for constitutive expression of Renilla luciferase as an internal control. Luciferase activity was measured 48 hr after transfection using a Dual Luciferase assay kit (Promega, Madison, WI, USA). The ratio of firefly luciferase activity to Renilla luciferase activity was presented as fold induc- tion of that observed in control C2C12 cells.
mRNA stability analysis
Control, mtDNA-depleted, and reverted C2C12 cells were incu- Table 1. Primers used for genomic DNA PCR and quantitative real-time PCR
Identity Nucleotide sequences Product size
gDNA mRNA
COX-I Forward: 5´-TAGTAGAAGCAGGAGCAGGAAC-3´
Reverse: 5´-TTAGGTTGCGGTCTGTTAGTAG-3´
297 297
COX-III Forward: 5´-GACCCACCAAACTCATGCAT-3´
Reverse: 5´-ATGTAATTGAAACACCTGATGC-3´ 434 434 COX-IV Forward: 5´-GGAGTGTTGTGAAGAGTGAAG-3´
Reverse: 5´-GCAGTGAAGCCAATGAAGAAC-3´
597 271
CTRP6 Forward: 5´-CAGTATTCCTGCTTCCTCTTG-3´
Reverse: 5´-TACCATTCTTGCCTGGCTTC-3´ N/A 261 GAPDH Forward: 5´-TGCCACCCAGAAGACTGTG-3´
Reverse: 5´-ATGTAGGCCATGAGGTCCAC-3´ 446 446 β-actin Forward: 5´-TCACCCACACTGTGCCCATCTACGA-3´
Reverse: 5´-GGATGCCACAGGATTCCATACCCA-3´
N/A 348
gDNA, genomic DNA; N/A, not applicable.
bated with 12.5 μg/mL actinomycin D to inhibit transcription.
The cells were harvested at six different time points following actinomycin addition, after which total RNA was isolated as de- scribed above. The level of CTRP6 transcript was analyzed by RT-PCR and quantitative real-time PCR.
Statistical analysis
The statistical significance was assessed by the t-test. A P < 0.05 was considered to be statistically significant.
RESULTS
Establishment and characterization of mtDNA-depleted C2C12 cells
To generate partially mtDNA-depleted muscle cell lines, we treated C2C12 cells with EtBr in medium containing pyruvate and uridine, which are known to be essential for the growth of mtDNA-depleted cells (11). The mtDNA content of the EtBr- treated C2C12 cells was measured by amplifying genomic DNA.
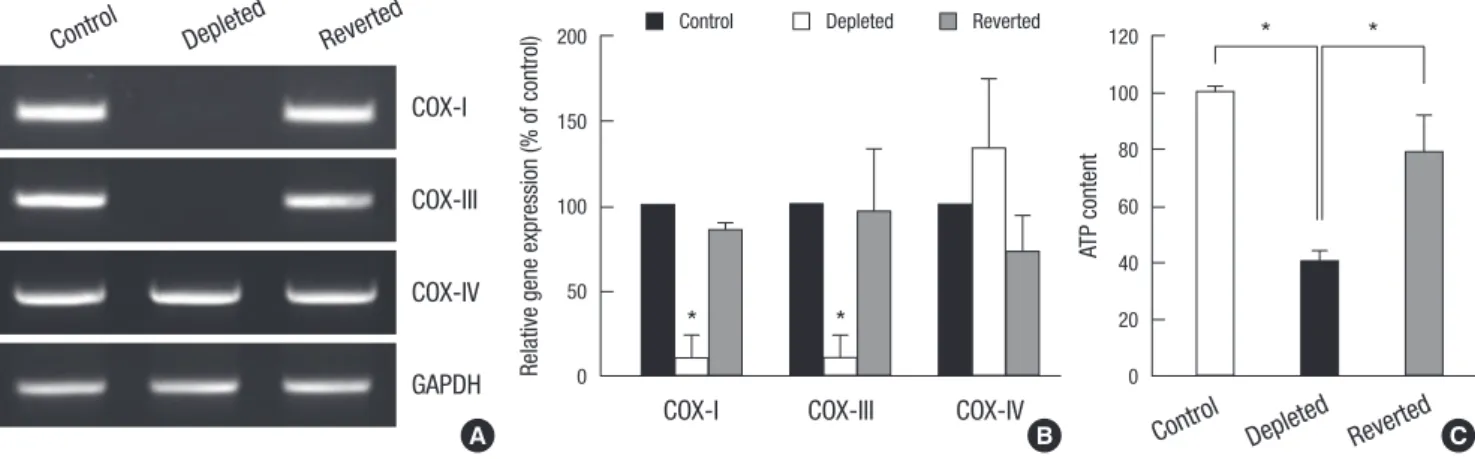
As shown in Fig. 1A, cytochrome oxidase subunits I (COX-I) and III (COX-III), which are encoded only in mtDNA, were rarely am- plified from the genomic DNA of the EtBr-treated C2C12 cells compared to the control C2C12 cells. Removal of EtBr from the culture medium (reverted cells) restored the mtDNA content of the mtDNA-depleted cells to a level similar to that of control C2C12 cells (Fig. 1A). In contrast, nuclear DNA-encoded COX- IV was equally detected in control, mtDNA-depleted, and re- verted cells (Fig. 1A). We next analyzed the differential expres- sion of COX-I, -III, and -IV genes in the control, mtDNA-deplet- ed, and reverted cells using quantitative real-time PCR. As shown in Fig. 1B, the mRNA contents of COX-I and COX-III were sig-
nificantly reduced in the mtDNA-depleted cells, whereas the mRNA content of COX-IV remained unchanged, indicating that mitochondrial mRNA levels correlated with cellular mtDNA con- tents in C2C12 cells. In addition, the mtDNA-depleted C2C12 cells showed a substantial decrease in total cellular ATP com-
Fig. 1. Establishment and characterization of mtDNA-depleted C2C12 cells. (A) Genomic DNA content. Genomic DNA was isolated from control, mtDNA-depleted, and reverted C2C12 cells, and mtDNA-encoded genes, including cytochrome c oxidase subunit I (COX-I) and cytochrome c oxidase subunit III (COX-III), were amplified by PCR. COX-IV was used as a nuclear DNA-encoded control. A representative result of at least three independent experiments is shown. (B) Contents of mRNAs transcribed from mtDNA and nuclear DNA. Total RNA was extracted from control, mtDNA-depleted, and reverted C2C12 cells, and levels of COX-I, COX-III, and COX-IV transcripts were analyzed by quantitative real- time PCR. The mRNA levels were expressed as a percentage of that observed in control C2C12 cells, which were set as 100%. Results are expressed as the means ± SD of three independent experiments. t-test: *P < 0.01 vs control C2C12 cells. (C) Cellular ATP content. Total cellular ATP levels were analyzed using a somatic cell ATP assay kit (Sigma). ATP content was expressed as a percentage of that observed in control C2C12 cells. Results are expressed as the means ± SD of three independent experiments.
t-test: *P < 0.01 vs control C2C12 cells.
Fig. 2. Expression of CTRP6 mRNA and protein in control, mtDNA-depleted, and re- verted C2C12 cells. (A) Total RNA was isolated from control, mtDNA-depleted, and reverted C2C12 cells, and the level of CTRP6 mRNA was analyzed by quantitative re- al-time PCR. The relative values are expressed as a fold increase of that observed in control C2C12 cells. Results are expressed as the means ± SD of three independent experiments. t-test: *P < 0.01 vs control C2C12 cells. (B) Cell lysates were prepared from control, mtDNA-depleted, and reverted C2C12 cells. Equal amounts (20 µg pro- teins) of cell lysates were separated via 10% SDS-PAGE and subjected to immunob- lotting with anti-CTRP6 or anti-actin antibody. A representative result of three inde- pendent experiments is shown.
CTRP6
Actin Control Depleted Reverted
CTRP6 mRNA levels
Control Depleted Reverted
4
3
2
1
0
*
A
B
COX-I Control Depleted Reverted
COX-III
COX-IV
GAPDH
A B C
ATP content
Relative gene expression (% of control) 120
100
80
60
40
20
0 200
150
100
50
0
Control COX-I
Control Depleted Reverted * *
COX-III COX-IV
Depleted Reverted
* *
pared to control and reverted C2C12 cells (Fig. 1C).
CTRP6 in mtDNA-depleted C2C12 cells
It was previously reported that CTRP5 is increased in mtDNA- depleted myocytes and activates AMP-activated protein kinase (AMPK) (10). Recently, we found that CTRP6 is also involved in fatty acid metabolism via AMPK activation (2). To investigate the change in CTRP6 expression in response to mtDNA deple- tion, we measured the expression levels of CTRP6 mRNA in con- trol, mtDNA-depleted, and reverted C2C12 cells using quantita- tive real-time PCR. Expression of CTRP6 mRNA was up-regu- lated in mtDNA-depleted cells by 2.5-fold compared with con- trol C2C12 cells (Fig. 2A). In agreement with the results of the mRNA analysis, the protein expression level of CTRP6 also sig- nificantly increased in mtDNA-depleted C2C12 cells compared to control C2C12 cells (Fig. 2B). Replacement of mtDNA restored
both mRNA and protein expression of CTRP6 to levels resembling those in control C2C12 cells (Fig. 2). These results indicate that mtDNA depletion induced up-regulation of CTRP6 expression.
CTRP6 expression and mRNA stability
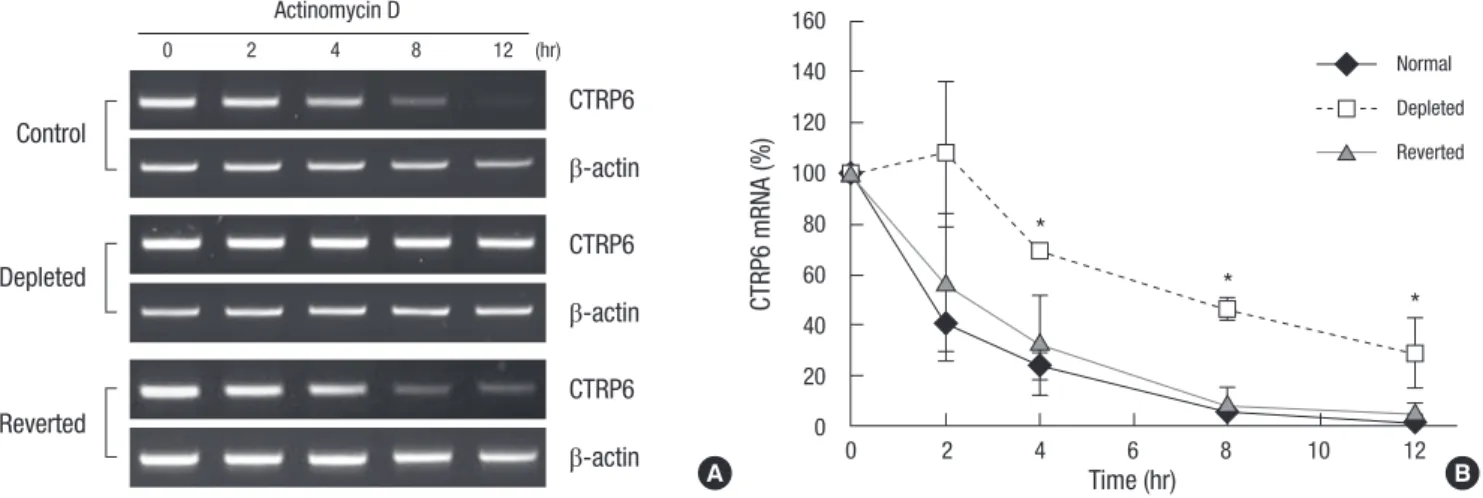
To determine whether or not the increase in CTRP6 mRNA level was due to transcriptional activation, we generated a mouse CTRP6 promoter fragment upstream of the luciferase reporter gene. However, the activity of the mouse CTRP6 promoter was the same among control, mtDNA-depleted, and reverted C2C12 cells (Fig. 3). Since the increase in steady-state CTRP6 mRNA level was evidently not due to transcriptional activation, we in- vestigated whether or not the rate of mRNA decay might change under mtDNA-depleted conditions. To analyze CTRP6 mRNA decay in control, mtDNA-depleted, and reverted C2C12 cells, we treated cells with actinomycin D, a transcription inhibitor, and examined CTRP6 mRNA levels for the indicated times. As shown in Fig. 4A, decay of CTRP6 mRNA was inhibited in mtDNA-de- leted cells compared with control and reverted C2C12 cells. In contrast, the mRNA level of a long-lived message (beta-actin) was unchanged in control, mtDNA-depleted, and reverted cells.
The half-life of CTRP6 mRNA increased from approximately 2 hr in normal C2C12 cells to longer than 8 hr in the mtDNA-deplet- ed C2C12 cells (Fig. 4B). Furthermore, replacement of mtDNA restored CTRP6 mRNA decay to a level similar to that in control C2C12 cells. Thus, up-regulation of CTRP6 mRNA by mtDNA depletion was due to an increase in mRNA stability.
DISCUSSION
Long-term treatment with low dose EtBr specifically inhibits rep- lication and transcription of mtDNA without affecting nuclear DNA replication and transcription (14-16), and it has been a use-
Relative luciferase activities
Control Depleted Repleted
1.5
1.0
0.5
0.0
Fig. 3. Analysis of the mouse CTRP6 promoter activity in control, mtDNA-depleted, and reverted C2C12 cells. Expression of a luciferase reporter gene driven by the mouse CTRP6 promoter was measured after transfection of control, mtDNA-depleted, and reverted C2C12 cells with pCTRP6-luc and pSV40-luc. Luciferase activity was nor- malized to Renilla luciferase activity and shown as a fold increase of that observed in control C2C12 cells, which was set as 1. Results are expressed as the means ± SD of three independent experiments.
B CTRP6
Control
0 2 4 8 12 (hr)
Actinomycin D
Depleted
Reverted
β-actin
CTRP6
β-actin
CTRP6
β-actin A
Fig. 4. Stability of CTRP6 mRNA in control, mtDNA-depleted, and reverted C2C12 cells. (A) Control, mtDNA-depleted, and reverted C2C12 cells were treated with 12.5 µg/mL actinomycin D for the indicated times, followed by extraction and analysis of CTRP6 mRNA via RT-PCR. β-actin was used as an internal control. A representative result of three independent experiments is shown. (B) The levels of CTRP6 mRNA at the indicated time were analyzed by quantitative real-time PCR. The relative levels of CTRP6 mRNA are expressed as a percentage of that observed at time 0, which was set as 100%. Results are expressed as the means ± SD of three independent experiments. t-test: *P < 0.01 vs control C2C12 cells.
CTRP6 mRNA (%)
160 140 120 100 80 60 40 20 0
Time (hr)
0 2 4 6 8 10 12
Normal Depleted Reverted
*
* *
ful tool for the investigation of various cellular changes in re- sponse to mtDNA depletion (12, 17, 18). Mitochondrial dysfunc- tion induces mitochondria-to-nucleus stress signaling, which changes the expression levels of various nuclear-encoded genes (17-19). In the present study, we generated C2C12 cells contain- ing partially depleted mtDNA (less than 80% of control cells) due to EtBr treatment and showed that depletion of mtDNA led to the increased expression of both CTRP6 mRNA and protein. How- ever, the activity of mouse CTRP6 promoter was not increased in mtDNA-depleted cells compared to control cells. In contrast, depletion of mtDNA increased the promoter activity of CTRP5 gene (unpublished results), which is known to increase its ex- pression in mtDNA-depleted cells (10) and share structural and functional properties with CTRP6. This finding indicates that depletion of mtDNA up-regulated CTRP5 and CTRP6 expres- sion via different mechanisms. Previous studies have reported that mitochondrial dysfunction can modulate gene expression via an increase in mRNA stability (20, 21). In this study, we found that up-regulation of CTRP6 gene in mtDNA-depleted cells was due to an increase in mRNA stability. Our recent study showed that the induction of micro RNA by mitochondrial dysfunction regulates IRS-1 expression at the translational level (22). Thus, it is possible that translational regulation is also involved in the up-regulation of CTRP6 in mtDNA-depleted cells. Further stud- ies are needed to elucidate whether or not CTRP6 expression is regulated at the translational level under mtDNA-depleted con- ditions.
AMP-activated protein kinase (AMPK) plays an important role in maintaining energy balance in the cells and contributes to protect the body from metabolic diseases such as type 2 diabe- tes and obesity (23). High plasma fatty acid concentrations in- terfere with insulin-stimulated glucose transport and are close- ly associated with insulin-resistant states including obesity and type 2 diabetes (24). Adiponectin improves insulin sensitivity on skeletal muscle by activating AMPK (25, 26). Recently, we demonstrated that CTRP6 is involved in fatty acid metabolism in muscle cells via activation of AMP-activated protein kinase (AMPK), similar to adiponectin function (2). This finding sug- gests the therapeutic potential of CTRP6 as a metabolic regula- tor in metabolic diseases such as diabetes and obesity. Although both adiponectin and CTRP6 stimulate fatty acid oxidation via AMPK activation, the serum level of CTRP6 is significantly in- creased in adiponectin-null mice (1). In agreement with this find- ing, CTRP6 expression in adipose tissue is increased in 12-week- old ob/ob mice, which express lower levels of adiponectin than control mice (1). It was reported that deletion of mtDNA induc- es the AMPK energy stress pathway (27). Oxidation of both pal- mitic and lignoceric acids is significantly increased in the liver of ob/ob mice with low mitochondrial respiratory chain activity (9). However, impartment of mitochondrial function decreases adiponectin synthesis (28). In this study, we observed that CTRP6
expression was increased by depletion of mtDNA. Thus, it is pos- sible that CTRP6 plays a role in compensating for the decrease in adiponectin expression under mitochondrial dysfunction.
In summary, the results in the present study show that deple- tion of mtDNA increases CTRP6 gene expression in C2C12 cells.
Furthermore, it is demonstrated that increased CTRP6 expres- sion in mtDNA-depleted cells can be attributed to an increase in mRNA stability. Considering that CTRP6 is involved in fatty acid metabolism, our identification helps elucidate the molec- ular mechanism for the control of energy homeostasis in mtD- NA-depleted cells.
REFERENCES
1. Wong GW, Krawczyk SA, Kitidis-Mitrokostas C, Revett T, Gimeno R, Lodish HF. Molecular, biochemical and functional characterizations of C1q/TNF family members: adipose tissue-selective expression patterns, regulation by PPAR-gamma agonist, Cys-mediated oligomerizations, combinatorial associations and metabolic functions. Biochem J 2008;
416: 161-77.
2. Lee W, Kim MJ, Park EJ, Choi YJ, Park SY. C1qTNF-related protein-6 me- diates fatty acid oxidation via the activation of the AMP-activated pro- tein kinase. FEBS Lett 2010; 584: 968-72.
3. Kim MJ, Lee W, Park EJ, Park SY. C1qTNF-related protein-6 increases the expression of interleukin-10 in macrophages. Mol Cells 2010; 30: 59-64.
4. Wallace DC. A mitochondrial paradigm of metabolic and degenerative diseases, aging, and cancer: a dawn for evolutionary medicine. Annu Rev Genet 2005; 39: 359-407.
5. Park SY, Choi GH, Choi HI, Ryu J, Jung CY, Lee W. Depletion of mitochon- drial DNA causes impaired glucose utilization and insulin resistance in L6 GLUT4myc myocytes. J Biol Chem 2005; 280: 9855-64.
6. Epstein CB, Waddle JA, Hale W 4th, Davé V, Thornton J, Macatee TL, Garner HR, Butow RA. Genome-wide responses to mitochondrial dys- function. Mol Biol Cell 2001; 12: 297-308.
7. Biswas G, Anandatheerthavarada HK, Zaidi M, Avadhani NG. Mitochon- dria to nucleus stress signaling: a distinctive mechanism of NFkappaB/
Rel activation through calcineurin-mediated inactivation of IkappaB- beta. J Cell Biol 2003; 161: 507-19.
8. Biswas G, Guha M, Avadhani NG. Mitochondria-to-nucleus stress signal- ing in mammalian cells: nature of nuclear gene targets, transcription reg- ulation, and induced resistance to apoptosis. Gene 2005; 354: 132-9.
9. Garcia-Ruiz I, Rodriguez-Juan C, Diaz-Sanjuan T, del Hoyo P, Colina F, Muñoz-Yagüe T, Solís-Herruzo JA. Uric acid and anti-TNF antibody im- prove mitochondrial dysfunction in ob/ob mice. Hepatology 2006; 44:
581-91.
10. Park SY, Choi JH, Ryu HS, Pak YK, Park KS, Lee HK, Lee W. C1q tumor necrosis factor alpha-related protein isoform 5 is increased in mitochon- drial DNA-depleted myocytes and activates AMP-activated protein kinase.
J Biol Chem 2009; 284: 27780-9.
11. King MP, Attardi G. Human cells lacking mtDNA: repopulation with ex- ogenous mitochondria by complementation. Science 1989; 246: 500-3.
12. Biswas G, Adebanjo OA, Freedman BD, Anandatheerthavarada HK, Vijayasarathy C, Zaidi M, Kotlikoff M, Avadhani NG. Retrograde Ca2+
signaling in C2C12 skeletal myocytes in response to mitochondrial genet-
ic and metabolic stress: a novel mode of inter-organelle crosstalk. EMBO J 1999; 18: 522-33.
13. Park SY, Ryu J, Lee W. O-GlcNAc modification on IRS-1 and Akt2 by PUGNAc inhibits their phosphorylation and induces insulin resistance in rat primary adipocytes. Exp Mol Med 2005; 37: 220-9.
14. Desjardins P, Frost E, Morais R. Ethidium bromide-induced loss of mito- chondrial DNA from primary chicken embryo fibroblasts. Mol Cell Biol 1985; 5: 1163-9.
15. Zylber E, Vesco C, Penman S. Selective inhibition of the synthesis of mi- tochondria-associated RNA by ethidium bromide. J Mol Biol 1969; 44:
195-204.
16. Hayakawa T, Noda M, Yasuda K, Yorifuji H, Taniguchi S, Miwa I, Sakura H, Terauchi Y, Hayashi J, Sharp GW, et al. Ethidium bromide-induced inhibition of mitochondrial gene transcription suppresses glucose-stim- ulated insulin release in the mouse pancreatic beta-cell line betaHC9. J Biol Chem 1998; 273: 20300-7.
17. Amuthan G, Biswas G, Ananadatheerthavarada HK, Vijayasarathy C, Shephard HM, Avadhani NG. Mitochondrial stress-induced calcium sig- naling, phenotypic changes and invasive behavior in human lung carci- noma A549 cells. Oncogene 2002; 21: 7839-49.
18. Amuthan G, Biswas G, Zhang SY, Klein-Szanto A, Vijayasarathy C, Avad- hani NG. Mitochondria-to-nucleus stress signaling induces phenotypic changes, tumor progression and cell invasion. EMBO J 2001; 20: 1910-20.
19. Park SY, Lee S, Park KS, Lee HK, Lee W. Proteomic analysis of cellular change involved in mitochondria-to-nucleus communication in L6 GLUT4myc myocytes. Proteomics 2006; 6: 1210-22.
20. Choi HS, Carman GM. Respiratory deficiency mediates the regulation of CHO1-encoded phosphatidylserine synthase by mRNA stability in Sac-
charomyces cerevisiae. J Biol Chem 2007; 282: 31217-27.
21. Lee W, Choi HI, Kim MJ, Park SY. Depletion of mitochondrial DNA up- regulates the expression of MDR1 gene via an increase in mRNA stabili- ty. Exp Mol Med 2008; 40: 109-17.
22. Ryu HS, Park SY, Ma D, Zhang J, Lee W. The induction of microRNA tar- geting IRS-1 is involved in the development of insulin resistance under conditions of mitochondrial dysfunction in hepatocytes. PLoS One 2011;
6: e17343.
23. Carling D. The AMP-activated protein kinase cascade: a unifying system for energy control. Trends Biochem Sci 2004; 29: 18-24.
24. Shulman GI. Cellular mechanisms of insulin resistance. J Clin Invest 2000;
106: 171-6.
25. Tomas E, Tsao TS, Saha AK, Murrey HE, Zhang Cc C, Itani SI, Lodish HF, Ruderman NB. Enhanced muscle fat oxidation and glucose transport by ACRP30 globular domain: acetyl-CoA carboxylase inhibition and AMP- activated protein kinase activation. Proc Natl Acad Sci U S A 2002; 99:
16309-13.
26. Yamauchi T, Kamon J, Minokoshi Y, Ito Y, Waki H, Uchida S, Yamashita S, Noda M, Kita S, Ueki K, et al. Adiponectin stimulates glucose utilization and fatty-acid oxidation by activating AMP-activated protein kinase.
Nat Med 2002; 8: 1288-95.
27. Prigione A, Cortopassi G. Mitochondrial DNA deletions induce the ade- nosine monophosphate-activated protein kinase energy stress pathway and result in decreased secretion of some proteins. Aging Cell 2007; 6:
619-30.
28. Koh EH, Park JY, Park HS, Jeon MJ, Ryu JW, Kim M, Kim SY, Kim MS, Kim SW, Park IS, et al. Essential role of mitochondrial function in adipo- nectin synthesis in adipocytes. Diabetes 2007; 56: 2973-81.