Study on the Carbonation Properties of Fly Ash Concrete using a Vacuum Instrument
Sang-Hwa Jung1, Sung-Won Yoo2,†, and Seong-Tae Chae1
1Korea Institute of Construction Materials,
1465-4 Seocho 3-Dong Seocho-Gu Seoul, 137-707, Republic of Korea
2Woosuk University, 490 Hujeong-ri Samnye-eup Wanju-gun Jeollabuk-do, 565-701, Republic of Korea
Carbonation is one of the most important factors causing the corrosion of reinforcement concrete. Nevertheless, experimental studies on the concrete carbonation have not been carried out sufficiently because of the slow process of carbonation process. Therefore, this study adopts an experimental system exploiting a vacuum instrument that has been recently developed to accelerate carbonation instead of existing experimental system to conduct rapid carbonation tests on Portland cement and fly-ash cement concretes. Test results revealed that, compared to water-cement ratio of 40%, the carbonation depth increases from 103% to 138% for an increase of water-cement ratio from 45% to 60%. These results are larger than the carbonation depths obtained by mathematical model, and such difference is increasing with larger water-cement ratios. The results also indicated that larger fly-ash contents lead to sharp increase of the carbonation depth, which is in agreement with previous experimental researches. The adoption of the new accelerated carbonation test system enabled to shorten effectively the time required to produce experimental data compared to the existing carbonation test method. The experimental data obtained in this study together with ongoing acquisition of data using the new carbonation test method are expected to contribute in the understanding of the carbonation process of concrete structures in Korea.
Keywords : carbonation, new rapid carbonation experimental system, carbon-dioxide diffusivity, relative humidity
†Corresponding author: [email protected]
1. Introduction
Recently, advanced countries are providing preventive measures against the degradation of durability due to the corrosion of rebar prior to the construction of reinforced concrete structures through design and construction processes. For existing structures, these countries are also exerting tremendous efforts to prevent the degradation of durability by means of safety audit and maintenance (CEB Task Groups, 1997; Clifton, 1989; Clifton, 1991; Duracrete, 2000 Bakker, 1988). In Korea, numerous researches have been and are being recently conducted to investigate the performance loss process of reinforced concrete structures due to salt ingress and carbonation. In 2004, durability specifications were enacted in the concrete standards so as to provide footholds in securing quantitatively the dura- bility of newly built reinforced concrete structures regard to the corrosion of steel rebar as well as freezing-thawing,
chemical erosion and alkali-aggregate reaction (Korean Concrete Institute, 2004). In these specifications, the con- stants of the performance degradation model for the pre- diction of the performance degradation process should be in principle be obtained experimentally but, when the con- stants for salt attack and carbonation cannot be derived experimentally, models are proposed to predict the chlor- ide ion diffusion coefficient or carbonation diffusion co- efficient according to the water-cement ratio. However, in view of the current circumstances, it seems advisable to perform durability design by obtaining the constants of each degradation model through accelerated tests in or- der to secure reliable durability performances of structures regard to salt attack and carbonation.
In concern with the accelerated tests for the prediction of the performance loss process, results for salt attack can be derived by establishing electrical testing methods for the measurement of the chloride ion diffusion coefficient within a short period together with conducting chloride penetration test through immersion test in relatively short
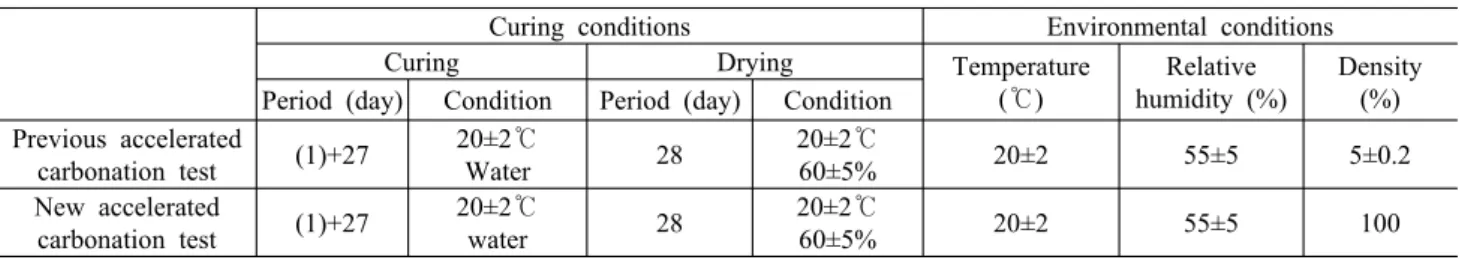
Table 1. Comparison of the experimental conditions of the previous and new accelerated carbonation tests
Curing conditions Environmental conditions
Curing Drying Temperature
(℃)
Relative humidity (%)
Density Period (day) Condition Period (day) Condition (%)
Previous accelerated
carbonation test (1)+27 20±2℃
Water 28 20±2℃
60±5% 20±2 55±5 5±0.2
New accelerated
carbonation test (1)+27 20±2℃
water 28 20±2℃
60±5% 20±2 55±5 100
time. Besides, effective measurement method of the carbon dioxide diffusion coefficient is still inexistent in the case of carbonation. Moreover, very long time is necessary even for the accelerated test of carbonation process, which hard- ens effective verification and application of the carbo- nation prediction model.
Therefore, this paper adopts recently developed carbo- nation acceleration test equipment (Jung S. H., 2003) in order to establish an accelerated carbonation experimental system enabling to secure experimental results for the car- bonation of concrete according to given mix compositions within short period of time. The implementation of such accelerated carbonation experimental system can produce carbonation depths 3 to 5 times deeper than previous accel- erated carbonation test methods within similar test period.
Following, since testing time can be shortened to less than 1/3, more experimental carbonation data can be acquired within a short period of time compared to previous methods. Such property will undoubtedly contribute to the efficient verification of previous carbonation models and to the computation of precise durability lifetime according to carbonation. On the other hand, even if pozzolan as an admixture is reducing the pH of the voids present inside concrete by reacting with the hydration ions produced dur- ing the hydration of Portland cement, it is known that poz- zolan also offsets the reducing part of the corrosion resist- ance of steel rebar in concrete due to the decrease of pH through the densification effect of the void structure of the cement paste. Accordingly, this paper performs carbo- nation tests according to the proportion of fly-ash in order to examine the characteristics related to the carbonation concrete mixed with the widely used fly-ash. The corre- sponding results are used to verify the validity of fly-ash concrete under carbonation environment.
2. High-density accelerated carbonation test device using vacuum instrument
2.1 Theoretical background
The carbonation process of concrete provokes the corro- sion of steel rebar according to the failure of the passive
membrane when carbon dioxide penetrates inside concrete, reacts with the calcium hydroxide present in the cement paste and reduces the pH of concrete until the rebar. The formula giving the carbonation depth xc(m) with respect to the shrinking core model is expressed as follows (Walton, 1990).
( 1 2)
2 c
c
x D C C t
= a − (1)
where t is the age of concrete (s), Dc is the diffusion co- efficient of CO2 (m2/s), (C1-C2) is the difference of density of CO2 between the air and the carbonated face (kg/m3), and a is the quantity of alkali substance (kg/m3).
In Equation (1), the carbonation of concrete is propor- tional to the square of the diffusion coefficient of carbon dioxide, inner and outer density difference of carbon diox- ide and time, and proportional to the square root of the cement paste. Accordingly, comparison with carbonation test performed with density of carbon dioxide ranging be- tween 5 and 20% in the case of previous sensor-type accel- erated carbonation test devices is expected to show that the level of carbonation obtained during the same period will be 2.2 to 4.5 times larger when carbonation test is performed under carbon dioxide density of 100% using a vacuum instrument.
2.2 Characteristics and composition of the accelerated carbonation test device
The carbonation equipment adopted in this study ex- hibits curing process, temperature and relative humidity identical to previous accelerated carbonation test methods as shown in Table 1. The difference resides in the carbon dioxide density of 100%, which is significantly larger than the previous 5 to 20%, so as to accelerate carbonation.
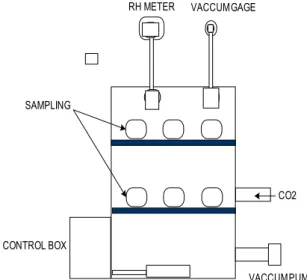
In addition, CO2 is injected inside the vacuum instrument, as illustrated in Fig. 1, to produce large atmospheric pressure. Thereafter, using the temperature and humidity control device, the boundary conditions can be adjusted.
The accelerated carbonation test equipment manufactured in this study is depicted in Fig. 2.
Table 3. Mix proportion of concrete including fly-ash Mix
type
W/B (%)
S/a (%)
FA content (C×%)
Unit weight (kg/m3)
C FA W S G Ad.
wc40f0 40
45 0
423 0 169 762 935 2.961
wc45f0 45 376 0 169 780 957 2.632
wc50f0 50 338 0 169 794 975 2.366
wc60f0 60 282 0 169 815 1000 1.974
wc50f10
50 45
10 304 34 169 788 967 2.366
wc50f20 20 270 68 169 782 959 2.366
wc50f30 30 237 101 169 775 951 2.366
wc50f50 50 169 169 169 763 936 2.366
C: Cement, FA: Fly ash, W: Water, S: sand, G: Goarse, Ad.: Admixture RH METER VACCUM GAGE
VACCUM PUMP CO2
CONTROL BOX SAMPLING
Fig. 1. Setup of the accelerated carbonation equipment
Fig. 2. Accelerated carbonation equipment
2.3 Experimental process of accelerated carbonation The experimental process according to the accelerated carbonation experimental system developed in this study is as follows:
(1) Manufacture of φ10×20 cm specimen.
(2) After 28 days of water curing, installation of the specimen in constant temperature and humidity chamber until humidity inside the specimen reaches the target value.
(3) Cutting of the specimen with target relative humidity of 55% into pieces with adequate length. After polishing, coating of 3 faces with epoxy for one-directional pene- tration of CO2.
(4) Emptying of the container of the equipment using a vacuum pump and injection of CO2 using an inhalation valve until atmospheric pressure.
(5) After execution of carbonation, splitting of the speci- men and spraying of 1% phenolphthalein solution.
Thereafter, measurement of carbonation depth using a ver- nier caliper.
3. experimental Summary
3.1 Test schedule and mix composition
Tables 2 and 3 summarize the test schedule and mix composition adopted in this study. The test variables were the water-cement ratio (W/B) and the proportion of fly-ash (FA) for W/B of 50%. Experiments were conducted with W/B of 40, 45, 50 and 60%, and FA varying as 10, 20, 30 and 50%. The mix proportion was set with slump flow of 12 cm, and target air content of 4.5±1.5%.
Table 2. Experimental conditions and test variables Conditions W/B (%) S/a (%) Replacement ratio of FA (%)
Variables 40, 45, 50, 60 45 0, 10, 20, 30, 50
Table 4. Physical and chemical properties of cement
Chemical composition (%) Physical properties
SiO2 Al2O3 Fe2O3 CaO MgO Na2O K2O SO3 Ig.loss Total Density (g/cm3)
Blaine (cm2/g)
Stability (%)
Compressive Strength (Mpa)
3 days 7 days 28 days 21.92 5.97 3.34 62.72 2.26 0.13 0.81 2.28 0.57 100 3.15 3408 0.05 24.8 33.2 41.5
Table 5. Physical and chemical properties of fly-ash
Chemical composition (%) Physical properties
SiO2 Al2O3 Fe2O3 CaO MgO Na2O SO3 Ig. loss Density (g/cm3) Blaine (cm2/g) Particle size (mm)
53.7 24.9 4.63 2.15 0.80 1.01 0.4 4.7 2.19 4085 4.1×10⁻²
Table 6. Physical properties of aggregates
Items FM Specific gravity Absorption (%) Unit weight (kg/l)
Fine 2.91 2.62 1.00 1.590
Coarse 6.89 2.63 0.84 1.581
Type Color Main
ingredient
Solid (%)
Specific gravity AE reducing
agent
Dark
brown Naphthalene 33 1.15±0.05 3.2 Materials
The materials used in this study are domestic Portland cement (density 3.15 g/cm3, blaine 3,408 cm2/g), river sand of the city of Namweon in Jeonnam Province (density 2.63 g/cm3, FM 2.91) as fine aggregates, crushed coarse ag- gregates of the city of Namweon in Jeonnam Province (maximum grade 25 mm, density 2.63 g/cm3, FM 6.89) as coarse aggregates, and domestic fly-ash (density 2.19 g/cm3, blaine 3,408 cm2/g) was also used. Details concern- ing these materials are arranged in Tables 4 to 6. Table 7 presents the items related to the naphthalene-type high-performance AE agent used to secure the prescribed fluidity and air content of concrete.
0 10 20 30 40 50 60 70 80 90 100
0.1 1 10 100
Coarse Sand
Persent of passing by weight (%)
Open of sieve (mm)
Fig. 3. Grade curve of aggregates Table 7. Characteristics of admixtures
3.3 Predictive model of carbonation depth
Papadakis et al. modeled mathematically the solubility and process by which the constituents of the cement paste like carbon dioxide and carbon monoxide react physi- cally-chemically as well as the diffusion of carbon dioxide through the pores of concrete so as to propose a rational theoretical model for the carbonation of concrete. Even if this model was formulated as a nonlinear differential equation with respect to time and space, a simplified 1-or- der predictive formula of the carbonation depth was sug- gested as follows with several assumptions (Papadakis, 1991).
2 0
, 2
0 0 0 0
2 3 2
2 [ ]
[ ( ) ] 3[ ] 3[ ] 2[ ]
c e CO c
D CO
x t
Ca OH CSH C S C S
= + + (2)
where [X]0 stands for the initial density of each substance, and De corresponds to the effective diffusion coefficient of CO2, which can be expressed as follows according to relevant domestic and foreign researches (Papadakis et al., 1991; Oh et al., 2003).
Equation (3) is the empirical predictive formula of the diffusion coefficient of carbon dioxide proposed in 2003 by Chung et al. Equation (4) is the empirical formula pro- posed in 1991 by Papadakis et al. based on mortar.
2
0.1 0.6
7 2
, 1.581 10 1
e CO p 100
D a
c ε φ
− ⎛ ⎞ ⎛ ⎞
= × ⎜ ⎟⎝ ⎠ ⎜⎝ − ⎟⎠ (3)
2
2.2 6 1.8
, 1.64 10 1
e CO p 100
D = × −ε ⎛⎜⎝ −RH⎞⎟⎠ (4)
In Equations (3) and (4), εp(t) is the porosity of hardened cement paste, RH is the relative humidity and a/c is the aggregate-cement ratio.
As can be seen in Equations (1), (2), (3) and (4), even if the carbonation model proposed by Papadakis exhibits relationship similar to that of the shrinking core model, the model expresses explicitly the available quantity of substances and formulates the diffusion coefficient as function of the porosity and relative humidity. Therefore, this model is capable to consider external factors and the composition of concrete influencing the speed of diffusion apart form factors related to the constraint level of carbonation.
4. Test results and analysis
4.1 Characteristics of compressive strength
Compressive strength test of concrete was conducted
15.0 16.0 17.0 18.0 19.0 20.0 21.0 22.0
35 40 45 50 55 60 65
W/C (%)
Compressive Strength (MPa)
(a) Variation of compressive strength with respect to W/C ratio
15.0 20.0 25.0 30.0
0 10 20 30 40 50 60
Fly Ash Contents (%)
Compressive Strength (MPa)
(b) Variation of compressive strength with respect to FA admixing ratio Fig. 4. Compressive strength
with respect to the specifications of the compressive strength test of KS F 2405. Fig. 4 plots the compressive strength test results. Fig. 4(a) presents the compressive strength resulting for varying W/C ratio in the case where FA is not admixed, and Fig. 4(b) corresponds to the com- pressive strength according to the admixing ratio of FA in the case of W/C of 50%. Particularly, Fig. 4(b) reveals that the compressive strength at 28 days for admixing ratio of FA up to 30% increased compared to admixing ratio of 0%, but reduced significantly for admixing ratio of 50%.
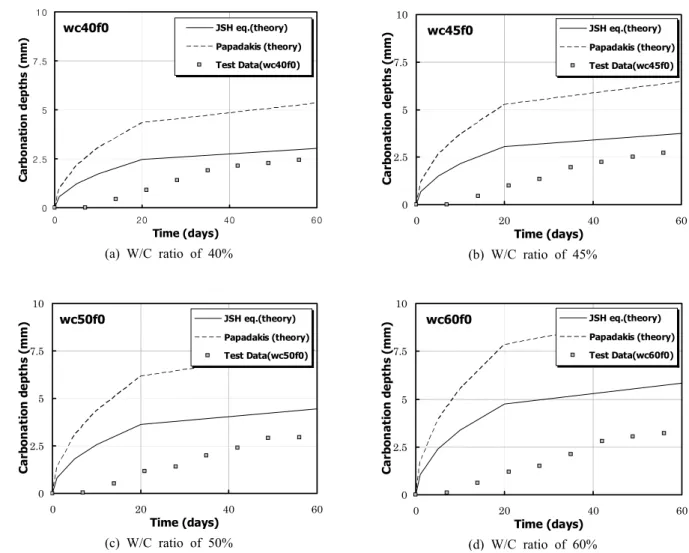
4.2 Carbonation depth according to W/C ratio Fig. 5 plots the results of the accelerated carbonation test performed on ordinary Portland cement concrete with different W/C ratios in a graph presenting the carbonation depth with respect to time. Fig. 8 compares these results with the carbonation depths predicted by the predictive models introduced in Section 3.3.
In view of Fig. 5, comparison of the carbonation depth at the same time with W/C ratio of 40% shows an increase of about 103 to 110% for W/C ratio 45%, 105 to 127%
for W/C ratio of 50%, and 110 to 138% for W/C ratio of 60%. Besides, Fig. 8 compares, with respect to time, the carbonation depths obtained experimentally and by the prediction model expressed in Equation (2) using the val- ues derived from Equation (3). Comparison reveals that the results obtained using the prediction formula of the carbon dioxide diffusion coefficient proposed by Chung et al. are closer to the experimental values than those com- puted using the formula of Papadakis et al. This difference can be explained by the fact that Papadakis et al. derived their empirical formula essentially from tests on mortar, which is likely to degrade the adequacy of the formula when applied on concrete. In addition, comparison of Figs.
Normal Cement
0 2 .5 5 7 .5 1 0
0 2 0 4 0 6 0
Time (days)
Carbonation depths (mm)
wc40f0 wc45f0 wc50f0 wc60f0
Fig. 5. Carbonation depth of ordinary Portland cement concrete with respect to time (density of CO2 100%, relative humidity 55%, temperature 20℃)
wc40f0
0 2.5 5 7.5 10
0 20 40 60
Time (days)
Carbonation depths (mm) JSH eq.(theory) Papadakis (theory) Test Data(wc40f0)
(a) W/C ratio of 40%
wc45f0
0 2.5 5 7.5 10
0 20 40 60
Time (days)
Carbonation depths (mm) JSH eq.(theory) Papadakis (theory) Test Data(wc45f0)
(b) W/C ratio of 45%
wc50f0
0 2.5 5 7.5 10
0 20 40 60
Time (days)
Carbonation depths (mm) JSH eq.(theory) Papadakis (theory) Test Data(wc50f0)
(c) W/C ratio of 50%
wc60f0
0 2.5 5 7.5 10
0 20 40 60
Time (days)
Carbonation depths (mm) JSH eq.(theory) Papadakis (theory) Test Data(wc60f0)
(d) W/C ratio of 60%
Fig. 6. Comparison of experimental and predicted carbonation depths
6(a) to (d) indicates increasing difference between ex- perimental and predicted carbonation depths with larger W/C ratios. Concretely, comparison of the experimental data with the predicted values at 56 days shows that ex- perimental results are reaching about 81%, 72%, 66% and 55% of the predictions for W/C ratios of 40%, 45%, 50%
and 60%, respectively. This can be explained by the fact that the effect of the porosity change of the cement paste with respect to the W/C ratio is overestimated in the dif- fusion coefficient model of carbon dioxide.
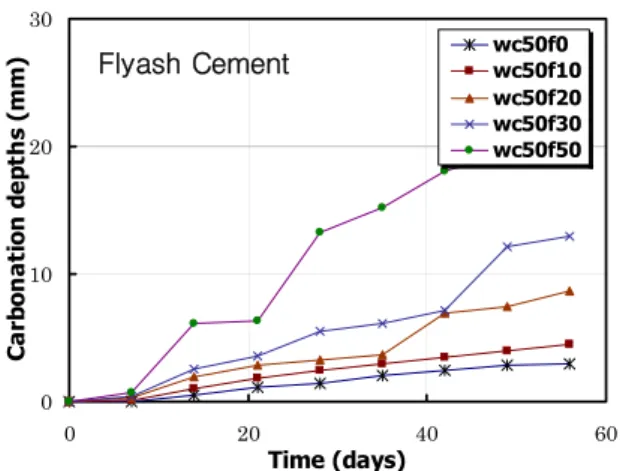
4.3 Carbonation depth according to fly-ash content Fig. 7 shows the experimental carbonation depth with respect to varying admixing ratios of FA in the case of W/C ratio of 50%. It can be seen that, compared to the case without FA, the carbonation depth is increasing by 1.5 times, 2 to 3 times, 2 to 4 times for admixing ratio of FA of 10%, 20% and 30%, respectively, and 5 to 8 times for admixing ratio of 50%. According to the research
of Malhotra et al., when pozzolan material like fly-ash is admixed, carbonation tends to be generally accelerated due to the consumption of calcium hydroxide (Ca(OH)2) through the pozzolan reaction. The so-generated sub- stances result in denser structure of the pores, which im- pedes the penetration of external carbon dioxides. Follo- wing, it has been reported that the admixing of pozzolan materials is giving poor effect on the carbonation.
However, Papadakis et al. found out that carbonation is accelerated for the 2 following aspects when cement is partially replaced by pozzolan. First, since the volume of substances generated through pozzolan reaction is smaller than that of hydration substances produced by the same weight of cement, the porosity inside the cement paste admixed with pozzolan is larger than without pozzolan.
Second, according to Equation (2), calcium hydroxide (Ca(OH)2) and calcium silicate hydration substances (C-S-H) are diminishing when a specified quantity is re- placed by pozzolan, which increases the carbonation depth
Flyash Cement
0 10 20 30
0 20 40 60
Time (days)
Carbonation depths (mm) wc50f0wc50f10 wc50f20 wc50f30 wc50f50
Fig. 7. Carbonation depth of fly-ash cement concrete with respect to time (density of CO2 100%, relative humidity 55%, temperature 20℃)
within identical period of time. The experimental results obtained in this study through the new accelerated carbo- nation test method are seen to exhibit similar trends than those of Papadakis et al. Especially, the rapid increase of the carbonation depth for 50% of fly-ash is advocating the smaller volume of substances generated by the pozzo- lan reaction compared to that generated by the hydration of cement.
5. Conclusions
In order to analyze the carbonation properties of con- crete within short period of time, this study developed an accelerated carbonation testing device using vacuum instrument. Using this device, the properties of the carbo- nation of concrete have been analyzed regard to varying water-cement ratio and admixing ratio of fly-ash. The cor- responding results are summarized hereafter.
(1) Requirement is for accelerated carbonation test to conduct process in which the temperature and humidity inside the vacuum are maintained constant together with constant relative humidity inside the specimens. To that goal, this study performed pre-processing of the specimens in constant temperature and humidity chamber under a tar- get relative humidity until leaching.
(2) Compared with W/C ratio of 40%, increase of the
carbonation depth by 103 to 139% has been observed in the specimens with W/C ratio increased up to 60%. In addition, the theoretical carbonation depth derived from predictive model was seen to be larger than the ex- perimentally obtained carbonation depth at the whole.
Such difference was explained by the decrease of the car- bonation depth with smaller W/C ratio, which reached about 80% of the experimental values for W/C ratio of 40%.
(3) The carbonation depth was seen to increase rapidly with larger quantities of fly-ash. Such result can be ex- plained by smaller quantities of alkali substances following the increase of the porosity when pozzolan material is ad- mixed, which verifies the research of Papadakis et al. sug- gesting that carbonation increases compared to the use of fly-ash only.
References
1. S. H. Jung, Diffusivity of carbon dioxide and carbonation in concrete through development of gas diffusion measur- ing system, Thesis(doctoral), Seoul National University, 2003.
2. Concrete Standards–Durability Specifications. Korea Concrete Institute, 2004.
3. R.F.M. Bakker, Corrosion of steel in concrete. Report of the Technical Committee 60-CSC, RILEM, p.22, London, 1988.
4. CEB Task Groups, New approach to durability design.
CEB Bulletin d’Information No. 238, 1997.
5. J.R. Clifton and L.I. Knab, Service life of concrete, NISTIR 89-4086, National Bureau of Standards U.S.
Department of Commerce, p.29, 1989.
6. J. R. Clifton, Predicting the remaining service life of concrete. NISTIR 4712, National Bureau of Standards U.S. Department of Commerce, 1991.
7. DuraCrete Probabilistic Performance based Durability Design of Concrete Structures, Report. Duracrete, 2000.
8. V.G. Papadakis, C.G. Vayenas, and M.N. Fardis, J. of ACI Material, 186 (1991).
9. V.G. Papadakis, C.G. Vayenas, and M.N. Fardis, AIChE, 35, 1639 (1989).
10. J.C. Walton, L.E. Plansky, and R.W. Smith, Models for estimation of service life of concrete barriers in low level radioactive waste disposal. U. S. Department of Energy, p.23, 1990.