Abstract
재료 1.
동물 1)
약재 2)
방법 2.
전탕 추출 1)
산화동물 모델에의 효과 측정
2) 抗酸化
Table 1. The Compositions of
Nocyongdaebo-tang
통계처리 3)
몸무게 변화 1.
2. Liver index
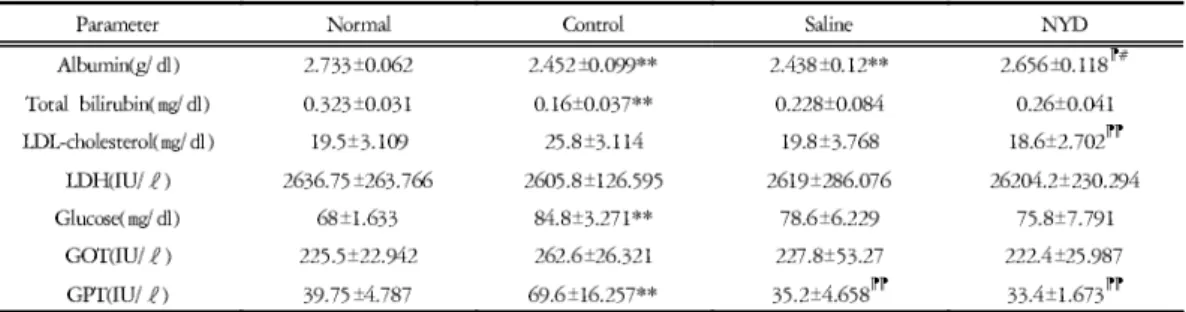
분석 3. Blood chemistry
1) Albumin
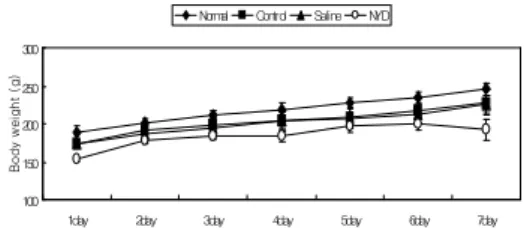
Fig. 1. Effect of Treatment with
Nocyongdaebo-tang
(NYD) on Body Weight of Oxidized Rats.Values Represent the Means ± SEM of 10 Mice.
100 150 200 250 300
1day 2day 3day 4day 5day 6day 7day
Body weight (g)
Normal Control Saline NYD
Fig. 2. Effect of Treatment with
Nocyongdaebo-tang
(NYD) on Liver Index of Oxidized Rats.Values Represent the Means ± SEM of 10 Mice.
3 3.5 4 4.5 5 5.5
Normal Control Saline NYD
Rate of liver (%)
2) Total bilirubin
3) LDL-Cholesterol
4) LDH
5) Glucose Fig. 3. Effect of Treatment with
Nocyongdaebo-tang
(NYD)Decoction on Serum Albumin Level of Oxidized Rat.
Values Represent the Means ± SEM of 5 Mice.
**:p<0.01, *: P<0.05 by ANOVA test.
Fig. 4. Effect of Treatment with
Nocyongdaebo-tang
(NYD) Decoction on Serum Total Bilirubin Level of Oxidized Rat.Values Represent the Means ± SEM of 5 Mice.
**:p<0.01 by ANOVA test.
Fig. 5. Effect of Treatment with
Nocyongdaebo-tang
(NYD) Decoction on Serum LDL-cholesterol of Oxidized Rat.Values Represent the Means ± SEM of 5 Mice.
**:p<0.01 by ANOVA test.
Table 2. Effect of Treatment with
Nocyongdaebo-tang
(NYD) on Serum Level. The Animals were Anesthetized with Ethyl Ether and the Blood Samples were Taken from the Heart and the Level in Serum was Measured. Values Represent the Means ± SEM of 5 Mice⁋
⁋⁋
⁋⁋ ⁋⁋
⁋⁋ ⁋
6) GOT
7) GPT
간에서의 효과 측정
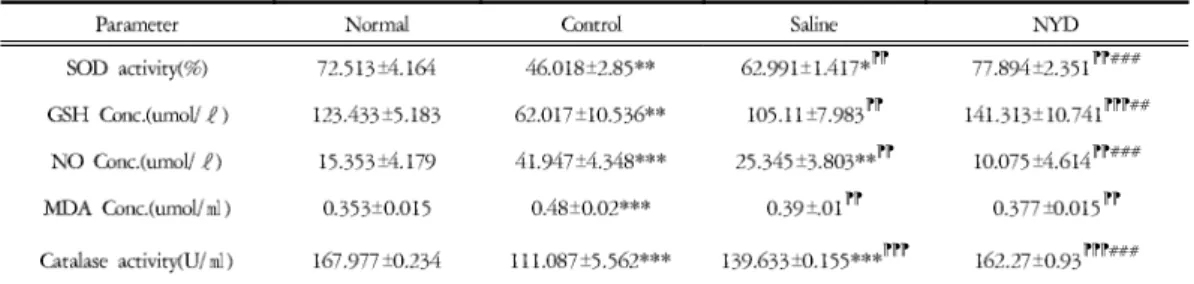
4. 抗酸化
1) SOD activity
2) Catalase
3) Glutathione Fig. 7. Effect of Treatment with
Nocyongdaebo-tang
(NYD)Decoction on Serum Glucose Level of Oxidized Rat.
Values Represent the Means ± SEM of 5 Mice.
**:p<0.01 by ANOVA test.
Fig. 8. Effect of Treatment with
Nocyongdaebo-tang
(NYD) Decoction on GOT in Serum of Oxidized Rat.Values Represent the Means ± SEM of 5 Mice.
150 180 210 240 270 300
Normal Control Saline NYD
GOT (IU/L)
Fig. 9. Effect of Treatment with
Nocyongdaebo-tang
(NYD) Decoction on GPT in Serum of Oxidized Rat.Values Represent the Means ± SEM of 5 Mice.
**:p<0.01 by ANOVA test.
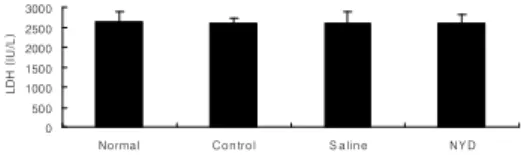
Fig. 6. Effect of Treatment with
Nocyongdaebo-tang
(NYD) Decoction on Serum LDH Level of Oxidized Rat Values Represent the Means ± SEM of 5 Mice.0 500 1000 1500 2000 2500 3000
Normal Con trol S alin e N Y D
LDH (IU/L)
4) NO assay Fig. 10. Effect of Treatment with
Nocyongdaebo-tang
(NYD)Decoction on SOD Activity in Oxidized Rat Liver.
Values Represent the Means ± SEM of 5 Mice. ***:
P<0.001, **: P<0.01, *: p<0.05 by ANOVA test.
Fig. 11. Effect of Treatment with
Nocyongdaebo-tang
(NYD) Decoction on Catalase Activity in Oxidized Rat Liver.Values Represent the Means ± SEM of 5 Mice. ***:
p<0.001 Compared to Normal by ANOVA test.
Fig. 12. Effect of Treatment with
Nocyongdaebo-tang
(NYD) Decoction on Glutathione Level in Oxidized Rat Liver.Values Represent the Means ± SEM of 5 Mice. ***:
p<0.001, **: p<0.01 by ANOVA test.
Fig. 13. Effect of Treatment with
Nocyongdaebo-tang
(NYD) Decoction on NO Concentration in Oxidized Rat Liver.Values Represent the Means ± SEM of 5 Mice. ***:
P<0.001, **: p<0.01 by ANOVA test.
Table 3. Effect of Treatment with
Nocyongdaebo-tang
(NYD) on Antioxidant in Rat Liver.⁋⁋ ⁋⁋
⁋⁋ ⁋⁋⁋
⁋⁋ ⁋⁋
⁋⁋ ⁋⁋
⁋⁋⁋ ⁋⁋⁋
⁋⁋ ⁋
5) Lipid peroxdation
조직학적 분석 5.
⁻
⁻ Fig. 14. Effect of Treatment with
Nocyongdaebo-tang
(NYD)Decoction on MDA Concentration in Oxidized Rat Liver.
Values Represent the Means ± SEM of 5 Mice. ***:
p<0.001, **: P<0.01 by ANOVA test.
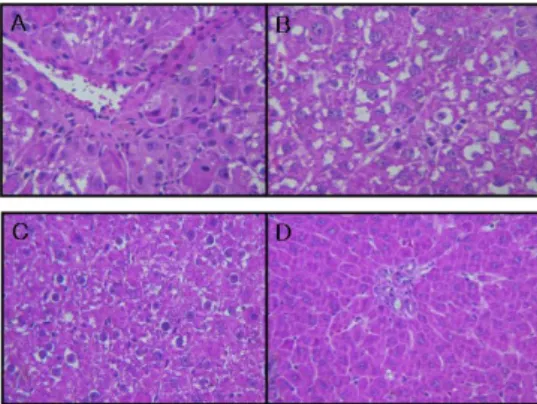
Fig. 15. Histological Analysis of Oxidized Rat Liver.
The Rats were Injected Intraperitoneally (i.p) with AAPH for 7days (once a day. 50mg/kg). Those in the Saline and NYD Groups Were Treated As Described in the Experimental Methods. Rat Liver was Removed, and the Tissue was Sliced and Embedded in Paraffin, and 6U Sections were Stained with Hematoxilin and Eosin. A: Normal (×400) B: Control(×400) C: Saline(×400) D:
NYD(×400)
⁻
⁻
⁻
羽