Copyright © 2018 The Korean Society for Bone and Mineral Research
This is an Open Access article distributed under the terms of the Creative Commons Attribution Non-Commercial Li- cense (http://creativecommons.org/licenses/by-nc/4.0/) which permits unrestricted non-commercial use, distribu- tion, and reproduction in any medium, provided the original work is properly cited.
New Skeletal Muscle Mass Index in Diagnosis of Sarcopenia
Jeong Jae Moon, Sam-Guk Park, Seung Min Ryu, Chan-Ho Park
Department of Orthopedic Surgery, Yeungnam University Medical Center, Daegu, Korea
Background: We sought to develop a novel index based on the skeletal muscle mass that reflects the change of quality of life (QOL), and is the most appropriate index for the body composition of the elderly in Korea. Whether lower extremity skeletal muscle mass index (LESMI) is an appropriate novel new index to diagnose patients with sarcopenia was also evaluated. A cut-off value for each index was reported to facilitate the diagno- sis of patients with sarcopenia in a Korean population. Methods: We used the 5th Kore- an National Health and Nutrition Examination Survey data from 2010. We analyzed 409 elderly patients, including 231 men and 178 women, aged ≥65 years. Patients were di- agnosed by calculating their skeletal muscle index based on the skeletal muscle mass measured using dual energy X-ray absorptiometry. Obesity and osteoporosis were used to screen data and EuroQOL-5 dimension as a health questionnaire Results: The preva- lence of sarcopenia in each index was obtained based on its cut-off value for diagnosing sarcopenia. There was a significant difference between the obesity rate of elderly pa- tients diagnosed with sarcopenia and those who were not based on each index. There was no significant difference in the prevalence of osteoporosis between the groups. Sar- copenia diagnosis based on the LESMI was significantly correlated with QOL. Conclu- sions: LESMI, a novel index based on skeletal muscle mass, reflects changes in QOL and is appropriate for the body composition of elderly people in Korea.
Key Words: Obesity, Osteoporosis, Quality of life, Sarcopenia, Skeletal muscle mass index
INTRODUCTION
Sarcopenia is defined as the reduction of skeletal muscle mass below a certain level due to aging accompanied by a reduction in muscular strength and physical function; numerous studies have been conducted worldwide to determine its cause and treatment.[1] As economic costs increase due to the efforts to improve the welfare and quality of life (QOL) of the elderly, sarcopenia is gaining more at- tention following been assigned a disease classification code from the Health Sta- tistics Center under the United States (US) Centers for Disease Control and Preven- tion in 2016.[2,3]
Since Rosenberg [4] first defined sarcopenia in 1997, various methods of mea- suring skeletal muscle mass have been developed along with a number of mea- suring skeletal muscle mass index (mSMI). Furthermore, as the importance of mus- cle strength and physical function has been emphasized in various studies, the Eu- Corresponding author
Sam-Guk Park
Department of Orthopedic Surgery, Yeungnam University Medical Center, 170 Hyeonchung- ro, Nam-gu, Daegu 42415, Korea
Tel: +82-53-620-3640 Fax: +82-53-628-4020 E-mail: [email protected] Received: December 19, 2017 Revised: January 21, 2018 Accepted: January 29, 2018
No potential conflict of interest relevant to this article was reported.
ropean Working Group on Sarcopenia in Older People (EW- GSOP) in 2010 introduced for the first time a diagnostic al- gorithm for sarcopenia based on walking speed, grip strength, and skeletal muscle mass.[1] In 2014, the Asian Working Group for Sarcopenia (AWGS) introduced a new sarcopenia diagnostic algorithm considering the differences in ethnic- ity, physical characteristics, and culture between European and Asian populations.[5] However, despite such efforts, diagnostic standards for sarcopenia and methods of mea- suring skeletal muscle mass are yet to be established. Thus, studies have reported varying prevalence rates for sarco- penia.
Marzetti et al.[6] reported that the skeletal muscle mass of the thigh was associated with walking ability, while Lan- di et al.[7] reported that the skeletal muscle mass of the calf was associated with physical strength and function.
Moreover, various studies have reported that muscle strength or skeletal muscle mass of the lower extremities reflects the clinical significance of sarcopenia, such as a change in the QOL, physical disability, and risk of falls.[8] Based on this, ‘the following hypothesis was considered: Is it appro- priate to diagnose sarcopenia based on the index using only the skeletal muscle mass of the lower extremities?’
Thus, the first purpose of this study was to identify the most suitable mSMI for the physical condition of Korean elderly patients that reflected the change in their QOL. The second purpose was to address the difficulty in diagnosing sarcopenia by setting a reference group using cut-off val- ues based on young, healthy adults. Thus, the 5th Korea National Health and Nutrition Examination Survey (KNH- ANES V) data in 2010 were used to establish the reference group, and the cut-off values were suggested to diagnose sarcopenia more easily.
MEHTODS
From the KNHANES V conducted by the Korea Center for Disease Control and Prevention, health survey and health examination data of 6,990 subjects sampled from January to December 2010 were used.[9] First, 1,352 elderly patients (567 men and 785 women) aged ≥65 years were selected in accordance with the screening criteria recommended by the AWGS. Among them, a total of 409 subjects (231 men and 178 women) were included after excluding subjects with diseases, such as cardiovascular diseases, internal dis-
eases (i.e., cirrhosis, kidney failure, asthma, tuberculosis, thyroid diseases, and diabetes), various types of cancers, and other diseases, including arthritis, that can limit physi- cal activity.
1. Dual energy X-ray absorptiometry (DXA)
Currently, the most accurate method of measuring skel- etal muscle mass is magnetic resonance imaging; however, there are limitations in using such for screening owing to economic issues and inconvenience of use.[10] DXA is a widely used method of measuring skeletal muscle mass for its reasonable cost and convenience of examination.Although it uses X-ray, the skeletal muscle mass of the up- per and lower extremities, head, and body can be measured at low-dose levels.[11]
2. Obesity and osteoporosis
The status of obesity was categorized into three levels:
(1) “underweight” for a body mass index (BMI) below 18.5 kg/m2; (2) “normal” for a BMI below 25.0 kg/m2; and (3) “obese”
for a BMI of ≥25.0 kg/m2 based on the anthropometry data in the health examination. In this study, the under- weight and normal weight groups were simplified as the
“non-obese group” and compared with the “obese group.”
Osteoporosis status was classified as “yes” or “no,” excluding surveys without examination data under the “osteoporosis diagnosis status” category. Based on the aforementioned data, the prevalence of osteoporosis and obesity based on the osteoporosis status was determined.
3. EuroQOL-5 dimension (EQ-5D)
To evaluate QOL, the EQ-5D was used, which was devel- oped in Europe to assess the QOL of patients with chronic diseases; it consists of five categories evaluating mobility, self-care, usual activity, pain / discomfort, and anxiety/de- pression. Each category is classified as “no problem,” “some problem,” or “a lot of problem.” In this study, each category was simplified as either “no problem” or “problem.” The EQ- 5D index can be determined when the values of the five categories are weighted, and a value close to 1 indicates healthy living.[12]
4. Calculation of skeletal muscle mass and diagnosis of sarcopenia
Baumgartner et al.[13] defined appendicular skeletal
muscle mass (ASM) by measuring the value using DXA and excluding the bone mass from the mass of the extremities, from which fat mass is already excluded. Janssen et al.[14]
used bioelectrical impedance analysis to determine the ra- tio of skeletal muscle mass to the weight to use it as an in- dex for the diagnosis of sarcopenia. Based on such, Lim et al.[15] determined the value of the skeletal muscle mass index (SMI; ASM [kg]/body weight [kg]×100) (%) by divid- ing the ASM measured using DXA by the weight for sarco- penia diagnosis. A study including Korean elderly subjects reported this method as a meaningful sarcopenia diagnos- tic tool that reflects the skeletal muscle mass of the ex- tremities and BMI. Newman et al.[16] divided the ASM by the height and adjusted the increase in the ASM with an increasing height (ASM [kg]/height [Ht]2 [m]).
This study suggests a new SMI. Lower extremity skeletal muscle mass (LESM) was calculated using the values mea- sured via the DXA; thereafter, this outcome was divided by the LESMI (LESM [kg]/lower extremity body weight [kg]× 100) (%) and squared height (LESM [kg]/Ht2 [m]) to diag- nose sarcopenia (Table 1).
From the KNHANES V, patients with cardiovascular dis- eases, internal diseases (i.e., cirrhosis, kidney failure, asth- ma, tuberculosis, thyroid diseases, and diabetes), various types of cancers, and diseases that limit mobility were ex-
cluded, and 1,753 patients were selected as the reference group. The mean and standard deviation of the SMI (%), ASM/Ht2, LESMI (%), and LESM/Ht2 of this group were de- termined, and the cut-off value was set as less than 1 in the diagnosis of sarcopenia for each index (Table 2).[15]
5. Statistical analysis
Using the original data from the National Health and Nu- trition Examination Survey (NHANES), a composite sample analysis was conducted, including integrated weighting, variance estimation, and colony extraction variables, tak- ing into account the weights of the surveyed areas and the proportion of the surveyed population by year. The cut-off values of the SMI (%), ASM/Ht2, LESMI (%), and LESM/Ht2 were set as the references in determining the prevalence of sarcopenia in the men and women, and the continuous variable was converted as a categorical variable, i.e., sarco- penia status. Based on the sarcopenia status, each variable was analyzed. For the categorical variable, the Rao-Scott χ2 test reflecting the composite sample and composite sam- ple t-test for the continuous variable were used. IBM SPSS version 22.0 (IBM Corp., Armonk, NY, USA) was used, and a
Table 1. Basic formula of skeletal muscle mass measurement ASM (kg)=lean body mass of extremity – bone mass of extremity SMI (%)=ASM (kg)/body weight (kg)×100
ASM/Ht2 (kg/m2)=ASM (kg)/height2 (m2)
LESM (kg)=lean body mass of lower extremity – bone mass of lower extremity
LESMI (%)=LESM/lower extremity body weight (kg)×100 LESM/Ht2 (kg/m2)=LESM (kg)/height2 (m2)
ASM, appendicular skeletal muscle mass; SMI, skeletal muscle mass index; Ht, height; LESM, lower extremity skeletal muscle mass; LESMI, lower extremity skeletal muscle mass index.
Table 2. Reference group
(20≤Age≤39) ASM SMI ASM/Ht2 LESM LESMI LESM/Ht2
Male (n=742) 23.7±3.2 32.8±2.9 7.8±0.9 17.5±2.4 74.2±5.3 5.8±0.7
Sarcopenia <29.9 <6.6 <68.9 <5.1
Female (n=1,011) 14.5±2.3 25.9±2.4 5.6±0.8 11.2±1.9 59.8±4.8 4.3±0.6
Sarcopenia <23.5 <4.8 <55.0 <3.7
The data is presented as mean±standard deviation.
ASM, appendicular skeletal muscle mass; SMI, skeletal muscle mass index; Ht, height; LESM, lower extremity skeletal muscle mass; LESMI, lower ex- tremity skeletal muscle mass index.
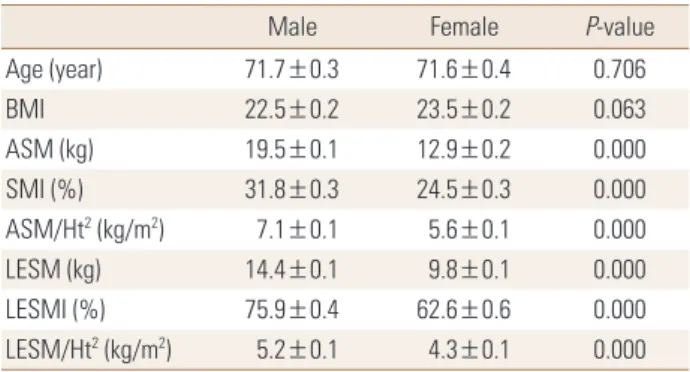
Table 3. Demographic data of the study subjects
Male Female P-value
Age (year) 71.7±0.3 71.6±0.4 0.706
BMI 22.5±0.2 23.5±0.2 0.063
ASM (kg) 19.5±0.1 12.9±0.2 0.000
SMI (%) 31.8±0.3 24.5±0.3 0.000
ASM/Ht2 (kg/m2) 7.1±0.1 5.6±0.1 0.000
LESM (kg) 14.4±0.1 9.8±0.1 0.000
LESMI (%) 75.9±0.4 62.6±0.6 0.000
LESM/Ht2 (kg/m2) 5.2±0.1 4.3±0.1 0.000 The data is presented as mean±standard error.
BMI, body mass index; ASM, appendicular skeletal muscle mass; SMI, skeletal muscle mass index; Ht, height; LESM, lower extremity skeletal muscle mass; LESMI, lower extremity skeletal muscle mass index.
Table 4. Prevalence of sarcopenia diagnosed by each index Prevalence of sarcopenia (%)
Male Female Total
Diagnosed by SMI 24.3±3.5 42.4±4.5 32.3±2.9 Diagnosed by ASM/Ht2 42.4±4.0 10.8±3.4 28.5±2.6 Diagnosed by LESMI 6.3±1.6 13.1±3.2 9.3±1.6 Diagnosed by LESM/Ht2 37.6±4.3 12.8±3.7 26.7±3.0 The data is presented as percentage±standard error.
SMI, skeletal muscle mass index; ASM, appendicular skeletal muscle mass; Ht, height; LESMI, lower extremity skeletal muscle mass index;
LESM, lower extremity skeletal muscle mass.
Table 5. Prevalence of obesity and osteoporosis by sarcopenia status Sarcopenia Non-sarcopenia P-value Obesity
Diagnosed by SMI 45.5±5.1 11.1±5.4 0.000 Diagnosed by ASM/Ht2 3.2±1.6 29.8±3.4 0.000 Diagnosed by LESMI 52.6±9.1 19.1±2.8 0.000 Diagnosed by LESM/Ht2 2.6±1.5 29.4±3.6 0.000 Osteoporosis
Diagnosed by SMI 16.1±4.3 18.1±2.9 0.469 Diagnosed by ASM/Ht2 10.5±3.3 20.0±2.9 0.052 Diagnosed by LESMI 21.2±7.6 17.1±2.3 0.248 Diagnosed by LESM/Ht2 13.6±4.0 18.7±2.9 0.087 The data is presented as percentage±standard error.
SMI, skeletal muscle mass index; ASM, appendicular skeletal muscle mass; Ht, height; LESMI, lower extremity skeletal muscle mass index;
LESM, lower extremity skeletal muscle mass.
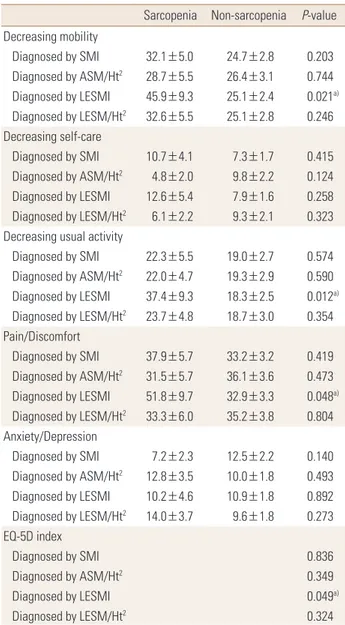
Table 6. Prevalence of EQ-5D categories by sarcopenia status Sarcopenia Non-sarcopenia P-value Decreasing mobility
Diagnosed by SMI 32.1±5.0 24.7±2.8 0.203 Diagnosed by ASM/Ht2 28.7±5.5 26.4±3.1 0.744 Diagnosed by LESMI 45.9±9.3 25.1±2.4 0.021a) Diagnosed by LESM/Ht2 32.6±5.5 25.1±2.8 0.246 Decreasing self-care
Diagnosed by SMI 10.7±4.1 7.3±1.7 0.415 Diagnosed by ASM/Ht2 4.8±2.0 9.8±2.2 0.124 Diagnosed by LESMI 12.6±5.4 7.9±1.6 0.258 Diagnosed by LESM/Ht2 6.1±2.2 9.3±2.1 0.323 Decreasing usual activity
Diagnosed by SMI 22.3±5.5 19.0±2.7 0.574 Diagnosed by ASM/Ht2 22.0±4.7 19.3±2.9 0.590 Diagnosed by LESMI 37.4±9.3 18.3±2.5 0.012a) Diagnosed by LESM/Ht2 23.7±4.8 18.7±3.0 0.354 Pain/Discomfort
Diagnosed by SMI 37.9±5.7 33.2±3.2 0.419 Diagnosed by ASM/Ht2 31.5±5.7 36.1±3.6 0.473 Diagnosed by LESMI 51.8±9.7 32.9±3.3 0.048a) Diagnosed by LESM/Ht2 33.3±6.0 35.2±3.8 0.804 Anxiety/Depression
Diagnosed by SMI 7.2±2.3 12.5±2.2 0.140 Diagnosed by ASM/Ht2 12.8±3.5 10.0±1.8 0.493 Diagnosed by LESMI 10.2±4.6 10.9±1.8 0.892 Diagnosed by LESM/Ht2 14.0±3.7 9.6±1.8 0.273 EQ-5D index
Diagnosed by SMI 0.836
Diagnosed by ASM/Ht2 0.349
Diagnosed by LESMI 0.049a)
Diagnosed by LESM/Ht2 0.324
The data is presented as percentage±standard error.
a)P-value<0.05.
EQ-5D, EuroQOL-5 dimension; SMI, skeletal muscle mass index; ASM, appendicular skeletal muscle mass; Ht, height; LESMI, lower extremity skeletal muscle mass index; LESM, lower extremity skeletal muscle mass.
P-values of less than 0.05 was considered to indicate statis- tical significance. All results were presented as percentages or means.
RESULTS
The mean age and BMI between the two groups classi- fied by sex did not show a significant difference; converse- ly, the means of the indices associated with skeletal muscle mass showed significant differences maybe owing to the difference in the physical characteristics based on sex (Ta- ble 3).
1. Prevalence of sarcopenia
Based on the cut-off value set by the reference group, the prevalence of sarcopenia was 31.5% using the SMI, 28.4%
using the ASM/Ht2, 9.8% using the LESMI, and 27.4% using the LESM/Ht2. After applying the total weight to the popu-
lation diagnosed with sarcopenia based on each index, the prevalence of sarcopenia was 32.3±2.9% using the SMI, 28.5±2.6% using the ASM/Ht2, 9.3±1.6% using the LES- MI, and 26.7±3.0 using the LESM/Ht2 (Table 4).
2. Prevalence of obesity and osteoporosis based on sarcopenia diagnosis
In the elderly patients diagnosed with sarcopenia based on the SMI as the index, 45.5±5.1% were obese; in the el- derly patients not diagnosed with sarcopenia, 11.1±5.4%
were obese, showing a significant difference in the preva- lence of obesity based on sarcopenia diagnosis. When the LESMI was set as the index, the prevalence of obesity in the two groups based on sarcopenia diagnosis was 52.6±
9.1% and 19.1±2.8%, respectively, showing a significant difference. Using the ASM/Ht2 and LESM/Ht2 as the indices, the prevalence of obesity based on sarcopenia diagnosis showed a reverse correlation, in which the patients without sarcopenia had a higher prevalence of obesity than those with sarcopenia. In the elderly patients with and without sarcopenia, the prevalence of osteoporosis showed a re- verse correlation with the ASM/Ht2 as the index; the other indices did not show significant differences (Table 5).
3. EQ-5D
In the diagnosis of sarcopenia using the LESMI as the in- dex and determination of the incidence of problems in the categories of the EQ-5D, a significant difference was ob- served in mobility, usual activity, pain/discomfort, and EQ- 5D index. With the exception of the LESMI, the incidence of problems in the EQ-5D categories based on sarcopenia diagnosis using the SMI, ASM/Ht2, and LESM/Ht2 as the in- dices showed no significant difference (Table 6).
DISCUSSION
Previously, Chen et al.[5] attempted to establish the ap- propriate sarcopenia diagnosis criteria for the Asian popu- lations via the AWGS. However, limitations included the data being weighted toward the Southeast Asian popula- tions, and the different ethnicities of the Asian population restricted the establishment of representative sarcopenia diagnosis criteria despite such data being based on differ- ent mSMI and ages.[17,18]
The purpose of the present study was to standardize the age and measuring tools based on the data obtained on DXA conducted on subjects older than 65 years as suggest- ed by the AWGS and to determine which of SMI and ASM/
Ht² is more appropriate as mSMI for diagnosis of sarcope- nia in Korean elderly. Based on the SMI, the prevalence of sarcopenia was 27.3% and 37.1% in men and women, with no significant differences in terms of sex; however, based on the ASM/Ht2, the prevalence of sarcopenia was 43.7%
and 8.4% in men and women, respectively, which was sig- nificantly different. Kim et al.[19] reported that as Korean
elderly women experienced dramatic industrialization, the increased height in the younger generation must be con- sidered as it was the reference group for diagnosing sarco- penia using the ASM/Ht2 index; they also suggested that the difference in the mean height between the 20s and 80s was 14.5 cm. As this is a characteristic of Asian popula- tions in general, including the Korean population, there are limitations in using the ASM/Ht2 as the index in evalu- ating sarcopenia in Asian populations.
Furthermore, among the elderly diagnosed with sarco- penia based on the SMI as the index, 45.5±5.1% were obese;
among those without sarcopenia, the prevalence of obesi- ty was 11.1±5.4%, showing a significant difference. Mean- while, in the elderly diagnosed with sarcopenia based on the ASM/Ht2 as the index, 3.2±1.6% were obese; in those without sarcopenia, 29.3±3.4% were obese, showing a re- verse correlation. Stenholm et al.[20] reported that obesity causes fat permeation in the skeletal muscle, reducing its quality and function and consequently highlighting the effect of obesity on the reduction of muscular mass. Tyro- volas et al.[21] reported that BMI and weight increase, while fat-free mass decreases, especially in elderly women after menopause, and that obesity in women affects sarcopenia.
Zoico et al.[22] reported that using the SMI to diagnose sarcopenia is effective in screening sarcopenia in patients with a high fat mass, along with the association of the prev- alence of insulin resistance and metabolic syndrome. Mean- while, Newman et al.[16] reported an association between the prevalence of sarcopenia and obesity using the ASM/
Ht2 as the index. Therefore, weight-adjusted SMI is a more appropriate mSMI than height-adjusted ASM/Ht2 in sarco- penia diagnosis among Korean elderly patients.
With regards to the association between the LESM and physical activity, Visser et al.[23] first reported in 1998 that there is no association between skeletal muscle mass of the extremities or lower extremities and physical disorder or activity and presented supporting evidence through their prospective study.[24] In 2011, a meta-analysis of 30 cohort studies confirmed no association between skeletal muscle mass of the lower extremities and physical activity disorder and instead reported that a weak lower extremity causes physical activity disorders, which has a close relation- ship with falls.[25] Bouchard and Janssen [26] also conduct- ed a cross-sectional study using the NHANES data and con- firmed that poor extremity strength and low skeletal mus-
cle mass of the lower extremities had no correlation with physical disorders; however, they supported the correlation between lower extremity strength and physical function disorders by reporting that the correlation is no longer val- id when patellar extension is adjusted.
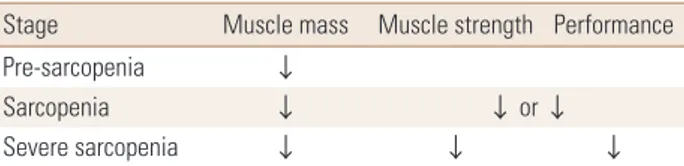
Based on the abovementioned findings, does reduction of the LESM not induce physical activity disorders? The EW- GSOP classifies three stages of sarcopenia as pre-sarcope- nia, sarcopenia, and severe sarcopenia and suggests ap- propriate treatment and recovery goals for each stage. The EWGSOP also emphasized the need for well-designed stud- ies for each stage (Table 7).[1] Elderly patients in the pre- sarcopenia stage, which only shows reduction in skeletal muscle mass, should be screened for appropriate treatment to slow down the progression to the sarcopenia stage, which is accompanied with an abnormal muscular strength, to prevent further physical disorders or falls. In this study, sar- copenia diagnosis based on the LESMI showed a significant correlation with the incidence of problems in mobility and usual activity and pain/discomfort and the EQ-5D index, which indicates that it better reflects the QOL than sarco- penia diagnosis based on the SMI, ASM/Ht2, and LESM/Ht2. Therefore, the LESMI can be a useful index in the diagno- sis of pre-sarcopenia and sarcopenia among Korean elderly patients, as it considers the skeletal muscle mass and BMI and reflects their QOL.
The limitations of this study were the inconclusive infor- mation on proving a causal relationship as it is based on the original data from the NHANES and that there may be several confounding variables not reflected. Next, the di- agnostic criteria and measuring method of sarcopenia are still under discussion. Moreover, because categories evalu- ating muscular strength or physical function are not includ- ed in the original data, there are limitations in the analysis only based on the skeletal muscle mass. It is necessary to propose a well-designed prospective study on the appro- priate index for sarcopenia diagnosis and the definition of the LESMI.
Table 7. EWGSOP conceptual stages of sarcopenia
Stage Muscle mass Muscle strength Performance
Pre-sarcopenia ↓
Sarcopenia ↓ ↓ or ↓
Severe sarcopenia ↓ ↓ ↓
EWGSOP, European Working Group on Sarcopenia in Older People.
CONCLUSIONS
The LESMI can be utilized for diagnosing sarcopenia, as it is appropriate for the physical condition of Korean elder- ly patients and well reflects changes in their QOL. In addi- tion, as this study presents the cut-off value needed for sarcopenia diagnosis, it will make such a diagnosis among Korean researchers more convenient.
REFERENCES
1. Cruz-Jentoft AJ, Baeyens JP, Bauer JM, et al. Sarcopenia:
European consensus on definition and diagnosis: Report of the European Working Group on Sarcopenia in Older People. Age Ageing 2010;39:412-23.
2. Cao L, Morley JE. Sarcopenia Is recognized as an indepen- dent condition by an international classification of disease, tenth revision, clinical modification (ICD-10-CM) code. J Am Med Dir Assoc 2016;17:675-7.
3. Park HM, Ha YC, Yoo JI, et al. Prevalence of sarcopenia ad- justed body mass index in the Korean woman based on the Korean national health and nutritional examination surveys. J Bone Metab 2016;23:243-7.
4. Rosenberg IH. Sarcopenia: origins and clinical relevance. J Nutr 1997;127:990s-1s.
5. Chen LK, Liu LK, Woo J, et al. Sarcopenia in Asia: consen- sus report of the Asian Working Group for Sarcopenia. J Am Med Dir Assoc 2014;15:95-101.
6. Marzetti E, Lees HA, Manini TM, et al. Skeletal muscle apop- totic signaling predicts thigh muscle volume and gait speed in community-dwelling older persons: an exploratory study.
PLoS One 2012;7:e32829.
7. Landi F, Liperoti R, Russo A, et al. Sarcopenia as a risk fac- tor for falls in elderly individuals: results from the ilSIRENTE study. Clin Nutr 2012;31:652-8.
8. Ji HM, Han J, Won YY. Sarcopenia and osteoporosis. Hip Pelvis 2015;27:72-6.
9. Ministry of Health & Welfare, Korea Centers for Disease Control & Prevention. Korea health statistics 2011: Korea national health and nutrition examination survey (KNHA- NES V-2). Seoul: Ministry of Health & Welfare; 2012.
10. Chien MY, Huang TY, Wu YT. Prevalence of sarcopenia esti- mated using a bioelectrical impedance analysis prediction equation in community-dwelling elderly people in Taiwan.
J Am Geriatr Soc 2008;56:1710-5.
11. Hong S, Choi WH. Clinical and physiopathological mecha- nism of sarcopenia. Korean J Med 2012;83:444-54.
12. Szende A, Oppe M, Devlin N. EQ-5D value sets: inventory, comparative review and user guide. Dordrecht, NL: Spring- er; 2007.
13. Baumgartner RN, Koehler KM, Gallagher D, et al. Epidemi- ology of sarcopenia among the elderly in New Mexico. Am J Epidemiol 1998;147:755-63.
14. Janssen I, Heymsfield SB, Ross R. Low relative skeletal mus- cle mass (sarcopenia) in older persons is associated with functional impairment and physical disability. J Am Geri- atr Soc 2002;50:889-96.
15. Lim S, Kim JH, Yoon JW, et al. Sarcopenic obesity: preva- lence and association with metabolic syndrome in the Ko- rean Longitudinal Study on Health and Aging (KLoSHA).
Diabetes Care 2010;33:1652-4.
16. Newman AB, Kupelian V, Visser M, et al. Sarcopenia: alter- native definitions and associations with lower extremity function. J Am Geriatr Soc 2003;51:1602-9.
17. Sanada K, Miyachi M, Tanimoto M, et al. A cross-sectional study of sarcopenia in Japanese men and women: refer- ence values and association with cardiovascular risk fac- tors. Eur J Appl Physiol 2010;110:57-65.
18. Lee WJ, Liu LK, Peng LN, et al. Comparisons of sarcopenia defined by IWGS and EWGSOP criteria among older peo- ple: results from the I-Lan longitudinal aging study. J Am Med Dir Assoc 2013;14:528.e1-7.
19. Kim YS, Lee Y, Chung YS, et al. Prevalence of sarcopenia
and sarcopenic obesity in the Korean population based on the Fourth Korean National Health and Nutritional Ex- amination Surveys. J Gerontol A Biol Sci Med Sci 2012;67:
1107-13.
20. Stenholm S, Harris TB, Rantanen T, et al. Sarcopenic obesi- ty: definition, cause and consequences. Curr Opin Clin Nutr Metab Care 2008;11:693-700.
21. Tyrovolas S, Koyanagi A, Olaya B, et al. Factors associated with skeletal muscle mass, sarcopenia, and sarcopenic obe- sity in older adults: a multi-continent study. J Cachexia Sar- copenia Muscle 2016;7:312-21.
22. Zoico E, Di Francesco V, Bissoli L, et al. Interrelationships between leptin resistance, body composition, and aging in elderly women. J Am Geriatr Soc 2008;56:1768-9.
23. Visser M, Harris TB, Langlois J, et al. Body fat and skeletal muscle mass in relation to physical disability in very old men and women of the Framingham Heart Study. J Geron- tol A Biol Sci Med Sci 1998;53:M214-21.
24. Visser M, Goodpaster BH, Kritchevsky SB, et al. Muscle mass, muscle strength, and muscle fat infiltration as predictors of incident mobility limitations in well-functioning older persons. J Gerontol A Biol Sci Med Sci 2005;60:324-33.
25. Visser M, Schaap LA. Consequences of sarcopenia. Clin Geri- atr Med 2011;27:387-99.
26. Bouchard DR, Janssen I. Dynapenic-obesity and physical function in older adults. J Gerontol A Biol Sci Med Sci 2010;
65:71-7.