Copyright © 2014 The Korean Society for Bone and Mineral Research
This is an Open Access article distributed under the terms of the Creative Commons Attribution Non-Commercial Li- cense (http://creativecommons.org/licenses/by-nc/3.0/) which permits unrestricted non-commercial use, distribu- tion, and reproduction in any medium, provided the original work is properly cited.
pISSN 2287-6375 eISSN 2287-7029
Nutrient Intake and Bone Mineral Density by Nutritional Status in Patients with Inflammatory Bowel Disease
Heesook Lim1, Hwa Jong Kim2, Su Jin Hong2, Soonkyung Kim3*
1Department of Nutrition, 2Digestive Disease Center, Department of Internal Medicine, Soonchunhyang University Bucheon Hospital, Bucheon;
3Department of Food Sciences & Nutrition, Soonchunhyang University, Asan, Korea
Background: Malnutrition among inflammatory bowel disease (IBD) may arise from fac- tors including inadequate dietary intake, malabsorption, and progression of disease. IBD has been reported an increased prevalence of low bone mass. The aims of the present study were to evaluate the nutritional status and to investigate the correlation between bone mineral density (BMD) and nutrient factors in patients with IBD. Methods: A total of 41 subjects were classified into normal group (n=21) and malnourished group (n=
20) by the subjective global assessment result. We surveyed the dietary habit, nutrient intake, and BMD. Results: Subjects’ average age was 36.7 years old, and included 26 ul- cerative colitis and 15 Crohn’s disease. The serum C-reactive protein (CRP) was signifi- cantly higher and serum calcium was significantly lower in the malnourished group.
Lower bone density subjects were more in the malnourished group but no significant difference. Intake of energy, protein, carbohydrate, fiber, iron, sodium, potassium, zinc, vitamin B6, vitamin C and folate were significantly lower in the malnourished group. The BMD of malnourished group showed correlation with triceps skin fold thickness (TSF), CRP, dietary calcium, phosphorous, iron, animal iron, zinc and vitamin. Conclusions: The results suggested that adequate intake of nutrients is important to prevent bone loss and systemic education programs are need for IBD patients.
Key Words: Bone density, Inflammatory bowel diseases, Nutritional status
INTRODUCTION
Inflammatory bowel disease (IBD) is a chronic condition that includes Crohn’s disease and ulcerative colitis. The incidence of both intestinal disorders has recent- ly increasing, and there are several problems associated with symptoms and side effects that follow a course of relapse and treatment.[1] Decrease in bone density is a relatively common complication of IBD, occurring in about 20-50% patients.
Poor bone density may be caused by malabsorption of calcium and vitamin D, with steroid, malnutrition, and an unbalanced diet.[2] Another study reported that in- flammatory mediators such as tumor necrosis factor, interleukin (IL)-1β, and IL-6 cause abnormalities in the bone regenerating rate, which eventually lead to a de- crease in bone density.[3]
Corresponding author Soonkyung Kim
Department of Food Sciences & Nutrition, Soonchunhyang University, 22
Soonchunhyang-ro, Asan 336-746, Korea Tel: +82-41-530-1261
Fax: +82-41-530-1264 E-mail: [email protected] Received: May 22, 2014 Revised: July 3, 2014 Accepted: July 9, 2014
No potential conflict of interest relevant to this article was reported.
Original Article
Bone density generally varies according to genetics or ethnicity. The effective way to prevent osteoporosis is to increase bone density when an individual is young, as the bone becomes dense during the growth period. Since vari- ous nutrients have already been proven to improve bone density, a long-term diet with good nutrients is important.
[4] IBD can occur at a relatively young age and persist a life- time. A previous study therefore suggested lifestyle chang- es to prevent bone loss and strategies to screen and treat high-risk patients.[1]
Individuals with IBD must limit their food intake due to the disease itself or other complications, which eventually leads to malnutrition. Weight loss, hypoalbuminemia, and anemia are the most frequent manifestations of malnutri- tion. Approximately 23% of outpatients and 85% of inpa- tients with IBD were reported to have malnutrition associ- ated with the disease. Further, this prolonged malnutrition in turn decreases bone density.[5] Complete prohibition of certain foods or inappropriate food limits due to lack of adequate information also cause these problems. For ef- fective treatment, the patient must be well nourished and be provided nutritional support when oral intake is not possible. Healthcare providers recommend that more at- tention be paid to the relationship between IBD, and poor nutrition.[6] However, only few studies have examined the nutritional needs of patients with IBD in Korea, although studies by decreased bone density caused by poor nutri- tion are currently underway.
The aim of the present study was to investigate the rela- tionship between bone density and IBD in order to ensure that patients receive the proper nutrition needed to man- age and prevent osteoporosis. Hence, we surveyed the di- etary habit, nutrient intake, and bone density of patients with Crohn’sdisease and ulcerative colitis. The relationship of bone mineral density (BMD) and nutrient intake based on nutritional status were also investigated.
METHODS 1. Subject
This study was conducted on patients with IBD who were treated at the Department of Internal Medicine, Soonchun- hyang University Bucheon Hospital, between September 2010 and September 2011. A doctor evaluated compliance of patients for study when the patient visited for check
ups, and they explained the purpose and procedures of the study. Patients who agreed to sign the experimental agreement were included in this study. Patients for whom the cause of poor bone density could have been complete- ly unrelated to IBD were excluded. Other exclusion criteria included a history of colectomy, diabetes, thyroid disease, liver disease, kidney disease, sexual malfunction, fractures, and metabolic bone disease; menopause; medications such as vitamin D supplement, sex hormones, and phosphate binder; and a controlled diet that increases bone density.
Although 70 patients were enrolled, data were collected only from 41 subjects who completed the study except for refused investigation, did not undergo a bone-related test, or had missing information. The 41 subjects were classified into two groups based on nutrition status: the normal group (n=21) and the malnourished group (n=20).
2. Clinical information and nutritional status
The subjects’ age and gender were obtained. The weight and height were also measured and the body mass index (BMI) was calculated. The triceps skin fold thickness (TSF) and waist circumference were measured and weight loss rate within the past 6 months were surveyed. The clinical information on the diagnosis and diagnostic period were derived from the medical records. Disease activity and cu- mulative steroid dose were assessed by a doctor. Disease activity of ulcerative colitis was classified by the Truelove and Witts severity index[7] and disease activity of Crohn's disease was assessed by a Crohn's disease activity index (CDAI).[8] The nutritional status was evaluated using sub- jective global assessment (SGA)[9] by the clinical dietitian and the subjects were classified into normal group or mal- nourished group.3. Blood and BMD test
The blood sample was collected from the subjects after 10-12 hours fast. The test items included hemoglobin, he- matocrit, C-reactive protein (CRP), serum albumin, calcium and phosphorous (Technicon AutoAnalyzer methods). Se- rum intact parathyroid hormone (iPTH) was measured by an electrochemiluminescent immunoassay and serum 25-hydroxy-vitamin D3 (25-[OH]D3) was measured using a chemiluminescent immunoassay. The BMD was measured using the dual energy X-ray absorptiometry (DXA) equip- ment (Lunar Prodigy; GE Lunar Corp., Madison, WI, USA) on
the subject’s lumber spine and femoral neck. Bone density was expressed as BMD, Z-score and T-score. The bone den- sity was evaluated using a T-score -1.0 or over was normal;
-2.5 ~ -1.0 was osteopenia; and -2.5 or less was osteoporo- sis. Dichotomizing the Z-score, a cutoff value of ≤ -1 stan- dard deviation (SD) was defined as reduced bone mass.[10]
4. Dietary habit and nutrient intake
The questions on the regularity of usual meals, skipped meals, meal time and amount of meals, drinking, smoking and exercise habits were surveyed per individual. Skilled clinical dietitian interviewed subjects using photographs of food items and a booklet containing eye measurement data as aids for the nutrient intake survey. Data on dietary intake amount were collected using the 24-hr recall meth- od for three days and intakes of nutritents were analyzed with the CAN-Pro 3.0 (Korean Nutrition Society, Seoul, Ko- rea). In addition, to evaluate the intake excess or deficiency by nutrient, the intake was compared with the recommend- ed nutritional intake for Koreans.[11]
5. Statistical analysis
The mean and standard deviation were calculated using SPSS statistical software ver. 18.0 (SPSS Inc., Chicago, IL, USA). The difference on the frequency of food intake be- tween the two groups was tested chi-square test while the mean was compared using t-test. The correlation between bone density and its related variables was analyzed using Pearson's correlation coefficient. All results were consid- ered statistically significant when P<0.05.
RESULTS
1. Clinical characteristics of the patients
There were 25 male and 16 female subjects (total 41 sub- jects) and their mean age was 36.7 years old. Although more male subjects in the malnourished group, there was no significant difference. The average BMI was 22 kg/m2 and 1.9% of subject showed weight loss within the recently 6 months. The weight loss rate was 0.4% in normal group and 3.4% in malnourished group which was significantly different (P<0.001). The average waist circumference was 81.1 mm and average TSF was 12.2 mm. Twenty-six sub- jects (63.4%) had ulcerative colitis and 15 subjects (36.6%) had Cronhn’s disease. There were more ulcerative colitis
patients in general but the ratio between ulcerative colitis and Cronhn’s disease was the same in the malnourished group. The average disease period was 44.2 months (ap- proximately 3.7 years) which showed 32 subjects (78%) had the disease for more than one year while only 9 sub- jects (22%) had it for less than a year. In comparison of dis- ease activity, most of ulcerative colitis was remission and mild status. Disease activity of Cronhn’s disease also as- sessed remission status. A dose of steroids were more in the malnourished group, there was no significant differ- ence (Table 1).
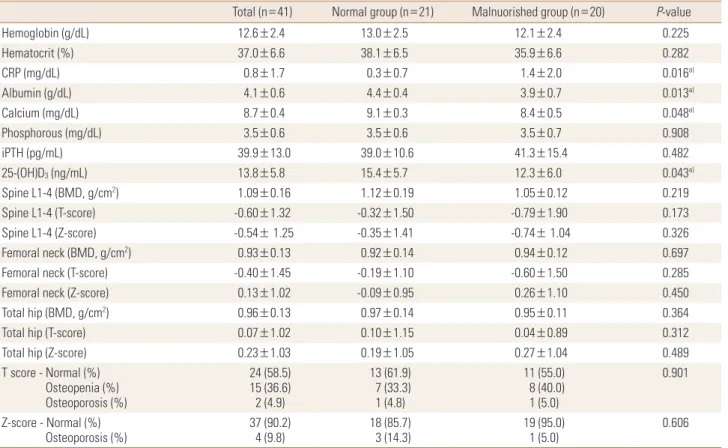
2. Blood parameters and BMD according to the nutritional status of the patients
The blood test showed that the average hemoglobin was 12.6 g/dL, below the normal range (13-17 g/dL). The malnourished group showed a lower range than that of the normal group but the difference was not that signifi- cant. The result showed the serum albumin, calcium and phosphorous levels were within normal range but the av- erage CRP was at 0.8 mg/dL slightly higher than the nor- mal range (0-0.5 mg/dL). The result of CRP was significant- ly higher in the malnourished group than that of the nor- mal group (P<0.05). The serum calcium and 25-(OH)D3 lev- el were also significantly lower in the malnourished group (P<0.05). The bone density test showed that T-score of lum- bar spine and femoral neck were lower in the malnourished group than those of the normal group but the difference was not significant. Fifteen subjects (36.6%) were classified into osteopenia based on their T-score while 2 subjects (4.9%) have osteoporosis. There were more subjects in the malnourished group who had a lower bone density com- pared with the normal group but the difference was not significant (Table 2).
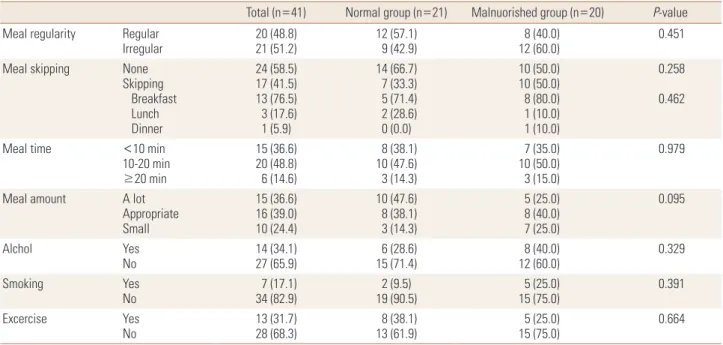
3. Comparison on dietary habits according to the nutritional status of the patients
The comparison of eating behaviors and their life habit is presented in Table 3. For the regularity of meals, 20 sub- jects (48.8%) answered ‘regular’ while 21 subjects (51.2%) answered ‘irregular,’ which meant more than half of the sub- jects were having irregular meals. The skipping of meals rate showed that breakfast accounted for the highest per- centage with 13 (76.5%) out of the 17 subjects (41.5%) who answered ‘I skip meals’. For the duration of meals, 20 sub-
Table 1. Comparison of clinical characteristics and anthropometric data according to nutritional status
Total (n = 41) Normal group (n = 21) Malnuorished group (n = 20) P-value
Age (yr) 36.7±11.9 39.2±12.5 34.1±11.0 0.171
Gender - Male (%)
Female (%) 25 (61.0)
16 (39.0) 10 (47.6)
11 (52.4) 15 (75.0)
5 (25.0) 0.069
Height (cm) 166.2±9.0 163.1±8.7 169.5±8.3 0.022a)
Weight (kg) 61.0±13.4 61.6±14.9 60.3±11.8 0.753
BMI (kg/m2) 22.0±4.0 23.0±4.4 20.9±3.2 0.085
Weight loss (recently 6 months, %) 1.9±2.6 0.4±1.0 3.4±2.9 0.000b)
WC (mm) 81.1±8.3 81.7±9.8 80.4±6.6 0.619
TSF (mm) 12.2±2.6 13.3±2.5 11.1±2.8 0.787
Type - Ulcerative colitis (%)
Crohn’s disease (%) 26 (63.4)
15 (36.6) 16 (76.2)
5 (23.8) 10 (50.0)
10 (50.0) 0.078
Disease duration (months) < 1 yr (%)
≥ 1 yr (%)
44.2±30.3 9 (22.0) 32 (78.0)
40.3±28.4 4 (19.0) 17 (81.0)
48.3±32.5 3 (15.0) 17 (85.0)
0.411 0.551 Disease activity
Ulcerative colitis - Mild (%) Moderate (%) Severe (%) Crohn’s disease
15 (57.7) 9 (34.6) 2 (7.7) 104.91±88.23
11 (68.7) 4 (25.0) 1 (6.3) 82.4±26.1
4 (40.0) 5 (50.0) 1 (10.0) 116.2±106.7
0.349
0.505
Cumulative steroid dose (mg) 4,116.6±3,913.3 3,405.8±3,264.8 4,929.1±4,215.3 0.473
Mean±standard deviation (SD), a)P<0.05, b)P< 0.001.
BMI, body mass index; WC, waist circumference; TSF, triceps skin fold thickness.
Table 2. Comparison of blood parameters and bone minral density according to nutritional status
Total (n=41) Normal group (n=21) Malnuorished group (n=20) P-value
Hemoglobin (g/dL) 12.6±2.4 13.0±2.5 12.1±2.4 0.225
Hematocrit (%) 37.0±6.6 38.1±6.5 35.9±6.6 0.282
CRP (mg/dL) 0.8±1.7 0.3±0.7 1.4±2.0 0.016a)
Albumin (g/dL) 4.1±0.6 4.4±0.4 3.9±0.7 0.013a)
Calcium (mg/dL) 8.7±0.4 9.1±0.3 8.4±0.5 0.048a)
Phosphorous (mg/dL) 3.5±0.6 3.5±0.6 3.5±0.7 0.908
iPTH (pg/mL) 39.9±13.0 39.0±10.6 41.3±15.4 0.482
25-(OH)D3 (ng/mL) 13.8±5.8 15.4±5.7 12.3±6.0 0.043a)
Spine L1-4 (BMD, g/cm2) 1.09±0.16 1.12±0.19 1.05±0.12 0.219
Spine L1-4 (T-score) -0.60±1.32 -0.32±1.50 -0.79±1.90 0.173
Spine L1-4 (Z-score) -0.54± 1.25 -0.35±1.41 -0.74± 1.04 0.326
Femoral neck (BMD, g/cm2) 0.93±0.13 0.92±0.14 0.94±0.12 0.697
Femoral neck (T-score) -0.40±1.45 -0.19±1.10 -0.60±1.50 0.285
Femoral neck (Z-score) 0.13±1.02 -0.09±0.95 0.26±1.10 0.450
Total hip (BMD, g/cm2) 0.96±0.13 0.97±0.14 0.95±0.11 0.364
Total hip (T-score) 0.07±1.02 0.10±1.15 0.04±0.89 0.312
Total hip (Z-score) 0.23±1.03 0.19±1.05 0.27±1.04 0.489
T score - Normal (%) Osteopenia (%) Osteoporosis (%)
24 (58.5) 15 (36.6) 2 (4.9)
13 (61.9) 7 (33.3) 1 (4.8)
11 (55.0) 8 (40.0) 1 (5.0)
0.901
Z-score - Normal (%)
Osteoporosis (%) 37 (90.2)
4 (9.8) 18 (85.7)
3 (14.3) 19 (95.0)
1 (5.0) 0.606
Mean±standard deviation (SD), a)P<0.05.
CRP, C-reactive protein; iPTH, intact parathyroid hormone; 25-(OH)D3, 25-hydroxy-vitamin D3; L, lumbar; BMD, bone mineral density.
Table 3. Comparison of dietary habits according to nutritional status
Total (n=41) Normal group (n=21) Malnuorished group (n=20) P-value Meal regularity Regular
Irregular 20 (48.8)
21 (51.2) 12 (57.1)
9 (42.9) 8 (40.0)
12 (60.0) 0.451
Meal skipping None
Skipping Breakfast Lunch Dinner
24 (58.5) 17 (41.5) 13 (76.5) 3 (17.6) 1 (5.9)
14 (66.7) 7 (33.3) 5 (71.4) 2 (28.6) 0 (0.0)
10 (50.0) 10 (50.0) 8 (80.0) 1 (10.0) 1 (10.0)
0.258 0.462
Meal time <10 min
10-20 min
≥20 min
15 (36.6) 20 (48.8) 6 (14.6)
8 (38.1) 10 (47.6) 3 (14.3)
7 (35.0) 10 (50.0) 3 (15.0)
0.979
Meal amount A lot
Appropriate Small
15 (36.6) 16 (39.0) 10 (24.4)
10 (47.6) 8 (38.1) 3 (14.3)
5 (25.0) 8 (40.0) 7 (25.0)
0.095
Alchol Yes
No 14 (34.1)
27 (65.9) 6 (28.6)
15 (71.4) 8 (40.0)
12 (60.0) 0.329
Smoking Yes
No 7 (17.1)
34 (82.9) 2 (9.5)
19 (90.5) 5 (25.0)
15 (75.0) 0.391
Excercise Yes
No 13 (31.7)
28 (68.3) 8 (38.1)
13 (61.9) 5 (25.0)
15 (75.0) 0.664
Values are presented as number (%).
jects (48.8%) answered ‘10-20 minutes’ while 15 subjects (36.6%) answered ‘less than 10 minutes’. For the subjective assessment on the food intake 15 subjects (36.6%) answer- ed ‘I eat a lot’; 16 subjects (39%), ‘I eat appropriate amount’;
and 10 subjects (24.4%) ‘I eat small amount’. 34 subjects (82.9%) answered they do not smoke while 28 subjects (68.3%) answered they do not exercise. There was no sig- nificant differences in smoking and drinking but the mal- nourished group had a lower exercise rate and a higher smoking and drinking alcohol rate. Generally, item on the diet or life habit not showed significant differences between the groups (Table 3).
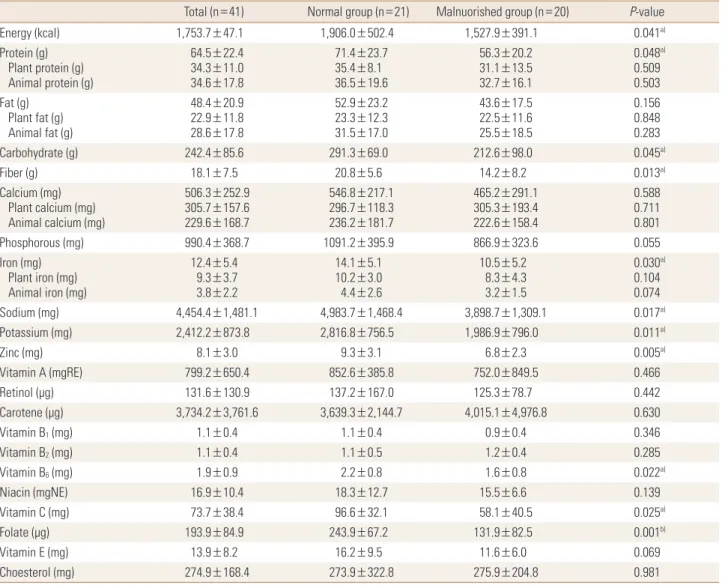
4. Daily nutrient intake evaluation according to the nutritional status of the patients
The average energy intake was 1,753.7 kcal; 1,906 kcal in the normal group and 1,527.9 kcal in the malnourished group. The energy intake was significantly lower in the mal- nourished group (P<0.05). Intake of protein (P<0.05), car- bohydrate (P<0.05), fiber (P<0.05), iron (P<0.05), sodium (P<0.05), potassium (P<0.05), zinc (P<0.01), vitamin B6
(P<0.05), vitamin C (P<0.05), and folate (P<0.01) were significantly lower in the malnourished group. The intakes of fiber, calcium, vitamin B2, vitamin C and folate were low- er than the recommended nutritional intakes for Koreans in the normal group. The intakes of fiber, calcium, zinc, vi-
tamin B1, vitamin B2, niacin, vitamin C and folate were low- er than the recommended nutritional intakes for Koreans in the malnourished group (Table 4).
5. The correlation with BMD and variables according to nutritional status of the patients
The correlation with as T-score of lumbar spine and all related variables by nutritional status were analyzed and only significant results were presented in Table 5. The BMD of malnourished group showed correlation with TSF (P<
0.01), CRP (P<0.05), calcium (P<0.01), phosphorous (P<
0.05), iron (P<0.05), animal iron (P<0.05), zinc (P<0.05) and vitamin B1 (P<0.05) in their diet while the normal group showed correlation with TSF (P<0.05), phosphorous (P<
0.05) and iron (P<0.05) in their diet (Table 5).
DISCUSSION
Over the last few decades, the incidence of IBD has in- creased in Asian countries.[12] The present study investi- gated the correlation of bone density and the rate of mal- nutrition with the nutrient intake of patients with IBD. A nutritional approach to determining the treatment plan for IBD is considered very important. Therefore, it is first necessary to determine the nutritional status of patients in
Table 4. Daily nutrient intake according to nutritional status
Total (n=41) Normal group (n=21) Malnuorished group (n=20) P-value
Energy (kcal) 1,753.7±47.1 1,906.0±502.4 1,527.9±391.1 0.041a)
Protein (g) Plant protein (g) Animal protein (g)
64.5±22.4 34.3±11.0 34.6±17.8
71.4±23.7 35.4±8.1 36.5±19.6
56.3±20.2 31.1±13.5 32.7±16.1
0.048a) 0.509 0.503 Fat (g)
Plant fat (g) Animal fat (g)
48.4±20.9 22.9±11.8 28.6±17.8
52.9±23.2 23.3±12.3 31.5±17.0
43.6±17.5 22.5±11.6 25.5±18.5
0.156 0.848 0.283
Carbohydrate (g) 242.4±85.6 291.3±69.0 212.6±98.0 0.045a)
Fiber (g) 18.1±7.5 20.8±5.6 14.2±8.2 0.013a)
Calcium (mg) Plant calcium (mg) Animal calcium (mg)
506.3±252.9 305.7±157.6 229.6±168.7
546.8±217.1 296.7±118.3 236.2±181.7
465.2±291.1 305.3±193.4 222.6±158.4
0.588 0.711 0.801
Phosphorous (mg) 990.4±368.7 1091.2±395.9 866.9±323.6 0.055
Iron (mg) Plant iron (mg) Animal iron (mg)
12.4±5.4 9.3±3.7 3.8±2.2
14.1±5.1 10.2±3.0 4.4±2.6
10.5±5.2 8.3±4.3 3.2±1.5
0.030a) 0.104 0.074
Sodium (mg) 4,454.4±1,481.1 4,983.7±1,468.4 3,898.7±1,309.1 0.017a)
Potassium (mg) 2,412.2±873.8 2,816.8±756.5 1,986.9±796.0 0.011a)
Zinc (mg) 8.1±3.0 9.3±3.1 6.8±2.3 0.005a)
Vitamin A (mgRE) 799.2±650.4 852.6±385.8 752.0±849.5 0.466
Retinol (μg) 131.6±130.9 137.2±167.0 125.3±78.7 0.442
Carotene (μg) 3,734.2±3,761.6 3,639.3±2,144.7 4,015.1±4,976.8 0.630
Vitamin B1 (mg) 1.1±0.4 1.1±0.4 0.9±0.4 0.346
Vitamin B2 (mg) 1.1±0.4 1.1±0.5 1.2±0.4 0.285
Vitamin B6 (mg) 1.9±0.9 2.2±0.8 1.6±0.8 0.022a)
Niacin (mgNE) 16.9±10.4 18.3±12.7 15.5±6.6 0.139
Vitamin C (mg) 73.7±38.4 96.6±32.1 58.1±40.5 0.025a)
Folate (µg) 193.9±84.9 243.9±67.2 131.9±82.5 0.001b)
Vitamin E (mg) 13.9±8.2 16.2±9.5 11.6±6.0 0.069
Choesterol (mg) 274.9±168.4 273.9±322.8 275.9±204.8 0.981
Mean±standard deviation (SD), a)P<0.05, b)P<0.01.
Table 5. Correlation coefficients between bone mineral density and variables according to nutritional status
TSF CRP Calcium P Iron Animal iron Zinc Vitamin B1
Normal group 0.575a) 0.053 0.346 0.550a) 0.484a) 0.318 -0.107 -0.077
Malnuorished group 0.680b) 0.554a) 0.607b) 0.471a) 0.628a) 0.506a) -0.496a) -0.506a)
a)P<0.05, b)P<0.01.
TSF, triceps skin fold thickness; CRP, C-reactive protein; P, phosphorous.
order to provide diet intervention or nutritional support.
[13] Of the subjects in this study, 48.8% were malnourished and weight loss since the 6 months in the malnourished group was significantly higher compared to normal group.
More patients with Crohn’s disease were malnourished than those with ulcerative colitis, but the difference was not significant. This result is related to that of another study which reported Crohn’s disease affects small bowels and causes more severe malnutrition.[14] Most blood test re-
sults were within the normal range in our patients; howev- er, although the hemoglobin level was below normal (13- 17 g/dL) overall, it was substantially lower in the malnour- ished group. In an acute response test, CRP levels were sig- nificantly higher in the malnourished group. In a previous study, anemia, a generally observed symptom of nutrition- al deficiency, was found in 16% outpatient subjects and 68% inpatient subjects.[15] Another study reported that anemia needs to be treated before other symptoms as it can
decrease the performance of routine activities and lower quality of life.[16] The results of the present study did not show any significant difference in anemia between the two groups with different nutritional status, although the he- moglobin level was low in the malnourished group. In gen- eral, more proactive management is required to maintain the hemoglobin level in the normal range.
Many epidemiologic studies have reported decreased bone density in IBD, and this association was considered closely related to vitamin D deficiency, systemic inflamma- tion, or use of oral steroids.[17,18] The risk of fractures in- creases with disease activity. Despite this, most patients do not receive bone-protective treatment. A previous study recommended effective screening and treatment for high- risk patients in order to prevent IBD.[19] Bone density re- sults showed that the average bone density was -0.60±
1.32 g/cm2 for the lumbar spine and -0.40±1.45 g/cm2 for the femoral neck. In the present study, the decrease in bone density was greater in the malnourished group than in the normal group as determined by the World Health Organi- zation osteoporosis criteria, but the difference was not sig- nificant. Further, the decrease in bone density of 41.5% re- ported in the Korean IBD patients in our study was lower than the 63.3% cited by Park et al.[20] It was difficult to ac- curately compare between our study and the study by Park et al.[20] because of the different set of subjects and dis- ease period. Nonetheless, both studies showed that bone density testing and active management from the early stages of diagnosis are necessary to prevent long-term complications of IBD.
As part of their usual dietary habit, about half the sub- jects in our study had irregular meals and skipped break- fast, but the difference between groups was not signifi- cant. The malnourished group also had a higher propor- tion of patients with drinking and smoking habits and a lower proportion of patients who exercised. Smoking af- fects the incidence and activity of IBD. Compared to non- smokers, smokers require a higher dose of steroids and im- munosuppressive agents for Crohn’s disease treatment since smoking actually accelerates disease progression.
[21,22] Thus, from the treatment viewpoint, drinking and smoking should be strictly prohibited. Most IBD patients show nutrient deficiency, the malnourished group in our study as well showed lower intake of nutrients, especially energy, protein, carbohydrates, fiber, iron, sodium, potassi-
um, zinc, vitamin B6, vitamin C, and folate. The intake of calcium, zinc, vitamin B2, vitamin C, and folate was lower than the recommended amount for Koreans.[11] However, the average intake of energy, calcium, iron, and vitamin A intake was higher in this study than in a previous study by Kang[23] Considering the malabsorption in patients with IBD,[24-26] selection of the right food, well-balanced nutri- ent intake, and use of supplements depending on an indi- vidual’s nutrient intake are essential. In the statistical anal- ysis performed in the present study to confirm the factors correlated with bone density, the results showed that in- clusion of phosphorus and iron in the diet was correlated with the bone density in the normal group. On the other hand, nutrients such as calcium, phosphorous, iron, animal iron, zinc, and vitamin B1 showed a correlation with the bone density in the malnourished group.
Despite the evidence, the importance of nutritional factors as a cause of decreased bone density in IBD varies among studies.[20,27,28] However, more recommendations indi- cate that daily management is required to ensure adequate levels of calcium and vitamin D in the diet and to improve malnutrition to prevent osteoporosis.[1,29] Because of the limited number of subjects, this study was not able to rep- resent all IBDs. Nonetheless, our results were useful in con- firming the role of malnutrition, nutrient intake, and bone density in patients with chronic IBD. Our study also showed that patients with inflammatory bowel rarely receive treat- ment to improve bone density. Malnutrition among these patients was high, and about 40% had decreased bone den- sity and unbalanced nutrient intake.
On the basis of our findings, we recommend that malnu- trition be considered during the early stage of disease di- agnosis and a nutrition intervention be conducted to en- sure better treatment efficacy, improve quality of life, and prevent any complications related to IBD. Additionally, prop- er education about nutrition is required to prevent poor bone density, and multidisciplinary studies on this matter are required in the future.
ACKNOWLEDGMENTS
This work was supported by the Soonchunhyang Uni- versity Research Fund.
REFERENCES
1. Ali T, Lam D, Bronze MS, et al. Osteoporosis in inflammato- ry bowel disease. Am J Med 2009;122:599-604.
2. Cosnes J, Gower-Rousseau C, Seksik P, et al. Epidemiology and natural history of inflammatory bowel diseases. Gas- troenterology 2011;140:1785-94.
3. Ghishan FK, Kiela PR. Advances in the understanding of mineral and bone metabolism in inflammatory bowel dis- eases. Am J Physiol Gastrointest Liver Physiol 2011;300:
G191-201.
4. Song YJ, Paik HY, Yu CH. Factors affecting bone mineral density by dietary pattern group for some Korean college women. Korean J Nutr 2006;39:460-6.
5. Lee KM. Nutrition in inflammatory bowel disease. Korean J Gastroenterol 2008;52:1-8.
6. Prince A, Whelan K, Moosa A, et al. Nutritional problems in inflammatory bowel disease: the patient perspective. J Crohns Colitis 2011;5:443-50.
7. D'Haens G, Sandborn WJ, Feagan BG, et al. A review of ac- tivity indices and efficacy end points for clinical trials of medical therapy in adults with ulcerative colitis. Gastroen- terology 2007;132:763-86.
8. Stange EF, Travis SP, Vermeire S, et al. European evidence based consensus on the diagnosis and management of Crohn’s disease: definitions and diagnosis. Gut 2006;55 Suppl 1:i1-15.
9. Detsky AS, McLaughlin JR, Baker JP, et al. What is subjec- tive global assessment of nutritional status? JPEN J Par- enter Enteral Nutr 1987;11:8-13.
10. Kanis JA, Melton LJ, 3rd, Christiansen C, et al. The diagno- sis of osteoporosis. J Bone Miner Res 1994;9:1137-41.
11. The Korean Nutrition Society. Dietary reference intakes for Koreans: first revision 2010. Seoul: The Korean Nutrition Society, Ministry of Health & Welfare, Ministry of Food and Drug Safety; 2010.
12. Prideaux L, Kamm MA, De Cruz PP, et al. Inflammatory bo- wel disease in Asia: a systematic review. J Gastroenterol Hepatol 2012;27:1266-80.
13. Massironi S, Rossi RE, Cavalcoli FA, et al. Nutritional defi- ciencies in inflammatory bowel disease: therapeutic ap- proaches. Clin Nutr 2013;32:904-10.
14. Carter MJ, Lobo AJ, Travis SP. Guidelines for the manage- ment of inflammatory bowel disease in adults. Gut 2004;
53 Suppl 5:V1-16.
15. Gomollon F, Gisbert JP. Anemia and inflammatory bowel diseases. World J Gastroenterol 2009;15:4659-65.
16. Gasche C, Lomer MC, Cavill I, et al. Iron, anaemia, and in- flammatory bowel diseases. Gut 2004;53:1190-7.
17. Bernstein CN, Seeger LL, Sayre JW, et al. Decreased bone density in inflammatory bowel disease is related to corti- costeroid use and not disease diagnosis. J Bone Miner Res 1995;10:250-6.
18. Jahnsen J, Falch JA, Aadland E, et al. Bone mineral density is reduced in patients with Crohn's disease but not in pa- tients with ulcerative colitis: a population based study. Gut 1997;40:313-9.
19. American Gastroenterological Association. American Gas- troenterological Association medical position statement:
guidelines on osteoporosis in gastrointestinal diseases.
Gastroenterology 2003;124:791-4.
20. Park JJ, Jung SA, Noh YW, et al. Analysis of risk factors for low bone mineral density in patients with inflammatory bowel disease. Korean J Gastroenterol 2010;55:237-44.
21. Cosnes J. Smoking, physical activity, nutrition and lifestyle:
environmental factors and their impact on IBD. Dig Dis 2010;28:411-7.
22. Russel MG, Volovics A, Schoon EJ, et al. Inflammatory bow- el disease: is there any relation between smoking status and disease presentation? European Collaborative IBD Study Group. Inflamm Bowel Dis 1998;4:182-6.
23. Kang EH. Nutritional state of the patients with Crohn’s dis- ease in Korea [master’s thesis]. Seoul: Ewha Womans Uni- versity; 2002.
24. Vagianos K, Bector S, McConnell J, et al. Nutrition assess- ment of patients with inflammatory bowel disease. JPEN J Parenter Enteral Nutr 2007;31:311-9.
25. Tighe MP, Cummings JR, Afzal NA. Nutrition and inflam- matory bowel disease: primary or adjuvant therapy. Curr Opin Clin Nutr Metab Care 2011;14:491-6.
26. Hartman C, Eliakim R, Shamir R. Nutritional status and nu- tritional therapy in inflammatory bowel diseases. World J Gastroenterol 2009;15:2570-8.
27. Silvennoinen JA, Karttunen TJ, Niemelä SE, et al. A controlled study of bone mineral density in patients with inflamma- tory bowel disease. Gut 1995;37:71-6.
28. Bernstein CN, Bector S, Leslie WD. Lack of relationship of calcium and vitamin D intake to bone mineral density in premenopausal women with inflammatory bowel disease.
Am J Gastroenterol 2003;98:2468-73.
29. Rodríguez-Bores L, Barahona-Garrido J, Yamamoto-Furu- sho JK. Basic and clinical aspects of osteoporosis in inflam-
matory bowel disease. World J Gastroenterol 2007;13:6156- 65.