ABSTRACT
Purpose: Many observational studies have reported a correlation between obesity and increased risk of thyroid malignancy. However, the relationship of obesity with aggressive features in papillary thyroid cancer (PTC) is controversial. We aimed to investigate whether the clinicopathological features of PTC are associated with obesity.
Methods: We reviewed the medical records of 210 PTC patients who were followed up over a period of 10 years and examined body mass index (BMI) and other biochemical and clinicopathological parameters. The relationships between BMI and these parameters were assessed by logistic regression models based on BMI quartile (Q). The mean follow-up duration was 135.6±14.8 (range, 120–151) months.
Results: BMI had a strong positive correlation with age (r=0.208; P=0.002) and tumor size (r=0.177; P=0.01). We also found that patients with a higher BMI tended to be older (P=0.011) and have elevated triglyceride concentration (P=0.006), fasting plasma glucose (P<0.001), and thyroid-stimulating hormone (P=0.035). According to pair-wise comparisons of BMI, tumor size was remarkably higher in patients in Q4 (overweight and obese) than in patients in Q2 (normal weight) (P=0.01). In a multivariable-adjusted model, higher BMI was consistently significantly associated with larger tumor size (odds ratio, 1.433; 95% confidence interval, 1.097–2.053; P=0.041). However, there was no significant difference in long-term disease status, such as recurrence, persistent disease, and disease-free status, by BMI (P=0.781).
Conclusion: Higher BMI (>26.4 kg/m2) was significantly correlated with larger tumor size, but not long-term disease status, in patients with PTC.
Keywords: Obesity; Body mass index; Thyroid cancer; Prognosis
INTRODUCTION
The global obesity prevalence has been increasing by approximately half a body mass index (BMI) unit per decade over the past three decades (1). The prevalence of various types of cancer has also increased during the same time period. There is a trend of an increase in the obese population in Asian countries, including Korea, due to westernized eating habits and lifestyle (2,3). Obesity is associated with an increased risk of a variety of different cancers, including esophageal, colon and rectum, breast, endometrium, kidney, and thyroid cancers
Original Article
Received: Aug 19, 2018 Revised: Aug 29, 2018 Accepted: Sep 5, 2018 Correspondence to Young Suk Jo
Department of Internal Medicine, Open NBI Convergence Technology Research Laboratory, Severance Hospital, Yonsei Cancer Center, Yonsei University College of Medicine, Seoul 03722, Korea.
E-mail: [email protected] Jandee Lee
Department of Surgery, Open NBI Convergence Technology Research
Laboratory, Severance Hospital, Yonsei Cancer Center, Yonsei University College of Medicine, Seoul 03722, Korea.
E-mail: [email protected]
*Min Kyeong Kim and Seung Hyuk Yim contributed equally to this work.
Copyright © 2018. Korean Association of Thyroid and Endocrine Surgeons; KATES This is an Open Access article distributed under the terms of the Creative Commons Attribution Non-Commercial License (https://
creativecommons.org/licenses/by-nc/4.0/).
ORCID iDs Min Kyeong Kim
https://orcid.org/0000-0002-0349-0194 Seung Hyuk Yim
https://orcid.org/0000-0001-6605-8393 Jandee Lee
https://orcid.org/0000-0003-4090-0049 Young Suk Jo
https://orcid.org/0000-0001-9926-8389
Min Kyeong Kim 1,*, Seung Hyuk Yim 2,*, Jandee Lee 2, Young Suk Jo 3
1 Department of Internal Medicine, Graduate School, Chungnam National University College of Medicine, Daejeon, Korea
2 Department of Surgery, Open NBI Convergence Technology Research Laboratory, Severance Hospital, Yonsei Cancer Center, Yonsei University College of Medicine, Seoul, Korea
3 Department of Internal Medicine, Open NBI Convergence Technology Research Laboratory, Severance Hospital, Yonsei Cancer Center, Yonsei University College of Medicine, Seoul, Korea
Association between Obesity and
Tumor Size in Patients with Papillary
Thyroid Cancer
Funding
Young Suk Jo was supported by a grant from the Korea Health Technology R&D Project through the Korea Health Industry Development Institute (KHIDI), funded by the Ministry of Health & Welfare, Republic of Korea (HI15C2334). Jandee Lee was supported by a National Research Foundation of Korea (NRF) grant funded by the Korea government (MEST) (NRF-2017R1D1A1A09000916).
Author Contributions
Conceptualization: Young Suk Jo, Jandee Lee;
Data curation: Min Kyeong Kim, Seung Hyuk Yim; Formal analysis: Min Kyeong Kim, Seung Hyuk Yim; Supervision: Young Suk Jo, Jandee Lee; Writing - original draft: Min Kyeong Kim, Seung Hyuk Yim, Jandee Lee, Young Suk Jo.
Conflict of Interest
No potential conflict of interest relevant to this article was reported.
(4,5). Furthermore, obesity can also drive cancer progression, and has been estimated to account for 14% of all cancer deaths in men and 20% in women in the United States (6). A positive correlation between BMI and the rate of mortality has been noted in certain types of cancer, including esophageal, colon and rectum, liver, gallbladder, pancreas, endometrium, ovary, breast, and kidney cancers (6,7).
Papillary thyroid cancer (PTC) has increased rapidly worldwide in the past few decades.
Exposure to ionizing radiation during childhood, family history, iodine intake, and diabetes are well-known genetic and environmental risk factors associated with thyroid carcinogenesis (3,8). Obesity has also been reported to be associated with an increased incidence of PTC (9,10). Furthermore, recent meta-analyses have indicated that a 5-kg/m2 increase in BMI is strongly associated with thyroid cancer (7).
Although a strong positive correlation between obesity and thyroid cancer has been epidemiologically reported, the underlying carcinogenic mechanism has not been fully evaluated. During obesity, biological mechanisms involving insulin, insulin-like growth factors, cytokines, inflammation, thyroid-stimulating hormone (TSH), sex steroids, sex steroid-binding globulin, and adipokines such as adiponectin and leptin may promote carcinogenesis (11,12). A few retrospective studies suggest that an increase in BMI is associated with aggressive clinical behaviors in PTC (12-14). However, in thyroid cancer, there is immense heterogeneity in tumor behavior between studies with regard to the association between obesity and tumor prognosis (10,15). In addition, these previous studies mainly analyzed western populations, with few studies being performed in Asia. Because the relationship between obesity and poor prognostic factors associated with PTC is still debatable, a large cohort study including Korean patients with long-term follow-up is needed.
The purpose of this study was to examine whether prognostic parameters in PTC are associated with obesity in a single Korean cohort. The BMI and prognostic parameters of patients with PTC who were followed up over a period of 10 years at a single institution were retrospectively reviewed.
MATERIALS AND METHODS
1. Study population
The medical records of patients diagnosed with PTC from January 2000 to December 2005 at the Chungnam National University Hospital (Daejeon, Korea) with at least 10 years' follow-up were retrospectively reviewed. In this study, only patients with a first primary PTC were included. The exclusion criteria were as follows: <18 years old; a prior history of cancer; exposure to ionizing radiation during childhood and/or adolescence; thyroid cancer in first-degree relatives; renal, liver, or heart failure; diabetes mellitus; alcohol or cigarette consumption; pregnancy; or receiving medications that affect body weight (e.g., steroids). Patients with no information on biochemical parameters (TSH, free thyroxine [FT4], triglyceride [TG] concentration, fasting plasma glucose [FPG], total cholesterol [TC], high-density lipoprotein-cholesterol [HDL-C], and low-density lipoprotein-cholesterol [LDL-C]) or data of anthropometric factors (height and weight) before surgery that were used as confounding variables were also excluded. We also excluded non-conventional variants of PTC, including follicular variant PTC, because variants of PTC might have a confounding effect on our study. Finally, 210 patients were eligible for analysis in this study.
We collected from the final pathology reports information related to tumor size,
extrathyroidal extension (ETE), bilaterality, multiplicity, lymphovascular invasion (LVI), and pathological subtype of PTC. The extent of the disease was measured in terms of tumor- node-metastasis (TNM) staging according to the Union for International Cancer Control/
American Joint Committee on Cancer (UICC/AJCC), 7th edition.
2. BMI calculation
At the baseline examination, weight and height were measured and BMI was calculated as weight in kilograms divided by height in meters squared (kg/m2). The height and weight of patients were measured at the time of operation. A 5-kg/m2 increase in BMI was used as a continuous variable in the initial models. At the same time, biochemical parameters and aggressive clinicopathological factors were analyzed.
Although the World Health Organization defines a BMI ≥25 as overweight and a BMI ≥30 as obese, most Asians, including Koreans, generally have a lower BMI and a higher percentage of body fat than Caucasians. Several modified BMI cut-off levels for Asians have been developed in Asian countries. However, there is currently no universal cut-off point for
“overweight” across all Asian populations. In this study, we created our own BMI model for the study cohort. The cut-off points for BMI divided the range of probability distribution into contiguous intervals with equal probabilities. We classified patients into 4 groups by BMI quartiles (Qs) as follows: Q1 (underweight or lower limit of normal, <22 kg/m2), Q2 (normal, 22–23.8 kg/m2), Q3 (upper limit of normal, 23.8–26.4 kg/m2), and Q4 (overweight and obese,
>26.4 kg/m2). We also performed an analysis using the 4 BMI groups in which each BMI group was used as the reference category.
3. Statistical methods
Quantitative parameters are expressed as the mean±standard deviation or as the number (percentage). Differences between mean values were analyzed using the Student's t-test or 1-way analysis of variance (ANOVA), when appropriate. Comparisons between groups were made using the chi-square test or linear-by-linear association, as indicated in table legends. Trends according to BMI category were assessed using one-way ANOVA or linear- by-linear association, as appropriate. Pearson's correlation coefficient was used to assess the association of 2 variables. The association between different variables and obesity was expressed in terms of the odds ratio (OR), with a 95% confidence interval (CI) (calculated by logistic regression) for multivariate analysis. P values <0.05 were considered statistically significant. All statistical analyses were performed using IBM SPSS Statistics 20.0 (SPSS Inc., Chicago, IL, USA).
RESULTS
1. Baseline characteristics and prognosis
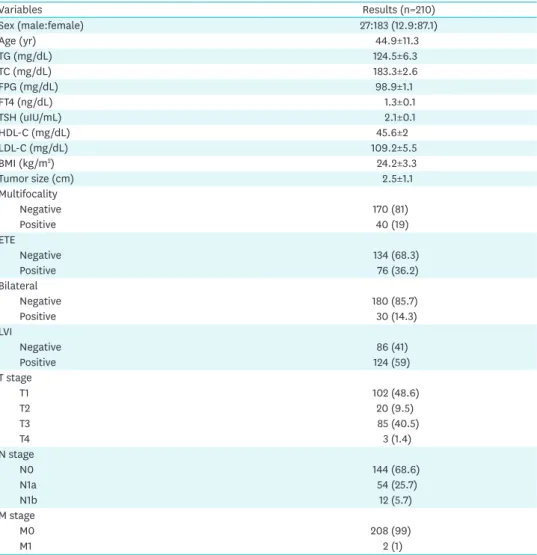
Patient characteristics are summarized in Table 1. A total of 210 PTC patients (183 women and 27 men) were enrolled. The mean age at diagnosis was 44.9±11.3 (range, 19–77) years.
The mean BMI was 24.2±3.3 kg/m2, and the patients were grouped into the BMI groups as follows: 53 (25.2%) (Q1) were underweight or the lower limit of normal, 52 (24.8%) (Q2) were normal, 53 (25.2%) were the upper limit of normal, and 52 (24.8%) were overweight or obese (Fig. 1). The mean tumor size was 2.5±1.1 (range, 0.8–3.5) cm, and 76 (36.2%) of the tumors had ETE. The prevalences of central neck lymph node (LN) metastasis and lateral neck LN
metastasis were 25.7% (n=54) and 5.7% (n=12), respectively. About 1% of the patients had distant metastasis.
The mean follow-up duration was 135.6±14.8 (range, 120–151) months, recurrence occurred in 6 patients (2.9%), and the site of recurrence was the regional cervical area for 5 patients and the lung for 1 patient. The lateral neck LN was the most common recurrent site (4/6), and there was one case of thyroid bed recurrence. Persistent disease was found in 4 patients (2%). There was no significant difference in long-term disease status, such as recurrence, persistent disease, and disease-free status, according to BMI (P=0.781) (data not shown).
2. Association between BMI and clinical parameters
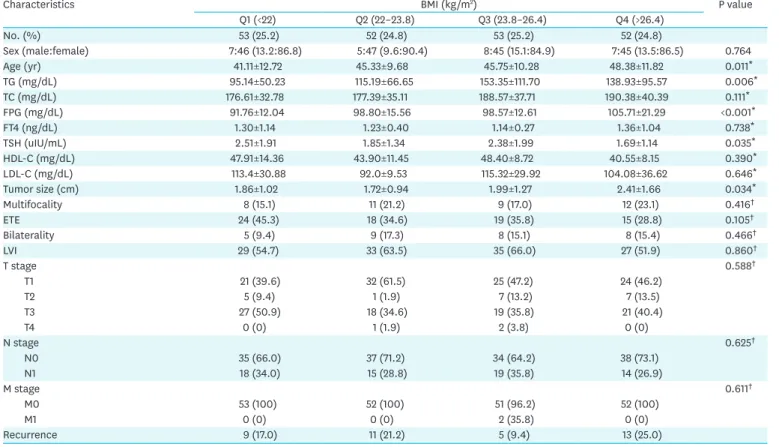
Table 2 shows the comparison of the biochemical parameters according to BMI. The higher BMI groups tended to be older (P=0.011) and have elevated TG (P=0.006), FPG (P<0.001), and TSH (P=0.035). In the overweight and obese group, a significant difference in aggressive tumor features was observed only for patients with larger tumors (P=0.034). We also Table 1. Baseline characteristics
Variables Results (n=210)
Sex (male:female) 27:183 (12.9:87.1)
Age (yr) 44.9±11.3
TG (mg/dL) 124.5±6.3
TC (mg/dL) 183.3±2.6
FPG (mg/dL) 98.9±1.1
FT4 (ng/dL) 1.3±0.1
TSH (uIU/mL) 2.1±0.1
HDL-C (mg/dL) 45.6±2
LDL-C (mg/dL) 109.2±5.5
BMI (kg/m2) 24.2±3.3
Tumor size (cm) 2.5±1.1
Multifocality
Negative 170 (81)
Positive 40 (19)
ETE
Negative 134 (68.3)
Positive 76 (36.2)
Bilateral
Negative 180 (85.7)
Positive 30 (14.3)
LVI
Negative 86 (41)
Positive 124 (59)
T stage
T1 102 (48.6)
T2 20 (9.5)
T3 85 (40.5)
T4 3 (1.4)
N stage
N0 144 (68.6)
N1a 54 (25.7)
N1b 12 (5.7)
M stage
M0 208 (99)
M1 2 (1)
Data are presented as number (%) or mean±standard deviation.
TG = triglyceride; TC = total cholesterol; FPG = fasting plasma glucose; FT4 = free thyroxine; TSH = thyroid- stimulating hormone; HDL-C = high-density lipoprotein-cholesterol; LDL-C = low-density lipoprotein-cholesterol;
BMI = body mass index; ETE = extrathyroidal extension; LVI = lymphovascular invasion.
performed an analysis using pair-wise comparison to compare each BMI group as a reference group. According to group-wise comparisons, age (Q1 vs. Q3 and Q1 vs. Q4), serum TG (Q1 vs. Q3 and Q1 vs. Q4), FPG (Q1 vs. Q2, Q1 vs. Q3, and Q1 vs. Q4), and TSH (Q1 vs. Q4) were significantly different between BMI groups. In terms of aggressive tumor parameters, only
10
15 20 25 30 35 40
0
Frequency (number)
BMI (kg/m2) 20
30
Fig. 1. Cut-off points of BMI divided by the range of probability distribution into contiguous intervals with equal quartiles, as follows: Q1 (<22 kg/m2), Q2 (22–23.8 kg/m2), Q3 (23.8–26.4 kg/m2), and Q4 (>26.4 kg/m2).
BMI = body mass index; Q = quartile.
Table 2. Comparison of the biochemical parameters and clinicopathological characteristics according to quartile of BMI (Q1–4)
Characteristics BMI (kg/m2) P value
Q1 (<22) Q2 (22–23.8) Q3 (23.8–26.4) Q4 (>26.4)
No. (%) 53 (25.2) 52 (24.8) 53 (25.2) 52 (24.8)
Sex (male:female) 7:46 (13.2:86.8) 5:47 (9.6:90.4) 8:45 (15.1:84.9) 7:45 (13.5:86.5) 0.764
Age (yr) 41.11±12.72 45.33±9.68 45.75±10.28 48.38±11.82 0.011*
TG (mg/dL) 95.14±50.23 115.19±66.65 153.35±111.70 138.93±95.57 0.006*
TC (mg/dL) 176.61±32.78 177.39±35.11 188.57±37.71 190.38±40.39 0.111*
FPG (mg/dL) 91.76±12.04 98.80±15.56 98.57±12.61 105.71±21.29 <0.001*
FT4 (ng/dL) 1.30±1.14 1.23±0.40 1.14±0.27 1.36±1.04 0.738*
TSH (uIU/mL) 2.51±1.91 1.85±1.34 2.38±1.99 1.69±1.14 0.035*
HDL-C (mg/dL) 47.91±14.36 43.90±11.45 48.40±8.72 40.55±8.15 0.390*
LDL-C (mg/dL) 113.4±30.88 92.0±9.53 115.32±29.92 104.08±36.62 0.646*
Tumor size (cm) 1.86±1.02 1.72±0.94 1.99±1.27 2.41±1.66 0.034*
Multifocality 8 (15.1) 11 (21.2) 9 (17.0) 12 (23.1) 0.416†
ETE 24 (45.3) 18 (34.6) 19 (35.8) 15 (28.8) 0.105†
Bilaterality 5 (9.4) 9 (17.3) 8 (15.1) 8 (15.4) 0.466†
LVI 29 (54.7) 33 (63.5) 35 (66.0) 27 (51.9) 0.860†
T stage 0.588†
T1 21 (39.6) 32 (61.5) 25 (47.2) 24 (46.2)
T2 5 (9.4) 1 (1.9) 7 (13.2) 7 (13.5)
T3 27 (50.9) 18 (34.6) 19 (35.8) 21 (40.4)
T4 0 (0) 1 (1.9) 2 (3.8) 0 (0)
N stage 0.625†
N0 35 (66.0) 37 (71.2) 34 (64.2) 38 (73.1)
N1 18 (34.0) 15 (28.8) 19 (35.8) 14 (26.9)
M stage 0.611†
M0 53 (100) 52 (100) 51 (96.2) 52 (100)
M1 0 (0) 0 (0) 2 (35.8) 0 (0)
Recurrence 9 (17.0) 11 (21.2) 5 (9.4) 13 (25.0)
Data are presented as number (%) or mean±standard deviation.
Q = quartile; BMI = body mass index; TG = triglyceride; TC = total cholesterol; FPG = fasting plasma glucose; FT4 = free thyroxine; TSH = thyroid-stimulating hormone;
HDL-C = high-density lipoprotein-cholesterol; LDL-C = low-density lipoprotein-cholesterol; ETE = extrathyroidal extension; LVI = lymphovascular invasion.
*P values were calculated by One-way ANOVA; †P values were calculated by linear-by linear association.
tumor size was remarkably higher in Q4 (overweight and obese) than in Q2 (normal weight) (P=0.01) (Table 3).
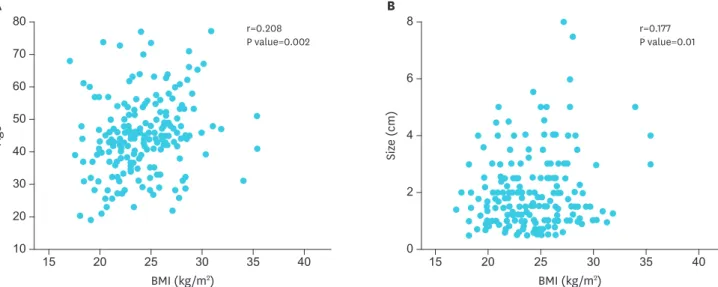
To avoid arbitrary categorization, we analyzed BMI as a continuous variable. We found a strong positive correlation between BMI and age (r=0.208; P=0.002) (Fig. 2A). In this series of patients, a significant correlation between BMI and tumor size was also noted (r=0.177;
P=0.001) (Fig. 2B).
Table 3. Pair-wise comparison of the basic characteristics and clinicopathological characteristics among the four subgroups of BMI in patients with thyroid cancer (P values)
Characteristics BMI (kg/m2)
Q1 vs. Q2 Q1 vs. Q3 Q1 vs. Q4 Q2 vs. Q3 Q2 vs. Q4 Q3 vs. Q4
Sex* (male:female) 0.563 0.780 0.969 0.394 0.539 0.811
Age† (yr) 0.059 0.041 0.003 0.827 0.152 0.227
TG† 0.104 0.002 0.006 0.054 0.165 0.522
TC† 0.908 0.087 0.059 0.123 0.084 0.814
FPG† 0.012 0.002 0.003 0.783 0.064 0.077
FT4† 0.771 0.482 0.837 0.302 0.516 0.247
TSH† 0.052 0.742 0.011 0.130 0.523 0.041
HDL-C† 0.716 0.931 0.205 0.535 0.752 0.060
LDL-C † 0.097 0.892 0.568 0.222 0.388 0.478
Tumor size† (cm) 0.464 0.568 0.043 0.221 0.010 0.147
Multifocality* 0.420 0.791 0.298 0.586 0.813 0.435
ETE* 0.265 0.323 0.081 0.895 0.527 0.443
Bilaterality* 0.235 0.374 0.355 0.758 0.791 0.967
LVI* 0.362 0.233 0.774 0.782 0.234 0.141
T stage* 0.075 0.426 0.354 0.323 0.363 0.916
T1 vs. T2–4 0.025 0.433 0.499 0.139 0.116 0.917
T1–2 vs. T3–4 0.137 0.242 0.278 0.745 0.687 0.936
T1–3 vs. T4 0.310 0.153 (−) 0.569 0.315 0.157
Lymph node metastasis*
N0 vs. N1 0.572 0.839 0.433 0.443 0.827 0.325
M stage* (−) 0.153 (−) 0.157 (−) 0.157
Q = quartile; BMI = body mass index; TG = triglyceride; TC = total cholesterol; FPG = fasting plasma glucose; FT4 = free thyroxine; TSH = thyroid-stimulating hormone;
HDL-C = high-density lipoprotein-cholesterol; LDL-C = low-density lipoprotein-cholesterol; ETE = extrathyroidal extension; LVI = lymphovascular invasion.
*P value calculated by Pearson χ2 test; †P value calculated byunpaired student's t-test.
r=0.177 P value=0.01
BMI (kg/m2) 6
4
2
0 8
40 35
30 25
20 15
Size (cm)
B
60 50 40
10 70 80
30 20
40 35
30 25
20 15
r=0.208 P value=0.002
BMI (kg/m2)
Age
A
Fig. 2. Correlation between BMI with a 5-kg/m2 increase and clinicopathologic factors in patients with papillary thyroid carcinoma. (A) Correlation between BMI and age. (B) Correlation between BMI and tumor size (r=Pearson's correlation coefficient).
BMI = body mass index.
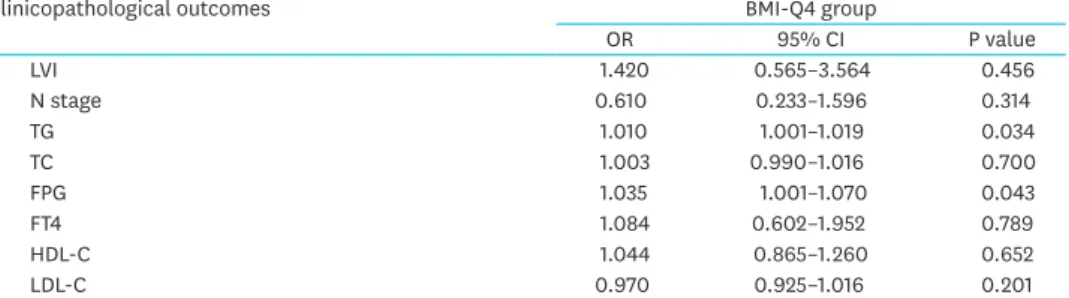
3. Multivariable analysis of the association between obesity and clinicopathological parameters
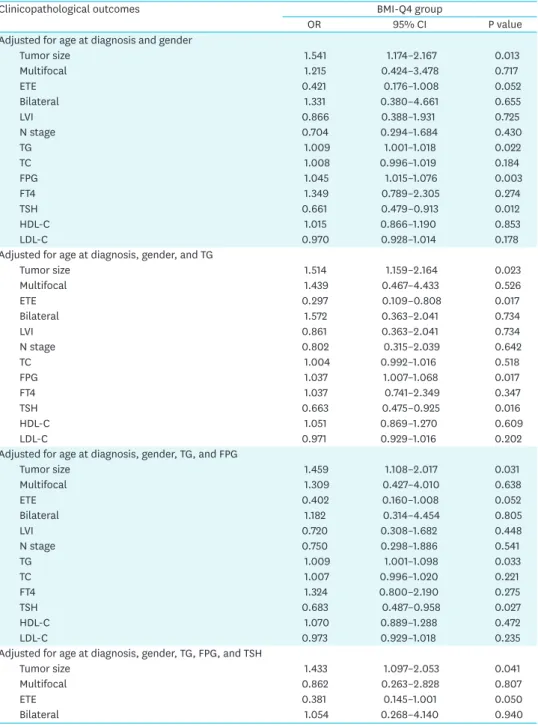
To determine how strongly obesity was associated with clinicopathological parameters in PTC, we calculated the OR to predict factors in overweight or obese patients (BMI-Q4) by multivariable analysis. Table 4 shows the risk of aggressive tumor parameters in the higher BMI group (Q4). Q4 was strongly correlated with larger tumor size compared to Q1 and Q2.
After adjusting for age and gender, the BMI-Q4 group had significantly higher odds of larger tumor size relative to the Q1 and Q2 groups (OR, 1.541; 95% CI, 1.174–2.167; P=0.013). After adjusting for TG, FPG, and TSH, higher BMI was consistently significantly associated with larger tumor size (OR, 1.433; 95% CI, 1.097–2.053; P=0.041).
Table 4. Multivariate analysis for BMI with aggressive clinicopathological features
Clinicopathological outcomes BMI-Q4 group
OR 95% CI P value
Adjusted for age at diagnosis and gender
Tumor size 1.541 1.174–2.167 0.013
Multifocal 1.215 0.424–3.478 0.717
ETE 0.421 0.176–1.008 0.052
Bilateral 1.331 0.380–4.661 0.655
LVI 0.866 0.388–1.931 0.725
N stage 0.704 0.294–1.684 0.430
TG 1.009 1.001–1.018 0.022
TC 1.008 0.996–1.019 0.184
FPG 1.045 1.015–1.076 0.003
FT4 1.349 0.789–2.305 0.274
TSH 0.661 0.479–0.913 0.012
HDL-C 1.015 0.866–1.190 0.853
LDL-C 0.970 0.928–1.014 0.178
Adjusted for age at diagnosis, gender, and TG
Tumor size 1.514 1.159–2.164 0.023
Multifocal 1.439 0.467–4.433 0.526
ETE 0.297 0.109–0.808 0.017
Bilateral 1.572 0.363–2.041 0.734
LVI 0.861 0.363–2.041 0.734
N stage 0.802 0.315–2.039 0.642
TC 1.004 0.992–1.016 0.518
FPG 1.037 1.007–1.068 0.017
FT4 1.037 0.741–2.349 0.347
TSH 0.663 0.475–0.925 0.016
HDL-C 1.051 0.869–1.270 0.609
LDL-C 0.971 0.929–1.016 0.202
Adjusted for age at diagnosis, gender, TG, and FPG
Tumor size 1.459 1.108–2.017 0.031
Multifocal 1.309 0.427–4.010 0.638
ETE 0.402 0.160–1.008 0.052
Bilateral 1.182 0.314–4.454 0.805
LVI 0.720 0.308–1.682 0.448
N stage 0.750 0.298–1.886 0.541
TG 1.009 1.001–1.098 0.033
TC 1.007 0.996–1.020 0.221
FT4 1.324 0.800–2.190 0.275
TSH 0.683 0.487–0.958 0.027
HDL-C 1.070 0.889–1.288 0.472
LDL-C 0.973 0.929–1.018 0.235
Adjusted for age at diagnosis, gender, TG, FPG, and TSH
Tumor size 1.433 1.097–2.053 0.041
Multifocal 0.862 0.263–2.828 0.807
ETE 0.381 0.145–1.001 0.050
Bilateral 1.054 0.268–4.140 0.940
DISCUSSION
Using data from thyroid cancer patients from a single center in Korea with long-term follow-up, we observed only tumor size significantly correlated with a high BMI. There was no association between BMI and any other aggressive oncological parameter. Furthermore, BMI was not a significant predictor of prognosis when evaluating recurrence and persistent disease status.
Obesity is now recognized as a major global health problem due to its association with increased risk of a variety of different cancer types. Recently, more epidemiologic studies have revealed a strong positive correlation between BMI and the risk of PTC (1-3). In a recent meta-analysis of 5 prospective studies in the United States, BMI was independently and positively associated with the risk of thyroid cancer in both men and women (16). Likewise, another cohort study revealed a potential link between early life factors related to growth and body weight and thyroid carcinogenesis (17). Recently, a large cohort study in Korea analyzed the national health insurance corporation cohort database including a total of 351,402 individuals (men: 181,709, women: 169,693) aged over 20 years (3). This study showed that the risk of thyroid cancer was significantly associated with obesity in men and women.
However, in subgroup analysis, the risk of thyroid cancer increased proportionally with increasing BMI in men, but not in women. There was a strong correlation with the prevalence of thyroid cancer among younger women (≤45 years), whereas only a weak relationship was observed in older women (>45 years).The authors proposed that estrogen was a significant risk factor contributing to thyroid cancer initiation, and that estrogen produced in the adipose tissue of postmenopausal women was more highly associated with thyroid cancer than the estrogen produced in the ovaries in premenopausal women. However, the mechanism of the interaction between obesity-related biological factors and the effects of these factors on PTC incidence remain unclear, and further study will be needed to confirm the correlation.
Although individual studies have made great efforts to evaluate the relationships between obesity and the oncological behaviors of PTC, they have provided conflicting results (10,12-15). Recently, a few studies have demonstrated that BMI is closely associated with aggressive oncologic features in PTC, such as tumor size, multiplicity, and advanced TNM stage (10,12-14). Particularly in women, BMI is strongly associated with ETE, multiplicity, and advanced T and TNM stages, indicating that obesity affects tumor behavior in PTC patients (12). Our study also showed
Clinicopathological outcomes BMI-Q4 group
OR 95% CI P value
LVI 1.420 0.565–3.564 0.456
N stage 0.610 0.233–1.596 0.314
TG 1.010 1.001–1.019 0.034
TC 1.003 0.990–1.016 0.700
FPG 1.035 1.001–1.070 0.043
FT4 1.084 0.602–1.952 0.789
HDL-C 1.044 0.865–1.260 0.652
LDL-C 0.970 0.925–1.016 0.201
BMI = body mass index; Q = quartile; OR = odds ratio; CI = confidence interval; ETE = extrathyroidal extension;
LVI = lymphovascular invasion; TG = triglyceride; TC = total cholesterol; FPG = fasting plasma glucose; FT4 = free thyroxine; TSH = thyroid-stimulating hormone; HDL-C = high-density lipoprotein-cholesterol; LDL-C = low-density lipoprotein-cholesterol.
Table 4. (Continued) Multivariate analysis for BMI with aggressive clinicopathological features
that a higher BMI was strongly associated with larger tumor size and older age. According to our multivariable analysis, higher BMI was consistently significantly associated with larger tumor size. Although the identification of aggressive tumor features, such as tumor size, as predictive factors was statistically significant in our study, there is the possibility of other residual confounding factors affecting our results. Various analyses of the correlation between obesity and the oncological behavior of PTC should be performed in a large prospective cohort.
As there is insufficient clinical information available concerning the long-term prognosis of PTC in obese patients, no consistent results have been obtained (10,12-15,18). In our study, there was no significant difference in long-term disease status, such as recurrence, persistent disease, and disease-free status, among the different BMI groups. However, whether these results derived from biologic causes or statistical bias remains unclear. As we were unable to confirm a relationship between poor prognosis and BMI, careful intervention is warranted, and additional clinical analyses are needed.
Our study has several strengths. First, our follow-up period (over 10 years) was longer than that of other studies examining prognosis, and we examined three types of disease status, namely, recurrence, persistent disease, and disease-free status. Second, although the number of study subjects was relatively low, this study was well-characterized in a single Korean cohort. Therefore, our study was designed by well-organized data collection in a single medical center with a uniform laboratory method.
This study also has several limitations. First, our study cohort included only a small number of subjects, and we did not have enough patients with extreme BMIs, such as BMI ≥30 kg/m2 or BMI
≤18.5 kg/m2. We created our own BMI model (BMI-Q group) for this study cohort. Therefore, our findings may not be applicable for extremely underweight or obese patients. Second, we did not have data on the obese or overweight duration. Further clinical data, including the percentage and distribution of body fat, physical activity, insulin resistance status, and inflammatory markers, would be helpful to discover potential biological mechanisms underlying the relationship between obesity and tumor behavior.
In our series, higher BMI (>26.4 kg/m2) was significantly correlated with larger tumor size.
However, the prognosis of thyroid cancer was not associated with obesity in this cohort. It is crucial to thoroughly identify the biological mechanisms underlying the relationship between obesity and tumorigenesis to understand how obesity affects PTC.
REFERENCES
1. Stevens GA, Singh GM, Lu Y, Danaei G, Lin JK, Finucane MM, et al. National, regional, and global trends in adult overweight and obesity prevalences. Popul Health Metr 2012;10:22.
PUBMED | CROSSREF
2. Haslam DW, James WP. Obesity. Lancet 2005;366:1197-209.
PUBMED | CROSSREF
3. Son H, Lee H, Kang K, Lee I. The risk of thyroid cancer and obesity: a nationwide population-based study using the Korea National Health Insurance Corporation cohort database. Surg Oncol 2018;27:166-71.
PUBMED | CROSSREF
4. Calle EE, Rodriguez C, Walker-Thurmond K, Thun MJ. Overweight, obesity, and mortality from cancer in a prospectively studied cohort of U.S. adults. N Engl J Med 2003;348:1625-38.
PUBMED | CROSSREF
5. Wolin KY, Carson K, Colditz GA. Obesity and cancer. Oncologist 2010;15:556-65.
PUBMED | CROSSREF
6. Reeves GK, Pirie K, Beral V, Green J, Spencer E, Bull D, et al. Cancer incidence and mortality in relation to body mass index in the Million Women Study: cohort study. BMJ 2007;335:1134.
PUBMED | CROSSREF
7. Renehan AG, Tyson M, Egger M, Heller RF, Zwahlen M. Body-mass index and incidence of cancer: a systematic review and meta-analysis of prospective observational studies. Lancet 2008;371:569-78.
PUBMED | CROSSREF
8. Allott EH, Hursting SD. Obesity and cancer: mechanistic insights from transdisciplinary studies. Endocr Relat Cancer 2015;22:R365-86.
PUBMED | CROSSREF
9. Han JM, Kim TY, Jeon MJ, Yim JH, Kim WG, Song DE, et al. Obesity is a risk factor for thyroid cancer in a large, ultrasonographically screened population. Eur J Endocrinol 2013;168:879-86.
PUBMED | CROSSREF
10. Paes JE, Hua K, Nagy R, Kloos RT, Jarjoura D, Ringel MD. The relationship between body mass index and thyroid cancer pathology features and outcomes: a clinicopathological cohort study. J Clin Endocrinol Metab 2010;95:4244-50.
PUBMED | CROSSREF
11. Hursting SD, Berger NA. Energy balance, host-related factors, and cancer progression. J Clin Oncol 2010;28:4058-65.
PUBMED | CROSSREF
12. Lee J, Lee CR, Ku CR, Kang SW, Jeong JJ, Shin DY, et al. Association between obesity and BRAFV600E mutation status in patients with papillary thyroid cancer. Ann Surg Oncol 2015;22 Suppl 3:S683-90.
PUBMED | CROSSREF
13. Kim HJ, Kim NK, Choi JH, Sohn SY, Kim SW, Jin SM, et al. Associations between body mass index and clinico-pathological characteristics of papillary thyroid cancer. Clin Endocrinol (Oxf ) 2013;78:134-40.
PUBMED | CROSSREF
14. Wu C, Wang L, Chen W, Zou S, Yang A. Associations between body mass index and lymph node metastases of patients with papillary thyroid cancer: a retrospective study. Medicine (Baltimore) 2017;96:e6202.
PUBMED | CROSSREF
15. Grani G, Lamartina L, Montesano T, Ronga G, Maggisano V, Falcone R, et al. Lack of association between obesity and aggressiveness of differentiated thyroid cancer. J Endocrinol Invest, in press 2018.
PUBMED | CROSSREF
16. Kitahara CM, Platz EA, Freeman LE, Hsing AW, Linet MS, Park Y, et al. Obesity and thyroid cancer risk among U.S. men and women: a pooled analysis of five prospective studies. Cancer Epidemiol Biomarkers Prev 2011;20:464-72.
PUBMED | CROSSREF
17. Kitahara CM, Gamborg M, Berrington de González A, Sørensen TI, Baker JL. Childhood height and body mass index were associated with risk of adult thyroid cancer in a large cohort study. Cancer Res 2014;74:235-42.
PUBMED | CROSSREF
18. Dieringer P, Klass EM, Caine B, Smith-Gagen J. Associations between body mass and papillary thyroid cancer stage and tumor size: a population-based study. J Cancer Res Clin Oncol 2015;141:93-8.
PUBMED | CROSSREF