Printed in the Republic of Korea
http://dx.doi.org/10.5012/jkcs.2012.56.1.020
Study of Dynamics of Allyl Chloride-2-Butanone Binary System Using Time Domain Reflectometry
Y. S. Sudake*, S. P. Kamble, S. S. Patil, P. W. Khirade, and S. C. Mehrotra†
Department of Physics, Dr. Babasaheb Ambedkar Marathwada University, Aurangabad-431004, (M.S.) India
†Department of Computer Science & IT, Dr. Babasaheb Ambedkar Marathwada University, Aurangabad-431004, (M.S.) India.
*E-mail: [email protected]
(Received June 21, 2011; Accepted November 25, 2011)
ABSTRACT. Complex permittivity spectra of Allyl Chloride (AC), 2-Butanone (2-BU) and their binary mixtures over the entire range of concentration were obtained using the Time Domain Reflectometry (TDR) technique in microwave frequency range at various temperatures. Static dielectric constant and relaxation time are obtained from complex permittivity spectra.
Density (ρ) and refractive index (nD) are also measured. These parameters are used to determine excess dielectric constant, excess inverse relaxation time, excess molar volume, excess molar refraction, polarity, Bruggeman factor and thermodynamic parameters viz. enthalpy of activation and entropy of activation. The values of static dielectric constant and relaxation time increases while density and refractive index decreases with the percentage of 2-Butanone in Allyl Chloride increases. Excess parameters were fitted to a Redlich-Kister equation.
Key words: Excess dielectric constant, Excess molar volume, Bruggeman factor, Polarity, Enthalpy and Entropy
INTRODUCTION
Dielectric studies on the binary mixtures (both polar- polar and polar-nonpolar) are important for understand- ing the intermolecular interaction in the mixture due to the dipole-dipole interactions and hydrogen bonding. In our laboratory, dielectric studies have been carried out extensively to understand intermolecular interactions and dynamics of the liquid mixtures using the Time Domain Reflectometry technique.1-4 In this work, we extend the study by inves- tigating properties like density, refractive index and polar- ity of mixture. The density and refractive index are also required for full understanding the non-ideal behaviour of mixtures, caused by intermolecular forces occurring when two or more components are mixed.5-8 Ketones (2-butanone) are important class of industrial chemicals with many sci- entific and industrial applications.6 2-butanone is aprotic solvent having carbonyl group C=O attached to different alkyl group CH3 and C2H5. Allyl chloride (AC) is a com- mon alkylating agent and useful in the manufacture of pharmaceuticals and pesticides due to presence of C=C double bond together with chlorine atom.9
Maharolkar et al.9 reported the decrease in dielectric constant with addition of allyl chloride in n-butanol due to decrease in effect of hydrogen bonding. Dharne et al.10,11 reported dielectric properties of allyl chloride with dim- ethylformide and alcohols using the TDR technique. The
effect of steric hindrance of 2-BU in the dielectric relax- ation of methanol with 2-BU system was reported by V.
Madhurima et al..12 Recently, Gilani et al.13 reported the nonlinear variation of dielectric constant of 2-BU with 2- butanol and cyclohexane due hetero interaction present between mixing components. Lomte et al.6 reported pos- itive excess molar volume of 2-BU with branched alcohol (2-propanol, 2-methyl-1-propanol, 2-butanol, and 2-methyl- 2-butanol) due to dispersion interaction between mixing components. As part of our research work, in the present paper, we reports the dielectric and thermodynamic prop- erties of allyl chloride with 2-butanone.
EXPERIMENTAL Chemicals
AR grade AC obtained commercially from FINE chem- ical Mumbai and 2-BU obtained from LOBA chemical Mumbai with purity 99% and were used without further purification. The solutions were prepared at different vol- ume percentage of 2-BU in AC in the step of 10% at room temperature. The concentrations were prepared for 5 ml solution at room temperature assuming ideal mixing behavior, with an accuracy ±0.0006 ml.
Experimental Section
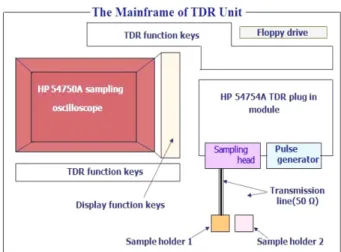
The Hewlett Packard HP54750A sampling oscilloscope
with HP54754A TDR plug-in module has been used. The block diagram of TDR unit is shown in Fig. 1. After observing TDR response for sample under study, the time window was kept to 5 ns and the SMA (standard military applications) sample cell with 1.35 mm effective pin length has been used. The sample cell holds the liquid under consideration. The physical dimensions of the sam- ple cell are very important, so one must be careful while designing the sample cell. The impedance of the cell should be matched with coaxial transmission line to which cell is connected. If there is impedance mismatch then unwanted reflections may disturb the wave thereby causing some errors in the measurements. The proper design of cell includes the inner conductor and outer conductor diam- eters. The length of the inner conductor is called as ‘pin length’ of the cell and is very important factor in anal- ysis. The sample length must be enough to avoid unwanted reflections. In total reflection method, the sample length must be long enough to produce an ade- quate difference signal but short enough to keep less complication of resonance effects at frequencies above the range of interest. The characteristics impedance of a coaxial line is given by
(1) This impedance for our transmission line is frequently 50Ω. Here ‘a’ is the diameter of inner conductor and ‘b’ is the inner diameter of outer conductor, ε is the relative per- mittivity of the dielectric between the conductors. Using Teflon and air and taking appropriate ‘a’, ‘b’, a cell can be designed to have a matching impedance of Z = 50 (for air ε
= 1 and for Teflon ε = 2.2). The SMA type cell has b = 3.5
mm. The inner conductor of SMA connector itself is con- sidered as ‘inner conductor’ and hex-nut acts as an outer conductor. Since these SMA connectors have already been designed for precise impedance 50Ω, a special design when used with high frequency is not required. The phys- ical length of inner conductor can be changed. When cell is filled with sample above the physical length of inner conductor, the fringing effect14,15 takes place. Due to the fringing field the effective pin length16 will not be equal to physical pin length. The effective electrical pin length will be more than the physical pin length. The accurate deter- mination of effective pin length‘d’ is very important for the accurate evaluation of dielectric parameters. It is found that for SMA type cell effective pin length16 is greater than actual physical length by 0.1-0.2 mm.
To reduce noise, time dependent response curve was averaged over 64 measurements taken and then stored in TDR oscilloscope memory with 1024 points per wave- form. Firstly, the response waveform for empty cell is acquired and stored in memory, and then secondly, the response waveform for sample is acquired and stored in other memory. The empty cell waveform is used as ref- erence waveform. Both the response waveforms are the reflected waveforms from the sample cell with open ter- mination transmission line. The data acquisition is carried out for 11 concentrations at 283.15, 293.15, 303.15, and 313 K. The temperature of sample was maintained at desired value, within accuracy limit of ±1oC, by circu- lating constant temperature water through heat insulating jacket surrounding sample cell.
At each time the response waveforms without sample and with sample were recorded. The time dependent response waveform without sample is referred to as R1(t) and with sample referred as Rx(t).
Density of pure components and their binary mixtures were measured by using Pycnometer at temperature 283.15 K, 293.15 K, 303.15 K and 313.15 K with an accuracy of 0.0001 gm/cm3.
Refractive index is measured at sodium D line by using thermostatic Abbe’s refractometer with an accuracy of 0.001. During the measurement of density and refractive index, constant temperature was maintained with an accu- racy of ±1oC
Data analysis
The time dependent data were processed to obtain com- plex reflection coefficient spectra ρ*(ω) over a frequency range of 10 MHz to 20 GHz by using Fourier transform17,18 as,
Z 138.2 ---logε 10b
a---
=
Fig. 1. Block diagram of TDR unit.
(2)
where p(ω) is Fourier transforms of [R1(t)-Rx(t)], q(w) is Fourier transforms of [R1(t)+Rx(t)], c is the velocity of light, ω is the angular frequency, d is effective pin length and j = .
The complex permittivity spectra ε*(ω) is obtained from reflection coefficient spectra p*(ω) by applying a bilinear calibration method.19 The complex permittivity spectra are fitted by the nonlinear least squares fit method to the Debye equation20 to obtain various dielectric parameters.
(3) where εs is the static permittivity(dielectric constant),
=nD2 is high frequency limiting permittivity at optical fre- quency, w is the angular frequency and t is the relaxation time of the system.
THEORY
The information regarding intermolecular interaction between two liquid may be obtained from excess dielec- tric constant (εsE) of mixtures. It is defined as,
(4) where X is mole fraction and suffixes m, 1, 2 represents mixture, liquid one and liquid two respectively. The excess permittivity may provide qualitative information about structure formation in the mixture as follows:
(i) εs = 0: indicates the liquids 1 and 2 do not interact and do not change their individual structural properties in the presence of other liquid.
(ii) εs < 0: indicates the liquids 1 and 2 interact in such a way that the total effective dipoles get reduced. The liq- uids 1 and 2 may form multimers leading to the less effec- tive dipoles.
(iii) εs > 0: indicates the liquids 1 and 2 interact in such a way that the total effective dipole increases. This may be due to breaking of multimers structure into monomer struc- ture in the presence of other molecule.
Similarly, excess inverse relaxation time is defined as (5) Excess inverse relaxation time represents average broad- ening of dielectric spectra. The inverse relaxation time
analogy is taken from spectral line broadening (which is the inverse of relaxation time) from the resonant spec- troscopy.21 Information regarding the dynamics of liquids 1 and 2 can be obtained from this excess inverse relax- ation time (1/τ)E as follows,
(i) (1/τ)E= 0: there is no change in the dynamics of liq- uids 1 and 2.
(ii) (1/τ)E< 0: the interaction of liquids 1 and 2 pro- duces a field such that the effective dipoles rotate slowly.
(iii) (1/τ)E> 0: the interaction of liquids 1 and 2 pro- duces a field such that the effective dipoles rotate rapidly, i.e. the field will co-operate in rotation of dipoles.
The excess molar volume (VE) and excess molar refrac- tion (RmE) are determined by equation (5) and (6) respec- tively,22
(6) (7) where Rm is molar refraction which is determined as,
(8) where X1 and X2 are mole fraction of AC and 2-BU respec- tively. ρ, ρ1 and ρ2 are density of mixtures, AC and 2-BU respectively. nD and Rm are refractive index and molar refraction of mixtures respectively. The R1m and R2m are molar refraction of pure AC and 2-BU respectively.
The Bruggeman factor ( fB)23 is another important param- eter which may be used as an indicator of solute-solvent interactions and is given by,
(9) where V is volume fraction, which is a qualitative mea- sure of volume of the solute in the mixture. The values of static dielectric constant corresponding to mixture, com- ponent A and component B are given by εsm, εsA and εsB
respectively.
Marshall24 expressed dielectric susceptibility (ε-1) to be isothermally proportional to the density (ρ) raised to a constant power and given in logarithmic form,
log(ε-1) = A + B logρ (10)
where A is intercept and B is slope. The value of A is directly proportional to polarity of liquids, while value of B is closely the same for similar-class of liquids while even being roughly the same for all the liquids.
ρ*( )ω c jωd --- p( )ω
q( )ω ---
=
1 –
ε*( ) εω ∞ εs–ε∞
1 j+ ωτ --- +
=
ε∞
εsE=( )εs m–[( )εs 1X1+( )εs 2X2]
1/τ
( )E=(1/τ)m–[(1/τ)1X1+(1/τ)2X2]
VE X1M1+X2M2
---ρ X1M1 ρ1
--- X2M2 ρ2 --- + –
=
RmE=Rm–(X1Rm1+X2Rm2)
Rm nD2–1 nD2+2
---Vm
=
fB εm–εB εA–εB
---
⎝ ⎠
⎛ ⎞ εA
εm
---
⎝ ⎠⎛ ⎞(1/3) 1 V–
= =
Thermodynamical energy parameters such as enthalpy of activation (∆Hτ) and entropy of activation (∆Sτ) are cal- culated by using Eyring rate equation25 and are reported in Table 6.
(11) where τ is relaxation time.
RESULTS AND DISCUSSIONS
Fig. 2 shows that complex permittivity spectra (ε' is real part, ε'' is imaginary part) of AC+2-BU system at tem- perature 293.15 K. The values of dielectric constant decreases in high frequency region than the low frequency region due to decrease in orientation polarization.26 The dielectric loss increases as frequency increases and it becomes maximum in 8-10 GHz region. The dielectric loss also increases as concentration of 2-BU increases in the mixture.
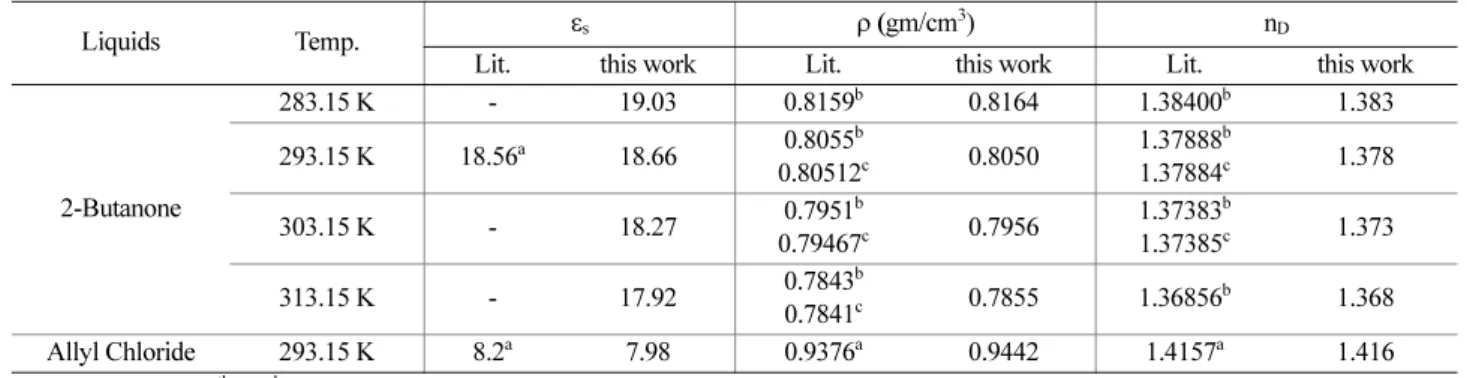
The estimated physical parameters of pure liquids are tabulated in Table 1 along with their literature values. It
can be seen from the table that the values determined from this methods are in good agreement with those available in the literature. The estimated values of static dielectric constant and relaxation time of binary mixtures of AC and 2-BU are tabulated in Table 2. The values of density and refractive index of binary mixtures of AC and 2-BU are tabulated in Table 3. The dielectric constant and relax-
τ h
kT---e
∆Hτ–T∆Sτ ---RT
⎝ ⎠
⎛ ⎞
=
Fig. 2. Complex permittivity spectra (ε' real and ε'' imaginary part) of Allyl Chloride with 2-Butanone at temperature 293.15 K.
Table 1. Comparison of physical parameters of Allyl Chloride and 2-Butanone
Liquids Temp. εs ρ (gm/cm3) nD
Lit. this work Lit. this work Lit. this work
2-Butanone
283.15 K - 19.03 0.8159b 0.8164 1.38400b 1.383
293.15 K 18.56a 18.66 0.8055b
0.80512c 0.8050 1.37888b
1.37884c 1.378
303.15 K - 18.27 0.7951b
0.79467c 0.7956 1.37383b
1.37385c 1.373
313.15 K - 17.92 0.7843b
0.7841c 0.7855 1.36856b 1.368
Allyl Chloride 293.15 K 8.2a 7.98 0.9376a 0.9442 1.4157a 1.416
aCRC Handbook 87th ed. bRene A Clara, cPietro Baraldi
Table 2. Dielectric constant and Relaxation time (ps) of Allyl Chloride with 2-Butanone Mole fraction
of 2-BU
283.15 K 293.15 K 303.15 K 313.15 K
εs τ(ps) εs τ(ps) εs τ(ps) εs τ(ps)
0 8.32(0) 12.75(1) 7.98(0) 12.42(2) 7.67(0) 11.69(2) 7.47(0) 11.40(1)
0.0913 10.44(0) 17.73(3) 9.81(0) 16.61(2) 9.46(0) 16.19(4) 9.14(0) 15.46(6)
0.1845 11.83(1) 21.50(1) 11.33(0) 21.09(0) 10.87(0) 20.39(6) 10.52(0) 20.06(4) 0.2794 12.88(1) 23.78(0) 12.45(1) 22.37(5) 11.95(1) 21.82(2) 11.70(0) 21.18(2) 0.3762 13.81(1) 25.71(2) 13.24(1) 24.61(6) 12.73(0) 23.67(1) 12.53(1) 23.19(3) 0.4750 14.64(0) 27.67(3) 13.90(0) 26.19(3) 13.43(1) 25.75(1) 13.17(0) 24.75(5) 0.5758 15.32(2) 30.21(4) 14.56(1) 26.68(5) 14.06(2) 27.48(0) 13.78(0) 26.79(6) 0.6786 15.95(1) 31.85(2) 15.23(1) 29.61(2) 14.69(1) 28.98(3) 14.45(1) 28.07(5) 0.7835 16.51(1) 32.42(1) 15.92(1) 31.27(3) 15.47(0) 30.45(4) 15.10(0) 29.69(4) 0.8906 17.41(0) 34.87(2) 17.00(0) 34.23(2) 16.55(1) 32.49(6) 16.11(1) 32.00(3)
1 19.03(0) 40.21(1) 18.66(0) 39.00(2) 18.26(0) 38.10(0) 17.92(0) 37.10(2)
Number in brackets denotes uncertainty in the last significant digit obtained by a least-square fit method eg. 26.82(4) mean 26.82±0.04.
ation time of the mixtures increase while density and refractive index decrease with increase in mole fraction of 2-BU. It is also observed that static dielectric constant, relaxation time, density and refractive index decrease with increase in temperature.
The values of excess dielectric constant of AC with 2- BU binary mixture is plotted in Fig. 3. The positive val- ues of excess dielectric constant in AC rich region indi- cate that dipole moment per unit volume increase with the parallel alignment of dipoles which contribute to increase in dielectric polarization. It may be leads to the formation of monomers and dimmers.3,27,28 The negative values of excess dielectric constant in 2-BU rich region indicate that dipole moment per unit volume decrease with the anti- parllel alignment of dipoles which contribute to decrease in dielectric polarization. It may be leads to formation of multimers.3,27,28
The values of excess inverse relaxation time are plotted in Fig. 4. The values of excess inverse relaxation time is negative over entire concentrations of 2-BU and for all temperature indicate slower rotation of dipoles.2,3,29 This
is due to dipole-dipole interaction (chlorine group (-Cl) of AC and carbonyl group (C=O) of 2-BU) produces a field in such way that the effective dipoles rotation is hindered.
The plot of excess molar volume (VE) of binary mix- tures is shown in Fig. 5. The positive value of VE indicates volume expansion in AC rich region. This is due to weak dipole-dipole interaction between AC and 2-BU mole- Table 3. Density (gm/cm3) and Refractive index of Allyl Chloride with 2-Butanone
Mole fraction of 2-BU
283.15 K 293.15 K 303.15 K 313.15 K
ρ nD ρ nD ρ nD ρ nD
0 0.9553 1.422 0.9442 1.416 0.9316 1.411 0.9201 1.407
0.0913 0.9378 1.418 0.9259 1.412 0.9134 1.407 0.9021 1.401
0.1845 0.9263 1.413 0.9148 1.407 0.9027 1.402 0.8916 1.397
0.2794 0.9177 1.410 0.9064 1.405 0.8944 1.399 0.8827 1.394
0.3762 0.9089 1.407 0.8973 1.402 0.8854 1.396 0.8725 1.391
0.4750 0.9018 1.404 0.8899 1.399 0.8780 1.393 0.8669 1.388
0.5758 0.8925 1.402 0.8802 1.397 0.8691 1.391 0.8576 1.386
0.6786 0.8753 1.398 0.8636 1.393 0.8522 1.388 0.8414 1.383
0.7835 0.8562 1.395 0.8443 1.390 0.8331 1.385 0.8224 1.380
0.8906 0.8383 1.390 0.8259 1.385 0.8153 1.379 0.8047 1.374
1 0.8164 1.383 0.8050 1.378 0.7956 1.373 0.7855 1.368
The uncertainty in density is ±0.0002
Fig. 3. Excess dielectric constant of Allyl Chloride with 2-Butanone. Fig. 4. Excess inverse relaxation time of Allyl Chloride with 2- Butanone.
Fig. 5. Excess molar volume (cm3 mol-1) of Allyl Chloride with 2-Butanone.
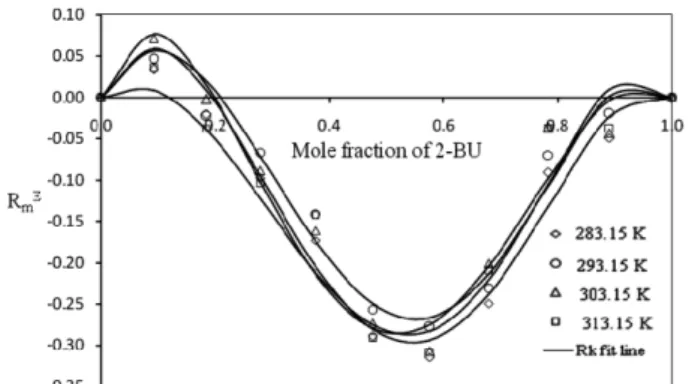
cules or rupture of dipole-dipole interaction in 2-BU mol- ecules. The negative value of VE indicates volume contraction in 2-BU rich region. This is due to strong dipole-dipole interaction between AC and 2-BU molecules and geo- metrical fitting of AC molecule into 2-BU molecules.6-8,30 The graphical representation of excess molar refraction (RmE) is shown in Fig. 6. The positive value of excess molar refraction in AC rich region indicates the weak intermolecular interaction between AC and 2-BU mole- cules. The negative value of excess molar refraction in 2- BU rich region indicates strong intermolecular interac- tion between AC and 2-BU molecules.30
The excess or deviation parameters were fitted to Redlich-
Kister equation (RK).31 The values of aj coefficient and standard deviation for excess dielectric constant, excess inverse relaxation time, excess molar volume and excess molar refraction are reported in Table 4.
Bruggeman factor of present system is plotted in Fig. 7.
According to equation (6), linear relationship is expected.
The values of Bruggeman factor deviate from ideal line for all temperatures. This non-linearity of curve indicates hetero interaction exist between AC and 2-BU.
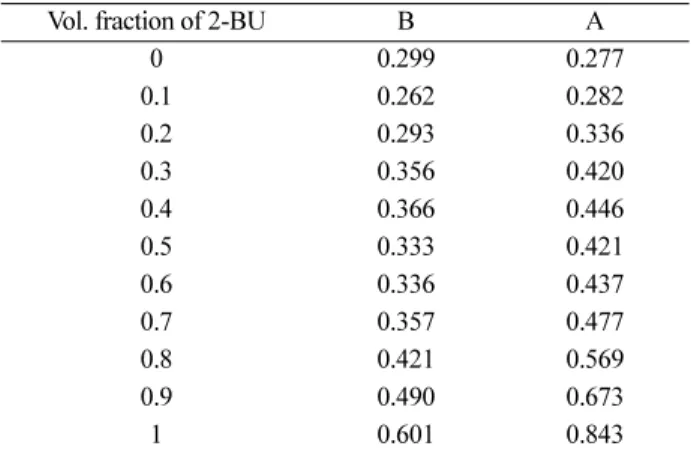
The plot of log (ε-1) versus log (ρ) of present system is shown in Fig. 8. The determined values of ‘A’(intercept) and ‘B’(slope) are tabulated in Table 5. It is observed that, increasing the values of ‘A’ suggest that polarity of mix- Fig. 6. Excess molar refraction (cm3 mol-1) of Allyl Chloride
with 2-Butanone.
Table 4. aj coefficients and standard error (σ) for excess dielectric constant, excess inverse relaxation time, excess molar volume and excess molar refraction
Parameters a0 a1 a2 a3 Error (σ)
283.15 K
εsΕ 5.3308 -6.7343 -0.9517 -7.5706 0.0249
(1/τ)E -0.0644 0.0516 -0.0620 0.0996 0.0004
VE -6.2666 -7.4253 7.0679 1.1269 0.1112
RmE -1.1585 -0.6144 2.1727 0.1645 0.0272
293.15 K
εsΕ 3.9414 -9.0921 -0.5434 -1.3863 0.0408
(1/τ)E -0.0589 0.0684 -0.0722 0.0532 0.0008
VE -6.3157 -7.3793 7.8892 1.2432 0.0945
RmE -1.0407 -0.6875 2.1852 0.5505 0.0297
303.15 K
εsΕ 3.2922 -8.8301 -0.6661 -1.6706 0.0181
(1/τ)E -0.0686 0.0626 -0.0745 0.1028 0.0006
VE -6.1655 -7.3587 8.6298 1.9108 0.1106
RmE -1.1393 -0.2636 2.4437 -0.3802 0.0380
313.15 K
εsΕ 3.4852 -8.7779 -2.6761 -1.5480 0.0454
(1/τ)E -0.0700 0.0694 -0.0758 0.0846 0.0010
VE -5.9731 -8.1724 8.3799 3.6549 0.1319
RmE -1.1327 -0.4811 1.9644 0.8572 0.0415
Fig. 7. Bruggeman factor (fB) of Allyl Chloride with 2-Butanone.
tures increases as mole fraction of 2-BU increases. The
‘A’ values of pure liquids (0.843 for 2-BU and 0.277 for AC) suggest that polarity of 2-BU greater than AC. The values of ‘B’ for pure liquids (0.299 for AC and 0.601 for 2-BU) suggest that two liquids are not the similar class of liquid.
The enthalpy of activation (∆Hτ) and entropy of acti- vation (∆Sτ) of present system is tabulated in Table 6. The value of ∆Hτdepends on internal energy of system and the external parameters such as the volume. In present sys- tem, the value of ∆Hτis positive over entire concentration range except for pure AC, so reaction occurred during complex formation is endothermic reaction i.e. heat is absorbed by binary system. Entropy of activation (∆Sτ) is a macroscopic property of a system that measures the microscopic disorder within the system. In the present sys- tem, the values of ∆Sτare negative over entire concentra- tion range. The negative values of entropy show that, there are fewer configurations possible in dipolar orientation in activated state than normal state. This may be due to the existence of dipole-dipole interaction; similar conclusion was reported by Sengwa et al.32 for ethylene glycol and propylene glycol mixtures.
CONCLUSION
The excess dielectric property shows parallel alignment of dipoles in AC rich region while there is antiparllel alignment of dipoles in 2-BU rich region. The negative value of excess inverse relaxation time indicates that the intermolecular interaction between AC and 2-BU produces a field such that effective dipoles rotate slowly.
The excess molar volume and excess molar refraction of binary system AC+2-BU supported to each other. These excess properties indicate weak dipole-dipole interaction between AC and 2-BU in AC rich region but strong dipole- dipole interaction between AC and 2-BU in 2-BU rich region. The Bruggeman factor also indicates intermolec- ular interaction exist between AC and 2-BU. The dielec- tric constant and polarity of mixtures supported to each other.
REFERENCES
1. Dharmalingam, K.; Ramachandran, K. K.; Sivagurunathan, P.; Undre, B. P.; Khirade, P. W.; Mehrotra, S. C. Mol.
Phys. 2006, 18(20), 2835.
2. Sivagurunathan, P.; Dharmalingam, K.; Ramachandran, K.; Undre, B. P.; Khirade, P. W.; Mehrotra, S. C. Physica B 2007, 387, 203.
3. Undre, P.; Helambe, S. N.; Jagdale, S. B.; Khirade, P. W.;
Mehrotra, S. C. Pramana J. Phys. 2007, 68, 851.
4. Pawar V. P.; Mehrotra, S. C. J. Mol. Liq. 2002, 95, 63.
5. Baraldi, P.; Giorgini, M. G.; Manzini, D.; Marchetti, A.;
Tassi, L. J. Sol. Chem. 2002, 31(11), 873.
6. Lomte, S. B.; Bawa, M. J.; Lande, M. K.; Arbad, B. R.
J. Chem. Eng. Data 2009, 54, 127.
7. Clara, R. A.; Marigliano, A. C. G.; Solimo, H. N. J. Chem.
Thermodynamics 2008, 40, 292.
8. Ortega, J.; Paz-Andrade, M. I.; Rodriguez-Nunez, E.;
Fig. 8. Polarity of Allyl Chloride with 2-Butanone.
Table 5. Polarity of Allyl Chloride with 2-Butanone
Vol. fraction of 2-BU B A
0 0.299 0.277
0.1 0.262 0.282
0.2 0.293 0.336
0.3 0.356 0.420
0.4 0.366 0.446
0.5 0.333 0.421
0.6 0.336 0.437
0.7 0.357 0.477
0.8 0.421 0.569
0.9 0.490 0.673
1 0.601 0.843
Table 6. Enthalpy (∆Hτ) and Entropy (∆Sτ) of Allyl Chloride with 2-Butanone
Volume fraction of 2-BU ∆Hτ (KJmol-1) ∆Sτ (KJmol-1K-1)
0 -0.033 -0.036
0.1 1.377 -0.033
0.2 2.045 -0.032
0.3 2.010 -0.033
0.4 1.825 -0.034
0.5 2.151 -0.033
0.6 2.189 -0.034
0.7 2.559 -0.033
0.8 2.900 -0.032
0.9 2.904 -0.033
1 2.068 -0.037
Jimenez, E. Can. J. Chem. 1985, 63, 3354.
9. Maharolkar, A. P.; Sudke, Y. S.; Kamble, S. P.; Tidar, A.
L.; Murugkar, A. G.; Patil, S. S.; Khirade, P. W.; Mehrotra, S.
C. Int. J. Chem. 2010, 2(2), 250.
10. Dharne, G. M.; Maharolkar, A. P.; Patil, S. S.; Khirade, P.
W.; Mehrotra, S. C. Int. J. Pharma and Bio Sci. 2010, 1(2), 1.
11. Dharne, G. M.; Maharolkar, A. P.; Khirade, P. W.; Patil, S.
S.; Mehrotra, S. C. Mat. Sci. Res. India 2008, 5(2), 391.
12. Madhurima, V.; Viswanathan B.; Murthy, V. R. K. Phys.
Chem. Liq. 2006, 44(5), 563.
13. Gilani, A. G.; Paktinat, N.; Moghadam, M. J. Chem. Thermo- dynamics 2011, 43, 569.
14. Gemert, M. J. C. van, Adv. Mol. Relaxation Processes 1974, 6, 123.
15. Bertolini, D.; Cassettari, M.; Salvetti, S.; Tombari, E.;
Veronesis, S. Rev. Sci. Instrum. 1990, 61, 12.
16. Berberian, J. G.; King, E. J. Non-Cryst. Solids 2002, 305, 10.
17. Shannon, C. E. Proc. IRE. 1949, 37, 10.
18. Samulan, H. A. Proc. IRE. 1951, 39, 175.
19. Cole, R. H.; Berbarian, J. G.; Mashimo, S.; Chryssikos, G.; Burns, A.; Tombari, E. J. Appl. Phys. 1989, 66, 793.
20. Debye, P. Polar Molecules; Chemical Catalog: New York,
1929.
21. Mehrotra, S. C.; Boggs, J. E. J. Chem. Phys. 1977, 66, 5306.
22. Bruggeman, D. A. G. Ann. Phys. (Leopz.) 1935, 5, 636.
23. Putintsev, N. M.; Putintsev, D. N. Russian J. Phys. Chem.
2006, 80(12), 1949.
24. Marshall, William L.; Nature Proceedings. hdl: 10101/npre.
2474, 2008.
25. Glasstone, S.; Laidler, K. J.; Erying, H. The Theory of Rate Process; McGraw-Hill: New York, 1941.
26. Hill, N. E.; Vaughan, W. E.; Price, A. H.; Davis, M. Dielec- tric Properties and Molecular Behavior; Van Nostrand:
London, 1969.
27. Sengwa, R. J.; Khatri, V.; Sonkhla, S. J. Sol. Chem. 2009, 38, 763.
28. Sengwa, R. J.; Sonkhla, S.; Khatri, V. J. Mol. Liq. 2010, 151, 17.
29. Sivagurunathan, P.; Dharmalingam, K.; Ramachandran, K.;
Undre, B. P.; Khirade, P. W.; Mehrotra, S. C. Main Group Chem. 2005, 4(3), 235.
30. Gupta, M.; Vibhu, I.; Shukla, J. P. Phy. Chem. Liq. 2010, 48(4), 415.
31. Redlich, O.; Kister, A. T. Ind. Eng. Chem. 1948, 40, 345.
32. Sengwa, R. J. J. Mol. Liq. 2003, 108/1-3, 47.