Printed in the Republic of Korea
http://dx.doi.org/10.5012/jkcs.2011.55.6.919
Synthesis and Spectroscopic Characterization of Manganese(II), Iron(III) and Cobalt(III) Complexes of Macrocyclic Ligand. Potential
of Cobalt(III) Complex in Biological Activity
Abdou S. El-Tabl*, Mohamad M. E. Shakdofa†, and Ahmed M. A. El-Seidy† Department of chemistry, Faculty of Science, El-Menoufia University, Shebin El-Kom, Egypt.
*E-mail: [email protected]
†Inorganic Chemistry Department, National Research Center, P.O. 12622 Dokki, Cairo, Egypt (Received July 13, 2011; Accepted September 22, 2011)
ABSTRACT. A new series of manganese(II), iron(III) and cobalt(III) complexes of 14-membered macrocyclic ligand, (3,6, 10,13,16,19-hexaazabicyclo[6.6.6]icosane-1,8-diamine) have been prepared and characterized by elemental analyses, IR, UV- VIS, 1H- and 13C- NMR spectra, magnetic susceptibilities, conductivities, and ESR measurements. Molar conductance mea- surements in DMF solution indicate that the complexes are electrolytes. The ESR spectrum for cobalt(III) complex in CD3OD+10%D2O after exposure to 60Co-γ-rays at 77 K using a 0.2217 M rad h-1 vicrad source showed g⊥>g||>ge, indicating that, the unpaired electron site is mainly present in the dz2orbital with covalent bond character. In this case, the ligand hyper- fine tensors are nearly collinear with γ-tensors, so there is no major tendency to bend. Therefore, little extra delocalization via the ring lobe of the dz2 orbital occurs. However, the ESR spectrum in solid state after exposure to 60Co-γ-rays at 77 K showed g||>g⊥>ge, indicating that, the unpaired electron site is mainly present in the dx2-y2ground state as the resulting spec- trum contains a large number of randomly oriented molecules provided that, the principle directions of g and A tensors. Man- ganese (II) complex 2, [H12LMn]Cl4.2H2O, showed six isotropic lines characteristic to an unpaired electron interacting with a nucleus of spin 5/2, however, iron(III) complex 3, [H12LFe]Cl5.H2O, showed spectrum of a high spin 57Fe (I=1/2), d5 con- figuration. The geometry of these complexes was supported by elemental analyses, IR, electronic and ESR spectral studies.
Complex 1 showed exploitation in reducing the amount of electron adducts formed in DNA during irradiation with low radi- ation products.
Key words: Macrocyclic complexes, Spectral studies, magnetism,60Co-γ-rays on metal complexes and DNA
INTRODUCTION
There has been considerable interest in the chemical properties, structures and coordination behaviors of polyazamacrocyclic compounds because they can play an important role in various fields such as in biological, med- ical chemistry, catalysis and chemical industry.1-6 In general, chemical properties and structures of such compounds are strongly influenced by the nature of encapsulated metal ion and the nature and number of functional groups. The polyazacrocycle chelates can be used in the determination of certain cation levels in cells and tissues. The size of the macrocycle ring is selective towards different metal cat- ions in biological systems. Copper(II) and nickel(II) com- plexes of polyazamacrocycles bearing pendent amide groups have been prepared and characterized.4,5,7 Cop- per(II) complexes of 14-membered tetraza macrocyclic compounds bearing pendent N-CH2CH2CONH2 groups have been prepared and spectrally investigated.6 Encap- sulated transition metal complexes are also of consider-
able importance in biological studies since they have very high binding constants, meaning that the possibility of releasing of the metal cations is negligibly small. Also, there is no easy access for active ligands such as hydrogen peroxide, and hence fenton type reactions to occurs, thereby reducing potential toxicity. A long term aim of this study was to find transition metal complexes having high non- localized, positive charges and high stability for two redox states of the metal ion. It seemed possible that, some of the H10L complexes that were designed and studied.8-10 would be suitable for biological studies. Generally, macrocyclic complexes are of the synthetic flexibility involved in their preparation which allows for systematic variation in param- eters such as ring size, the nature of the donor atoms and the steric and electronic effects associated with the groups located on the periphery of the macrocyclic ring.11 Increas- ing interest in the macrocyclic metal complexes as model compounds for active sites in enzymes comprising corrin or porphyrin moieties has resulted in various preparative routes to such compounds. Earlier work had demonstrated
that use of a difunctional macrocycle in such reactions resulted in the production of polymers that were highly cross-linked and hence insoluble.12 The aim of this pre- liminary study was the production of manganese(II), iron(III) and cobalt(III) complexes of 14-membered mac- rocyclic ligand, (3,6,10,13,16,19-hexaazabicyclo[6.6.6]
icosane-1,8-diamine) containing a single reactive NH3+
functional site. Our other interest lies in finding efficient radiation protection agents for nuclear DNA. One approach is to make use of the results.8,13 that obtained using ESR spectroscopy at low temperatures, which suggest that DNA effectively ionizes, giving initially, radical-cations centered on the purine bases (A,G) and radical-anions centered on the pyrimidine bases (C, T). We are designing agents which will rapidly reverse this process before irre- versible events make this impossible. Thus, we require an agent that can redox cycle, such as Co(III)/Co(II) and Fe(III)/Fe(II) complexes. However, this agent must have a high DNA affinity, but must not bind too strongly, since it is required to read the DNA searching for damage sites.
EXPERIMENTAL
All chemicals and solvents were reagent grade and used as received, C, H, N, Cl and M analysis were determined at the analytical Unit of Cairo University, Egypt (Table 1).
The complexes were dried in the air. IR spectra (as KBr pellets) and (as nujol mull between CsBr prisms) were recorded on a Perkin-Elmer 681 spectrophotometer. Elec- tronic spectra in 200-900 nm region were recorded on a Perkin-Elmer 550 spectrophotometer. 1H-and 13CNMR spectra were obtained with a Perkin-Elmer R32-90 MHz spectrometer using TMS as internal standard. Magnetic susceptibilities were measured at 25oC by Gouy method using mercuric tetrathiocyanato-cobaltate(II) as the mag- netic standard. Diamagnetic corrections were estimated from Pascal’s constant. The magnetic moment suscepti- bilities were calculated from the following equation µeff = 2.84×/(χmcorr×T)1/2. Molar conductances were measured on a Tacussel type CD6NG conductivity bridge using 10-3 M DMF. The ESR spectra of the complexes at room tem- perature and in CD3OD+D2O (10%) in the form of small
beads at 77 K were measured using a varian E-109 spec- trometer. The cobalt(III) complex and DNA molecules were exposed to 60Co-γ-rays at 77 K using a 0.2217 M radh-1 dose for 5 h (Leicester University, England). DPPH was used as the marker.
Preparation of macrocyclic complexes
Preparation of [Co(en)3]Cl3: [Co(en)3]Cl3 was pre- pared and resolved by conventional procedures.13
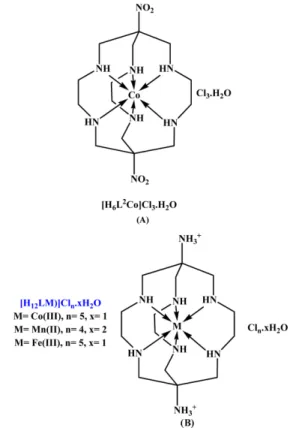
Preparation of [H6LCo]Cl3.H2O: The cobalt(III) com- plex [H6LCo]Cl3.H2O, H6L=1,8-dinitro-3,6,10,13,16,19- hexaazabi-cyclo[6.6.6]icosane (Fig. 1A) was prepared and characterized previously.8 Nitromethane (190 g) was added to a solution of [Co(en)3]Cl3 (163 g) in water (5 mL) and the solution stirred until the CH3NO2 had completely
Table 1. Suggested formulation, color and elemental analyses of complexes
Suggested formulation Color Found(Calcd.)
M C H N Cl
[H12LCo]Cl5.H2O (C14H36N8CoCl5.H2O) Yellow-Orange 10.25(10.33) 29.38(29.46) 6.76(6.71) 19.80(19.63) 30.96(31.06) [H12LMn]Cl4.2H2O (C14H36N8MnCl4.2H2O) Yellow 10.11(10.00) 30.55(30.61) 7.30(7.34) 19.92(20.40) 25.73(25.82) [H12LFe]Cl5.H2O (C14H36N8FeCl5.H2O) Violet 10.21(9.84) 29.48(29.62) 6.40(6.75) 19.56(19.74) 31.28(31.23) Fig. 1. (A) The suggested formulation of the cobalt(III) complex of 1,8-dinitro-3,6,10,13,16,19-hexaazabi-cyclo[6.6.6]icosane [H6L2Co]Cl3.H2O. (B) The suggested formulation of the cobalt (III), manganese(II) and iron(III) complexes of 3,6,10, 13,16,19- hexaazabicyclo[6.6.6]-icosane-1,8-diamine.
dissolved. Aqueous HCHO solution (1300 g, 37%) and Na2CO3 (80 g) were then added and stirring was contin- ued until the Na2CO3 had dissolved. The solution became warm and darkened in color. The solution was left to stand at room temperature for 5 hours, a copious precipitate of orange, needle-like crystals formed. The product was col- lected, washed with a little ice-cold water and dried in air.
The complex was added gradually to hot 3 M HCl (1500 mL), mixing of the solution formed with ethanol (1500 mL), and cooling on ice. Yielded 156 g (69%).
Preparation of [H12LCo]Cl5.H2O: [H6LCo]Cl3.H2O (40 g) was dissolved in water (2 L) and the solution deox- ygenated with nitrogen. Under vigorous string and main- tenance of a nitrogen blanket, zinc duct (40 g) was added, followed by concentrated HCl (200 mL) drop by drop, stirring was continued for 2 hours after the acid addition was complete. The orange solution was warmed on the steam bath for 20 min. and then absorbed on a 20 cm × 8 cm diameter column of H+ Dowex 50 WX2 cation-exchange resin. The column was washed with water (2 L) and 1 M HCl (2 L, to remove Zn2+) and the orange complex then eluted with 3 M HCl. The eluted volume was reduced under vacuum until crystallization commenced and dep- osition was complete by addition of ethanol. The complex was recrystallized as yellow-orange crystals by dissolu- tion in warm 1 M HCl. Addition of a few drops of ethanol and slow cooling (yield 30 g).
Preparation of [H12LMn]Cl4.2H2O: This complex was prepared by extracting cobalt ion from the cage using 8-hydroxyquinoline as follows: In a 3-necked 250 mL round bottomed flask quipped with a condenser, a stirrer and an inlet tube for nitrogen, [H12LCo]Cl5.H2O(11.49 g) was dissolved in water (75 mL), NaOH (1.6 g) was added to neutralize it and the solution was purged with nitrogen.
To this was added a 2 % alcoholic solution of 8-hydrox- yquinoline.14 The mixture was heated to 60-65oC while stirring under a blanket of nitrogen until the light-brown amorphous cobalt oxinate became crystalline. The latter was allowed to settle at room temperature, filtered off on a sintered-glass. The filtrate was concentrated on water bath; the equimolar concentration of MnCl2.4H2O in eth- anol (30 cm) was added drop wise. The reaction solution was refluxed for 2 hours and the complex formed was fil- tered off, washed several times with ethanol and dried in air.
Preparation of [H12LFe]Cl5.H2O: This complex was prepared in ethanol-water solvent from the 1:1 molar ratio reaction of the ligan with FeCl3.4H2O using the procedure described above. This complex was washed several times with warm ethanol and dried in air. The formulae of the
complexes, colors and the elemental analyses are col- lected in Table 1.
RESULTS AND DISCUSSIONS
Cobalt(III) complexes
The cobalt(III) complex [H6L2Co]Cl3.H2O, gave strong absorption bands characteristic of the NO2 groups at 1555 and 1353 cm-1 and the electronic spectrum in 0.1 M HCl shows two peaks with λmax=473.5 nm (ε=146 M-1cm-1) and λmax=343.5 nm (ε=124 M-1cm-1). The reduction of NO2 groups was made using zinc dust under nitrogen atmosphere to give cobalt(III) complex [H12LCo]Cl5. H2O. This complex was prepared and characterized by elemental analyses (Table 1), magnetic moment, molar conductivity, electronic and IR spectral studies and ESR measurements. The suggested structure is shown in Fig. 1B.
The IR spectrum of this complex shows a broad absorp- tion at 3070 cm-1 characteristic to +NH3.15 The bands cor- responding to NO2 groups were absent, a broad band appearing in the high energy region at ca 3500-3410 cm-1 assignable to NH group.16,17 The appearance of two bands at 2680 and 2720 cm-1 characterized to CH2 group. The molar conductance is 330 Ω-1cm2Mol-1, indicates electro- lytic nature of this complex.18,19 Also, this complex is dia- magnetic, confirms cobalt(III) species.17 The electronic spectrum was measured in nujol mull and in 0.1 M HCl. In nujol mull, the complex shows several bands at 370, 480 and 510 nm. The first one is within the ligand and the other peaks are assigned to 1A1g→1T2g and 1A1g→1T1g transi- tions respectively, which are typical of octahedral com- plexes.20-22 However, in 0.1 M HCl solution, the complex exhibits absorption bands at λmax=475 nm (ε=149 M-1cm-1) and λmax=344 nm (ε=130 M-1cm-1), which confirm the octahedral geometry.8 The 1H-NMR spectrum shows the characteristic protons in their expected chemical shift regions. In D2O (after N deuteration which was complete on dissolution) strong resonances were detectable at 2.84 (8H) ppm ascribed to the ethylenediamine methylene pro- tons, another two peaks appear at 3.43 and 3.53 ppm cor- responding to the methylene groups of the caps, a single symmetrical resonance appears at 7.8 ppm assigned to NH groups.20 The 13C-NMR of this complex. The spectrum shows two absorptions at 53.71 and 57.54 ppm. The former signal is ascribed to the carbon atoms of methylene groups in the ethylenediamine skeleton and the latter to the car- bon atoms in the caps.20,21
The cobalt(III) complex (1) was studied as a frozen solution in CD3OD+D2O (10%) at 77 K in the form of
small beads. The sample was exposed to 60Co-γ-rays at 77 K using a 0.2217 M rad h-1 Vicrad source for periods up to 3 h. The ESR spectrum in a frozen solution was recorded at 77 K. It is shown in Fig. 2A, and is characteristic of a low spin d7 configuration eight lines were observed from the interaction of the unpaired electron spin with 59Co (I=
7/2, 100% abundant). The lines wide are anisotropic. The spectrum exhibits two features, assigned as g|| and g⊥ which are characteristic of species with octahedral sym- metry. The ESR parameters are listed in Table 2. These parameters show a relation such that g⊥>g||>ge, which refers to the unpaired electron site being mainly in the dz2
orbital.23-27 with a slight distortion of the symmetry around the Z axis. In this case, the ligand hyperfine tensors are nearly collinear with g-tensors, so there is no major ten- dency to bend. Therefore, little extra delocalization via the ring lobe of the dz2 orbital occurs. The spectrum was recorded as a frozen solution in CD3OD+D2O (10%) at 4 K. No change in the spectrum was observed. On study- ing the complex in H2O at 77 K, an identical spectrum although or less intensity was obtained. Simulation of this spectrum gives a similar spectrum to the original Fig. 2B but there are some differences in the and A|| values. The low temperature irradiated sample was annealed at dif- ferent temperatures. The sample was studied at 77 K, no change in the spectra were observed when the sample was recorded at the annealing temperatures. The signal inten- sity decreases as the temperature increases. The signal was lost at ~115 K. This fact infers that, the stability of the
low spin state of cobalt(II) which is produced by γ-irra- diation depends much on the temperature. The rapid loss of ESR signals in the 115 K region is quit unexpected.
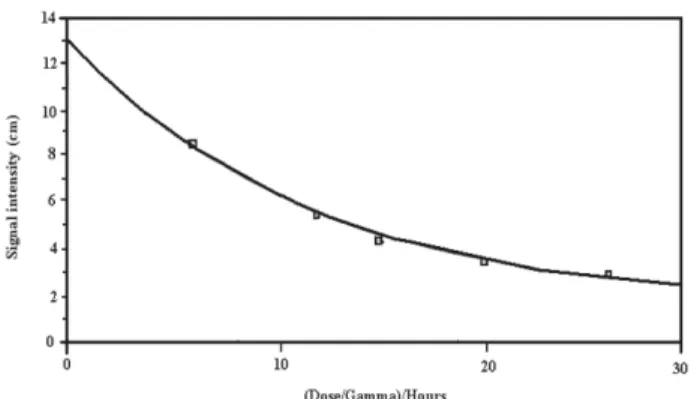
There is no apparent reason for actual loss of the Co(II) species and we favor the idea of a structural switch result- ing in an undetectably broad signal. This may be because the 77 K species is low spin (S=½) but this relaxes on annealing to give the high spin (S=3/2) species. Since the structural is very symmetrical. The zero fields splitting could be relatively small but sensitivity to thermal fluc- tuations gives a very broad feature. Attempts were made to study this irradiated complex using Q-band. Unfortu- nately, no ESR spectrum was observed, this is probably due to increasing the magnetic field.28 the lines broaden on increasing the magnetic field. The σ-bonding param- eter α2 of this complex (Table 2) shows that the bonding is appreciably covalent in nature.29-31 The attempt was made to study the radiation effect on the cobalt(III) complex at 77 K, by exposing the sample to 60Co γ- rays form a Vicrad source at a dose rate of ca. 0.2217 M rad h-1 periods up to ca. 35 h. The ESR spectrum was recorded every one hour under the same conditions at 77 K. It was found that, the amount of cobalt(II) species produced increase as γ-rays dose increase as shown in Fig. 3. The ESR spectrum of a polycrystalline sample at room and 77 K temperatures were recorded after irradiating the sample with 60Co γ-rays at a dose rate of ca. 0.2217 M rad h-1 for periods up to ca. 5 h at room temperature, no spectrum was observed even when recorded at 77 K. This may be that the electron transfer process was reversible at room temperature.
However, irradiation of a polycrystalline sample at 77 K gave an ESR spectrum which was characteristic of 59Co (I=7/2), a monomeric species. The spectrum is shown in Fig. 4, the spectrum shows g||>g⊥>ge, indicating octahe- dral structure with d(x2-y2) ground state.30 As the resulting spectrum contains a large number of randomly oriented molecules provided that, the principle directions of g and Fig. 2. (A) The ESR Spectrum of the [[H12LCo]Cl5.H2O in
CD3OD+D2O(10%) at 77 K. (B) Simulated Spectrum of the [H12LCo]Cl5.H2O.
Table 2. ESR parameters of [H12LCo]Cl5.H2O at 77 K
g|| g⊥ giso A|| A⊥ Aiso α2
2.188 2.197 2.194 38 69.5 59 0.83
Fig. 3. The effect of γ-rays on [H12LCo]Cl5.H2O complex.
A tensors. The parameters are g||=2.26, g⊥=2.05 with giso= 2.12 and A||=190 G, A⊥=70 G with Aiso=110 and α=0.86.
The g||-value indicates covalent bond character which confirms with α2-value.30-32 The low temperature irradi- ated powdered sample was annealed at room temperature.
The Sample was studied at 77 K, a broad signal was observed in the low field region as shown in Fig. 4. Once again attempts to record Q-band spectra of this complex were unsuccessful; this again, is probably due to the increase in the magnetic field or the effect of increased temperature.28
Manganese(II) complex
The manganese(II) complex (2), [H12LMn]Cl4.2H2O was prepared and characterized by elemental analyses (Table 1), magnetic moment, molar conductivity, elec- tronic and IR spectral studies and ESR measurements.
The suggested structure is shown in Fig. 1B.
The IR spectrum was made in nujol mull. As expected, it was similar to cobalt complex. The molar conductance is 260 Ω-1cm2 mol-1, indicating electrolytic nature of this compex.18,19 Also, the complex shows magnetic value 5.92 BM indicating high spin Mn(II) complex.33 The elec- tronic spectrum of this complex in nujol mull shows sev-
eral absorptions at 372, 450, 484 and 516 nm, the first one is due to the ligand and the other bands are corresponding to 6A1g→4Eg, 6A1g→4T2g and 6A1g→4T1g transition respec- tively, which are typical to octahedral Mn(II) complex.
However, in HCl, two absorptions were observed at λmax= 470 nm (ε=152 M-1cm-1) and λmax=448 nm (ε=119 M-1cm-1) which are characteristic of octahedral geometry.8
The ESR spectrum was studied in CD3O+D2O (10%) at 77 K in the form of small beads. The spectrum shows six isotropic lines characteristic of an unpaired electron inter- acting with a nucleus of spin 5/2. The g value is isotropic and is equal to 2.0036,23,34 the hyperfine coupling con- stant (Aiso) is equal to 90 G. There was a series of broad shoulders on the wings of the spectrum with a separation of ca. 22 G which come from forbidden quadruple effect.
The ESR spectrum is shown in Fig. 5. It was found that, the signal intensity of the manganese(II) complex increased linearly with increase in concentration between 0.005 M and 0.0175 M as shown in Fig. 6.
Iron(III) complex
The iron(III) complex (3), [H12LFe]Cl5.H2O was pre- pared and characterized by elemental analyses (Table 1), Fig. 4. (A) The ESR sSpectrum of the polycrystalline [H12LCo]
Cl5.H2O complex at 77 K. (B) Annealing spectrum at 77 K.
Fig. 5. The ESR spectrum of the [H12LMn]Cl4.2H2O complex in CDOD+D2O (10%) at 77 K.
Fig. 6. Shows the relation between Mn(II) concentration (M/L) with signal intensity (cm).
magnetic moment, molar conductivity, electronic and IR spectral studies and ESR measurements. The suggested structure is shown in Fig. 1B. The IR spectrum was made in nujol mull. As expected, it was similar to cobalt com- plex. The molar conductance is 320 Ω-1cm2mol-1, indi- cating electrolytic nature of this complex.18,19 Also, the complex shows magnetic value 5.83 BM indicating high spin Fe(III) complex.35 The electronic spectrum of this complex in nujol mull shows several absorptions at 370, 451, 482 and 510 nm, the respectively, which are typical to octahedral Fe(III) complex.36,37 However, in HCl, the complex exhibits two absorptions at λmax=471 nm (ε=150.9 M-1cm-1) and λmax=340 nm (ε=125 M-1cm-1) which are similar to octahedral iron(III) complexes. The ESR spec- trum was studied in CD3O+D2O (10%) at 77 K in the form of small beads. It is characteristic of a high spin 57Fe (I=½), d5, configuration. It gives a signal at g=4.4 which is similar to Fe3+ complexes.38 The ESR spectrum is shown in Fig. 7. This is not the actual g-value in the low field half of the zero field splitting feature (No hyperfine splitting was observed. The real g-value is around 2.0. The g-value (4.4) is the limit of extreme rhombic distortion. It was found that; increased gamma dose at 77 K tends to decrease the signal intensity. This means that the Fe2+ species was increased as shown in Fig. 8.
Potential of [H12LCo]Cl5.H2O complex in biologi- cal activity
The genetic fingerprint molecule in the replication of cells is deoxyribosenucleic acid, DNA. DNA is a long helical structure comprising two intertwined strands of identical arrangements of cytosine, guanine, adenine and thymine. Each strand is made of a pair of strings of phos- phodiester linkages to which are attached in regular pairs the four bases. The preponderance of negative charges from the many phosphate groups confers on the molecule a sheath of negative charges which gives it a high affinity for positive charges. Exposure of cells to ionizing radia- tions initiates a series of electron transfer reactions result- ing in the destruction, or at low doses, alteration of the DNA molecule. Replication of such altered DNA mole- cules invariably leads to the formation of aberrant cells, overproduction of cells, or underproduction of cells. In order to intercept the electron transfer reactions in DNA as a means of mitigating the deleterious effects of ionizing radiations, there is the need for substrates which might act as good electron capture reagents. Such molecules must also have the ability to add on the DNA molecules with- out any disruption of its native structure. The cobalt(III) complex 1 has a large positive charge due to the central metal ion and the eight nitrogen atoms; this property makes it highly reactive with DNA. Their suitability for electron- capture in any DNA-[H12LCo]Cl5.H2O complex may be inferred from the results of γ-radiation on cobalt complex.
A one-electron-capture event observed by the reduction of Co(III) to Co(II). The efficiency of this reaction may exploited in reducing the amount of electron adducts formed in DNA during irradiation with less radiation products, the degree of destruction of DNA is exploited to reduce and hence reduction of aberration in cells. It is also clear that using Co(III) complex in the presence of irra- diated DNA, we will be able to monitor the initially formed low-spin Co(II) complex using ESR spectroscopy. In the DNA studies this will be exploited by re-cooling after complete loss of DNA radical centers and re-irradiating to convert re-formed Co(III) into low spin Co(II) which is then an assay for the concentration of re-formed Co(III).
REFERENCES
1. Shiekh, R. A.; Shreaz, S.; Khan, L. A.; Hashmi, A. A. J.
Chem. Pharm. Res. 2010, 2, 172.
2. Hancock, R. D.; Reibenspies, J. H.; Maumela, H. Inorg.
Chem. 2004, 43, 2981.
3. Lichty, J.; Allen, S. M.; Grillo, A. I.; Archibald, S. J.; Hubin, T. J. Inorg. Chim. Acta 2004, 357, 615.
Fig. 7. The ESR spectrum of [H12LFe]Cl5.H2O complex in CD3OD +D2O (10%) at 77 K.
Fig. 8. The relation between Gamma dose (hours) with signal intensity (cm).
4. Siegfried, L.; Comparone, A.; Neuburger, M.; Kaden, T.
A. Dalton Trans. 2005, 30.
5. Liu, R.; Wu, L.; Feng, X.; Zhang, Z.; Li, Y.; Wang, Z.
Inorg. Chim. Acta 2007, 360, 656.
6. Kang, S. G.; Kim, N.; Jeong, J. H. Inorg. Chim. Acta 2008, 361, 349.
7. Bazzicalupi, C.; Bianchi, A.; Berni, E.; Galabi, L.; Giorgi, C.; Mariani, P.; Losi, P.; Valtancoli, B. Inorg. Chim. Acta 2002, 329, 93.
8. Geue, R. J.; Hambey, T. W.; Harrowfield, J. M.; Sarge- son, A. M.; Snow, M. R. J. Am. Chem. Soc. 1984, 106, 5478.
9. Comba, P.; Sargeson, A. M.; Enfalhardt, L. M.; Harrow- field, J. M.; White, A. M.; Horn, E.; Snow, M. R. Inorg.
Chem. 1985, 24, 2325.
10. Martin, L. L.; Martin, R. L.; Murray, K. S.; Sargeson, A.
M. Inorg. Chem. 1990, 29, 1387.
11. In Coordination Chemistry of Macrocyclic complexes;
Melson, G. A. Ed.; Plenum Press: New York, 1979.
12. Kimura, E. Pure Appl. Chem. 1986, 58, 1461.
13. Symons, M. C. R.; Taiwo, T.; Sargeson, A. M.; Aly, M.
M.; El-Tabl, A. S. Inorg. Chim. Acta 1996, 241, 5.
14. Vogel, A. I. A Text Book of Quantitative Inorganic Anal- ysis, 4th ed.; Longmans: London, 1978.
15. Nakamato, K. Infrared Spectra of Inorganic and Coordi- nation Compounds; Wiley-Interscience: New York, 1970; p 150.
16. El-Tabl, A. S.; El-Saied, F. A.; Al-Hakimi, A. N. Trans.
Met. Chem. 2007, 32, 689.
17. El-Tabl, A. S. Bull Korean Chem. Soc. 2004, 25, 1757.
18. El-Tabl, A. S.; Kasher, T. I.; El-Bahnasawy, R. M.; El- Monsef, I. A. Polish. J. Chem. 1999, 73, 245.
19. Geaey, W. J. Coord. Chem. Rev. 1971, 7, 81.
20. Plass, W.; El-Tabl, A. S.; Pohlmann, A. J. Coord. Chem.
2009, 62, 358.
21. Gao, E.; Bi, S.; Sun, H.; Liu, S. Synth. React. Inorg. Met.- Org. Chem. 1997, 27, 1115.
22. Lever, A. B. P. Inorganic Electronic Spectroscopy; Elsevier:
New York, 1968; pp 302, 306.
23. El-Tabl, A. S.; Kashar, T. I. Polish J. Chem. 1998, 72, 519.
24. Fujiwara, S.; Watanab, T.; Tadano, H. J. Coord. Chem.
1972, 1, 195.
25. Ozawa, T.; Hanaki, A. Inorg. Chim. Acta 1988, 153, 201.
26. Jones, R. D.; Summerville, D. A.; Basolo, F. Chem. Rev.
1979, 79, 139.
27. Symons, M. C. R.; Wilkinson, J. G. J. Chem. Soc. Dalton 1972, 1086.
28. Maher, J. P. J. Chem. Soc., A 1968, 2918.
29. Kuska, H. A.; Rogers, M. T. Coordination Chemistry, A.
E. Martell Ed.; Van Nostrand Reinhold: New York, 1971.
30. El-Tabl, A. S.; El-Saied, F. A.; El-Hakimi, A. N. J. Coord.
Chem. 2008, 61, 2380.
31. Kivelson, D.; Neiman, R. J. Chem. Phys. 1961, 35, 149.
32. El-Tabl, A. S.; El-Enein, S. A. J. Coord. Chem. 2004, 57, 281.
33. Gudasi, K. B.; Patil, S. A.; Vadavi, R. S.; Shenoy, R. V.;
Nethaji, M. Trans. Met. Chem. 2006, 31, 586.
34. Parihari, R. K.; Patel, R. K.; Patel, R. N. J. Ind. Chem.
Soc. 2000, 77, 339.
35. Murukan, B.; Mohanan, K. Trans. Met. Chem. 2006, 31, 441.
36. Sallam, S. A.; Orabi, A. S.; El-Shetary, B. A.; Lentz, A.
Trans. Met. Chem. 2002, 27, 447.
37. Singh, N. K.; Singh, S. B. Trans. Met. Chem. 2001, 26, 487.
38. Kedzie; R. W. Lyons, D. H.; Kestigian, M. Phys. Rev.
1965, 138(A), 918.
![Table 2. ESR parameters of [H 12 LCo]Cl 5 .H 2 O at 77 K](https://thumb-ap.123doks.com/thumbv2/123dokinfo/5299272.154486/4.892.87.427.146.380/table-esr-parameters-h-lco-cl-h-o.webp)
![Fig. 5. The ESR spectrum of the [H 12 LMn]Cl 4 .2H 2 O complex in CDOD+D2O (10%) at 77 K.](https://thumb-ap.123doks.com/thumbv2/123dokinfo/5299272.154486/5.892.101.409.150.568/fig-esr-spectrum-h-lmn-cl-complex-cdod.webp)