• 검색 결과가 없습니다.

Analysis of Cavity Pressure and Dimension of Molded Part According to V/P Switchover Position in Injection Molding

N/A
N/A
Protected

Academic year: 2021

Share "Analysis of Cavity Pressure and Dimension of Molded Part According to V/P Switchover Position in Injection Molding"

Copied!
8
0
0

로드 중.... (전체 텍스트 보기)

전체 글

(1)

Analysis of Cavity Pressure and Dimension of Molded Part According to V/P Switchover Position in Injection Molding

Jung Hwan Cho, Soon Yong Kwon, Hyung Jin Roh, Sung Hwan Cho, Su Yeon Kim * , and Min-Young Lyu *,†

Samyang Central R & D Center, 730 Daedeokdae-ro, Yuseong-gu, Daejeon 34055, Republic of Korea

*

Department of Mechanical System Design Engineering, Seoul National University of Science and Technology, 232 Gongneung-ro, Nowon-gu, Seoul 01811, Republic of Korea

(Received December 3, 2017, Revised December 13, 2017, Accepted December 14, 2017)

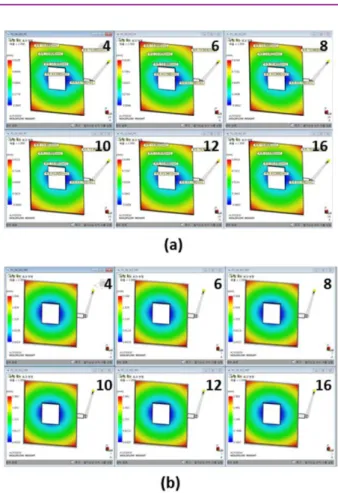
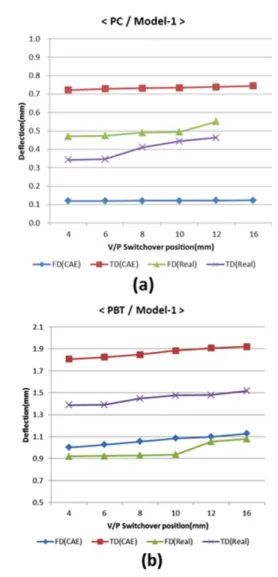
Abstract: In injection molding, the quality of an injection molded product varies greatly depending on the molding con- ditions. Many researche studies have been conducted on the quality analysis of molded parts according to the molding con- ditions such as injection pressure, injection temperature, and packing pressure. However, there have not been many studies on the V/P switchover timing. It is known that when a large pressure is applied to a cavity in the packing phase, the cavity pressure is most affected by the packing pressure. In addition, depending on the position (timing) of the packing pressure, it can have a direct influence on quality based on the shrinkage and dimensions of the molded parts. In this study, the change in pressure profile in the cavity according to the V/P switchover position is confirmed. A CAE analysis program (Moldflow) was used to simulate and analyze two models using the PC and PBT materials. In order to compare these results with the actual injection molding results, injection molding was performed for each V/P switchover position, and the correlation between simulation and experiment, especially for the shrinkage of molded parts, was evaluated.

Keywords: injection molding, V/P switchover, computer simulation, cavity pressure, deformation

Introduction

사출 성형이란, 성형하고자 하는 모양이 새겨진 금형 (cavity) 안에 용융된 수지를 고온 고압으로 주입하여 플라스 틱 제품을 성형하는 방법으로, 많은 플라스틱 제품을 생산하 는 가장 기본적인 방법이다.

1-3

사출 성형의 기본적인 특징으로는, 성형사이클이 짧고, 성 형 능률이 좋아 대량 생산이 가능하며, 광범위한 수지의 성형 을 할 수 있으며(열 가소성 수지, 열 경화성수지 모두 가능), 자동 제어화가 가능하여 인력의 낭비가 적으며, 복잡한 모양 이나 어려운 구조도 금형 설계를 통해 높은 정밀도로 표현 해 낼 수 있다.

4-6

이러한 사출 성형의 공정 조건은 여러 가지가 있는데, 수지 온도, 금형 온도, 사출압력, 사출 속도, 보압 절환 시점, 보압, 보압 시간 등으로 나눌 수 있다.

7

사출 성형 공정 중 보압 절 환(V/P switchover)이 있는데 이는 사출 속도(injection speed) 제어 하에서 압력(pressure) 제어로 넘어가는 지점을 의미하며 보압 절환 시점으로 표현한다. 이러한 보압 절환 시점은 성형 품의 수축이나 플래쉬(flash), 미성형 등의 외관 특성에 중요 한 영향을 미치게 된다. Figure 1의 (a)와 (b)에서는 각각 보

압 절환 시간이 늦은 경우와 빠른 경우의 압력 곡선이고, Figure 1 의 (c)와 (d)는 각각 보압 시간이 짧은 경우와 큰 보 압이 길게 작용한 경우의 압력 곡선을 도식적으로 나타낸 것 이다.

8-11

성형공정조건에 따른 연구는 다양하게 존재한다.

12-14

그러나 보압 절환 위치에 따른 연구는 미미하여 이에 관한 연 구가 필요하다.

15

본 연구에서는 다양한 보압 절환 위치에 따 른 캐비티 내 수지의 흐름 특성 및 성형품의 품질에 대해 해

Corresponding author E-mail: [email protected]

Figure 1. Pressure curve according to packing phase. (a) Late

packing, (b) Early packing, (c) Short packing time, (d) High

packing pressure and long packing time

(2)

양을 하고 있어 기본적인 유동 흐름을 확인 하기 쉬우며, 두 번째 모델은 같은 크기의 직사각형 안에 사각 홀이 존재하여 좀 더 복잡한 유동 흐름을 유도 할 수 있다.

Figure 3 은 본 연구에서 사용한 해석 모델의 메시(mesh) 형 상과 게이트 및 스프루, 런너를 나타낸다. 메시는 dual domain 으로 작성하였으며, 실제 사출금형 제작 도면과 일치하는 스

Figure 2. Two study models and dimensions (Model-1 : Plate model, Model-2 : Hole model).

Figure 3. 3D modeling of study model and mesh generation for computer simulation.

Figure 4. PVT curve for studied material. (a) PC, (b) PBT

Figure 5. Shear viscosity curve for studied material. (a) PC, (b)

PBT

(3)

본 해석 및 실험에 사용한 재료는 두 가지로, Polycarbonate (PC, TRIREX 3022L1-I2, SAMYANG) 와 Poly Butylene Terephthalate (PBT, TRIBIT 1503, SAMYANG) 이다. Figure 4 와 Figure 5에 본 연구에 사용한 두 수지의 PVT (pressure- volume-temperature) 선도와 점도 곡선이 나타나 있다. PVT는 온도 및 압력과의 함수 관계에 따라 재료의 비 체적(1/밀도) 을 설명하는 데이터로, PVT는 성형 범위 전체에 걸쳐 고분자 의 온도-압력 관계를 설명한다. 점도의 경우 재료의 점도는 유 동 능력을 측정하는 기준이다. 고분자 점도는 온도와 전단 변 형률(shear rate)에 따라 다르기 때문에 총 세가지 온도에서 전 단 변형률에 따른 점도를 나타내었다. 일반적으로, 고분자의 온도와 전단 변형률이 증가하면 점도가 감소하며 유동 능력 이 더 좋아진다는 것을 나타낸다.

3. Experiment condition

본 해석 및 실험에서는 두 가지 모델에 대해 두가지 재료 를 사용하여 해석 및 실험을 진행 하였다. 보압 절환에 따른 경향성을 비교하고자, Figure 6과 같이 사출 조건을 설정하였 다. 사출 온도는 PC의 경우 290

o

C, PBT 의 경우 260

o

C, 금형 온도는 80

o

C, 사출 속도는 50 mm/s, 1차 보압 및 시간은 10 MPa, 1 sec, 그리고 2차 보압 및 시간은 7 MPa, 2 sec로 하였 다. 보압 절환 위치는 다양하게 적용하여 4, 6, 8, 10, 12, 그 리고 16 mm로 하여 해석을 진행하였다.

이는 캐비티 내 수지가 각각 99, 95, 90, 85, 80, 그리고 70%

충진된 상태에서 보압으로 전환는 조건이다. 그래서 보압 절 환 위치가 4 mm인 경우는 보압 절환이 가장 느린 경우이고, 보압 절환 위치가 16 mm인 경우는 보압 절환이 가장 빠른 경 우이다.

해석은 해석 프로그램인 Moldflow를 사용하여 해석을 진행 하였다.

실제 사출 실험을 진행하고자 해석 모델과 동일한 치수를 가진 금형을 제작하여 사출을 진행하였으며(WOOJIN PLAIMM, TE110), 사출 조건은 해석 조건과 동일하게 진행하였다.

Figure 7 의 사출기를 이용해서 사출을 진행하였으며, Figure

8 의 금형을 이용하였다.

Results and Discussion

1. Simulation results

Figure 9~16 까지는 해석 결과를 보여주며 각 그림에서 상 단 왼쪽부터 오른쪽으로 보압 절환 위치가 4, 6, 8 mm이고 하 단 왼쪽부터 오른쪽으로는 보압 절환 위치가 10, 12, 16 mm 이다.

Figure 9 와 10은 보압 절환 위치에 따른 충진 패턴이다.

Model 및 보압 절환 위치에 따른 충진 시간에는 차이가 있으 나, 충진 패턴은 보압 절환 위치와 재료에 관계 없이 일정한 Figure 6. Injection molding condition for simulation and experiment

Figure 7. Injection machine used in this study.

Figure 8. Mold for injection molding. (a) Model-1, (b) Model-2

(4)

모양으로 사출이 진행된다. 실제 캐비티 내 수지 흐름에서 보 압 절환 이후 충진 패턴에 차이가 있을 것으로 예상하였으나, 해석 결과에서는 흐름에 크게 차이가 없었다.

Figure 11 과 12는 보압 절환 위치에 따른 보압 절환 시 충 진 압력이다. 보압 절환 위치에 따라, 보압 절환 시까지 충진 상태가 확연하게 차이 나는 것을 알 수 있다. 소재에 따른 차 이점은 거의 없으며, 충진 패턴과 유사한 모양으로 유동이 일 어나는 것을 확인 했다.

모델-1에서 보압 절환 위치가 4, 6, 8, 10, 12 그리고 16 mm 일 때 스프루 입구에서의 압력이 PC 에서는 각각 54.84, 54.06, 53.61, 53.18, 52.79 그리고 52.01 MPa로 나타났고 PBT 에서는 각각 41.96, 40.89, 40.45, 40.01, 39.59 그리고 38.76 MPa 로 나타났다. 또한 모델-2에서는 각각의 보압 절환 위치 에 따라 PC에서는 각각 77.03, 75.15, 74.64, 74.2, 73.71 그리 고 72.7 MPa로 나타났고 PBT에서는 54.88, 53.32, 52.89, 52.44, 51.98 그리고 50.91 MPa로 나타났다.

본 결과를 보면 수지에 따라 그리고 모델에 따라 압력이 다 르게 나타나는 것을 알 수 있다.

Figure 13 과 14는 보압 절환 위치에 따른 유동 선단에서의 온도 분포이다. Model-1에서는 보압 절환 위치와 관계 없이, 유동 선단에서의 온도는 균일한 것으로 확인 된다. 형상이 다 Figure 9. Flow pattern according to V/P switchover position for

model-1. (a) PC, (b) PBT

Figure 10. Flow pattern according to v/p switchover position for model-2. (a) PC, (b) PBT

Figure 11. Cavity pressure at V/P switchover position for model-

1. (a) PC, (b) PBT

(5)

Figure 12. Cavity pressure at V/P switchover position for model- 2. (a) PC, (b) PBT

Figure 13. Temperature at melt front according to V/P switchover position for model-1. (a) PC, (b) PBT

Figure 14. Temperature at melt front according to V/P switchover position for model-2. (a) PC, (b) PBT

Figure 15. Deformation according to V/P switchover position for

model-1. (a) PC, (b) PBT

(6)

소 복잡한 Model-2에서는, 보압 절환이 빠를 수록 유동 선단 에서의 온도가 높은 것을 확인 할 수 있다. 보압 절환 위치에 따라 사출 시간의 변화가 크지 않아, 캐비티 내에서의 온도 저 하는 크지 않음을 확인 할 수 있다.

Figure 15 와 16은 보압 절환 위치에 따른 변형이다. X, Y, Z 축에서의 변형 효과를 종합하여 최종 변형이 어느 정도 인 지 확인 할 수 있는 결과이다. 보압 절환 위치가 빠를수록 변 형이 더 커지는 것으로 나타났다.

모델에 따른 변형량의 차이는 크지 않았으며, 재료에 의한 변형의 차이가 유의미한 수치를 보인다. PC의 경우, 최종 변 형 량(원점 기준)은 1 mm 이내이며, PBT의 경우 수축이 많 이 일어나 2 mm 내외의 변형을 보인다. PBT는 결정성 수지 로 냉각 중 결정화로 인해 수축이 더 많이 일어났다고 판단 된다.

보압 절환 위치가 빠를 수록 캐비티 내의 압력이 작아 수 지의 패킹이 어려워 이로 인한 수축이 더 많이 일어나는 것 으로 판단된다.

2. Comparison with simulation and experiment

해석과 같은 조건으로 두 가지의 재료를 가지고 사출 성형

을 실시하였다. 사출 성형에 사용된 재료는 충분히 건조한 후 사출을 진행하였으며, 각 사출 조건에서 5개의 시편을 취합해 변형 값을 측정 하였다. 아래의 Figure 17과 18은 실제 사출 성형으로 제작한 시편이다.

Figure 19 와 20은 해석 결과에서 캐비티 내 압력 변화를 보 압 절환 위치에 따라 나타낸 것이다. PC와 PBT 모두 보압 절 Figure 16. Deformation according to V/P switchover position for

model-2. (a) PC, (b) PBT

Figure 18. Injection molded for model-2. (a) PC, (b) PBT

Figure 19. Variation of cavity pressure according to V/P switchover position for model-1. (a) PC, (b) PBT

Figure 20. Variation of cavity pressure according to V/P

switchover position for model-2. (a) PC, (b) PBT

(7)

환 위치가 빠를수록, 캐비티 내에 가해지는 압력이 작아지는 것을 확인하였고, 이는 일정한 경향성을 보인다.

Figure 21 과 22에서 해석결과와 실제 사출 결과에 따른 변 형 값을 그래프로 표현하였다. 변형량은 흐름방향보다 흐름 직각방향에서 변화가 크고, 변화량 자체는 보압 절환 위치가 빠를 수록 증가함을 확인 하였다. 이는 실제 실험 결과와 해 석 결과가 일치하는 결과이며, 수치의 차이는 있지만 같은 경 향을 보이고 있다.

3. Discussion

해석과 사출 성형 실험 비교 결과, 보압 절환 위치는 캐비 티 내 충진 압력에 가장 큰 영향을 미치며, 이는 충진시 패킹 에 영향을 미쳐 변형에 영향을 미치는 것으로 판단된다.

보압 절환 위치가 10 mm를 넘어가는 경우(85% 충진 미만 인 경우), 변형량이 크게 증가하며, 4~8 mm (90~99% 충진) 범위 내에서는 변형 정도가 크지 않음을 확인 할 수 있었다.

보압 절환 위치에 따라 캐비티 내의 압력 변화 발생하며, 이 압력의 차이는 사출 시 캐비티 내에 수지가 패킹되는 정도의 차이에 영향을 미친 것으로 판단된다. 보압 절환 위치가 빠를 수록, 사출 속도 및 고압으로 채워지는 것이 아닌, 보압 전환 이후의 압력으로 채워짐에 따라 캐비티 내 압력이 작아서 수 축이 좀 더 많이 일어나는 것으로 보인다.

Conclusions

보압 절환 위치는 캐비티 내의 압력에 가장 큰 영향을 주 는 요소로 사료된다. 본 연구에서 사용한 소재(PC, PBT)와 모 델(Model-1, 2)에 크게 관계 없이 보압 절환 위치가 늦을수록 변형이 적다. 모델에 따라서는 Model-2의 홀이 있는 평판이 Model-1 의 단순 평판에 비해 온도의 영향을 조금 더 받는 것 으로 나타났다.

결정성 소재인 PBT가 비 결정성 소재인 PC보다 수축이 더 많이 일어나 차이를 좀 더 확연히 볼 수 있었다. 정밀 사출성 Figure 21. Variation of part deformation according to v/p

switchover position for model-1. (a) PC, (b) PBT

Figure 22. Variation of part deformation according to v/p

switchover position for model-2. (a) PC, (b) PBT

(8)

Acknowledgments

이 연구는 서울과학기술대학교 교내연구비의 지원으로 수 행 되었습니다.

References

1. M. Lee, H. Kim, and M.-Y. Lyu, “A Study on the Warpage of Glass Fiber Reinforced Plastics for Part Design and Operation Condition”, The Polymer Society of Korea, 36, 555 (2012).

2. D. V. Rosato and M. G. Rosato, “Injection molding hand- book”, Springer Science & Business Media, New York, 2012.

3. R. M. German, “Powder injection molding”, Metal Powder Industries Federation, Princeton, 1990.

4. N. Prabhu, J. Schultz, and S. G. Advani, “Role of Coupling Microscopic and Macroscopic Phenomena During the Semic- rystalline Polymers”, Polymer Eng. Sci., 41, 1871 (2001).

5. C. Shen, L. Wang, and Q. Li, “Optimization of injection molding process parameters using combination of artificial neural network and genetic algorithm method”, Journal of Materials Processing Technology, 183, 412 (2007).

6. H. Oktem, T. Erzurumlu, and I. Uzman, “Application of Taguchi optimization technique in determining plastic injec- tion molding process parameters for a thin-shell part”, Mate-

Turng, “Quantitative study of shrinkage and warpage behav- ior for microcellular and conventional injection molding”, Polymer Engineering & Science, 45, 1408 (2005).

10. Q. Guan, K. Shen, J. Ji, and J. Zhu, “Structure and properties of self-reinforced polyethylene prepared by oscillating pack- ing injection molding under low pressure”, Journal of Applied Polymer Science, 55, 1797 (1995).

11. R. Pantani, I. Coccorullo, V. Speranza, and G. Titomanlio,

“Morphology evolution during injection molding: effect of packing pressure”, Polymer, 48, 2778 (2007).

12. H. Yaguchi, H. Hojo, D. G. Lee, and E. G. Kim, “Measure- ment of planar orientation of fibers for reinforced thermoplas- tics using image processing”, Int. Polym. Processing, 10, 262 (1995).

13. K. M. B. Jansen, D. J. Van Dijk, and E. V. Burgers, “Experi- mental validation of shrinkage predictions for injection molded products”, Int. Polym. Processing, 13, 99 (1998).

14. M.-Y. Lyu, J. G. Choi, and Y. Pae, “Investigation of the Jetting Phenomena in Injection Molding for Various Injection Speeds, Resins and Mold Shapes”, Transactions of Materials Processing, 12, 3 (2003).

15. D. Kazmer and P. Barkan, Multi-cavity pressure control in the filling and packing stages of the injection molding process.

Polymer Engineering & Science, 37, 1865 (1997).

수치

Figure 1. Pressure curve according to packing phase. (a) Late packing, (b) Early packing, (c) Short packing time, (d) High packing pressure and long packing time
Figure 5. Shear viscosity curve for studied material. (a) PC, (b) PBT
Figure 8. Mold for injection molding. (a) Model-1, (b) Model-2
Figure 11. Cavity pressure at V/P switchover position for model- model-1. (a) PC, (b) PBT
+4

참조

관련 문서

: Determine the superficial liquid and vapor velocities (V sl and V sg ) and the actual liquid and vapor velocities (V l and V g ) for the following liquid holdups,

• position: fractional multiples of the unit cell edge lengths ) P:..

According to the results of needs analysis employees feel the biggest need for education and training in specialized skills, and wish to participate in

Results: The results demonstrated a significant positive correlation between the muscle atrophy and the tendon tear.(p<0.05) And there was statistically

Objectives: This study was performed to compare food insecurity according to socio-demographic factors and health status and to identify the association

The influence of age and gender on remifentanil EC 50 for preventing microemulsion propofol injection pain.. - Remifentanil EC 50 on propofol injection

This study was started from the position that it is necessary to understand differences in the perception and demand of nature experiences between parents

Finally the relationship of the weight rate in fiber content of the product and fiber orientation function J and that of the injection molding condition and fiber