https://doi.org/10.5624/isd.2017.47.4.227
Introduction
Sialolithiasis is one of the most prevalent large obstruc- tive disorders of the major salivary glands.1 The subman- dibular gland is the most frequently involved.2 The main clinical features are pain and swelling associated with eating and subsequent sialoadenitis.3
Various physical and chemical examinations, includ- ing ultrasonography, sialography, computed tomography, and magnetic resonance imaging, are commonly used to diagnose salivary gland diseases.4 99mTc-pertechnetate
salivary gland scintigraphy is useful for the diagnosis of diseases that affect the salivary gland through the use of radionuclide-labeled compounds. This easy, noninvasive, and accurate method assesses the functional state and degree of injury to the gland, providing highly valuable clinical information.5 However, some authors described that 99mTc-pertechnetate salivary gland scintigraphy has rarely been used to evaluate salivary gland function; the role of this method in the diagnosis of diseases of the sali- vary gland has been neglected.6,7 Furthermore, to the best of our knowledge, the relationship between CT values of submandibular glands with and without sialolithiasis and salivary gland excretion measured using salivary gland scintigraphy has not been reported in the literature. The aim of this study was to investigate submandibular sialo- lithiasis with CT and scintigraphy, with a particular focus
Submandibular sialolithiasis with CT and scintigraphy: CT values and salivary gland excretion in the submandibular glands
Ichiro Ogura1,*, Kazuhide Hayama2, Mikiko Sue1, Takaaki Oda1, Yoshihiko Sasaki1
1Radiology, The Nippon Dental University Niigata Hospital, Niigata, Japan
2Department of Oral and Maxillofacial Radiology, The Nippon Dental University School of Life Dentistry at Niigata, Niigata, Japan
AbSTrACT
Purpose: Sialolithiasis is one of the most prevalent large obstructive disorders of the submandibular glands. The aim of this study was to investigate submandibular sialolithiasis with computed tomography(CT) and scintigraphy, with a particular focus on the relationship between CT values of the submandibular glands and their excretion rate.
Materials and Methods: Fifteen patients with submandibular sialolithiasis who underwent CT and salivary gland scintigraphy were included in this study. The relationship between the CT values of submandibular glands with and without sialoliths and salivary gland excretion measured using salivary gland scintigraphy was statistically analyzed. Dynamic images were recorded on the computer at 1 frame per 20 seconds. The salivary gland excretion fraction was defined as A(before stimulation test[counts/frame])/B(after stimulation test[counts/frame]) using time-activity curves.
results: The CT values in the submandibular glands with and without sialoliths was 9.9±44.9 Hounsfield units(HU) and 34.2±21.8 HU, respectively(P=.233). Regarding the salivary gland excretion fraction using scintigraphy, the A/B value in the submandibular glands with sialoliths(1.09±0.23) was significantly lower than in the submandibular glands without sialoliths(1.99±0.57, P=.000).
Conclusion: Assessments of the CT values and the salivary gland excretion fraction using scintigraphy in the submandibular glands seem to be useful tools evaluating submandibular sialolithiasis.(Imaging Sci Dent 2017; 47:
227-31)
Key wordS: Submandibular Gland; Salivary Duct Calculi; Gamma Cameras; Multidetector Computed Tomography
Copyright ⓒ 2017 by Korean Academy of Oral and Maxillofacial Radiology
This is an Open Access article distributed under the terms of the Creative Commons Attribution Non-Commercial License(http://creativecommons.org/licenses/by-nc/3.0) which permits unrestricted non-commercial use, distribution, and reproduction in any medium, provided the original work is properly cited.
Imaging Science in Dentistry·pISSN 2233-7822 eISSN 2233-7830 Received May 16, 2017; Revised August 3, 2017; Accepted August 8, 2017
*Correspondence to : Dr. Ichiro Ogura
Radiology, The Nippon Dental University Niigata Hospital, 1-8 Hamaura-cho, Chuo- ku, Niigata, Niigata 951-8580, Japan
Tel) 81-25-267-1500, Fax) 81-25-267-1134, E-mail) [email protected]
on the relationship between CT values of the submandib- ular glands and their excretion rate.
Materials and Methods
Patients
This retrospective study was approved by the ethics committee of our institution(ECNG-R-280). After pro- viding written informed consent, 15 patients(8 males, 7 females; age, 20-89 years; mean age, 54.5 years) with submandibular sialolithiasis underwent CT and salivary gland scintigraphy at our university hospital from Novem- ber 2013 to January 2017. The histopathological diagno- sis of submandibular sialolithiasis was made by surgery in all cases.
Image acquisition
CT imaging was performed with a 16-multidetector CT scanner(Aquilion TSX-101A; Toshiba Medical Sys- tems, Otawara, Japan) using the maxillofacial protocol at our hospital: tube voltage, 120kVp; tube current, 150 mA; field of view, 240×240mm; and rotation time, 0.50s.
The protocol consisted of axial acquisition(0.50mm) with axial, coronal, and sagittal multiplanar reformation images.
Regarding salivary gland scintigraphy, after the intra- venous injection of approximately 370MBq of 99mTc- pertechnetate, salivary gland scintigraphy was performed for 60 minutes with a gamma camera(SNC-5100R and Scintipack 24000; Shimadzu, Kyoto, Japan) with a 128×
128 matrix, and dynamic images were recorded on the computer at 1 frame per 20sec. Forty-five minutes after the dynamic images started, 10% citric acid(0.50mL) was administered orally to stimulate salivary gland excre- tion. The stored data were displayed on a screen(Radi- Force GX340; EIZO, Ishikawa, Japan) for analysis.
Image analysis
Two oral and maxillofacial radiologists, with over 20 years of experience, independently reviewed all images, and any discrepancies were resolved by consensus.
The size of sialoliths on CT was independently mea- sured 3 times using CT software(INFINITT JAPAN, To- kyo, Japan) by each examiner to obtain a mean value. We used the mean value of the size of the sialoliths obtained by each examiner.
Each examiner used regions of interest(ROIs) to calcu-
late the CT values of submandibular glands with sialoliths and the contralateral normal submandibular gland as the control group(submandibular gland without sialoliths) using CT software. Circular ROIs of each submandibular gland were drawn manually, and each examiner placed 3 ROIs with similar sizes within the submandibular gland to obtain a mean CT value. We used the mean values ob- tained by each examiner as the CT values of the subman- dibular gland of each patient.
Regarding the salivary gland excretion fraction using salivary gland scintigraphy, the data were digitally gath- ered and plotted on separate time-activity curves for the submandibular glands, and the ROIs of each submandib- ular gland were drawn manually. The salivary gland ex- cretion fraction was defined as A(before stimulation test [counts/frame])/B(after stimulation test[counts/frame]).
Statistical analysis
The relationships between the presence of a sialolith with CT values and scintigraphic results were compared using the Mann-Whitney U test for nonparametric data.
These analyses were performed with the statistical pack- age SPSS version 24(IBM Japan, Tokyo, Japan). P values less than .05 were considered to indicate statistical signif- icance.
results
We plotted the before/after results of stimulation tests against the CT values of submandibular glands with and without sialolithiasis(Fig. 1). Table 1 shows cases of submandibular sialolithiasis with the results of CT and salivary gland scintigraphy. Of the 15 patients with sub- mandibular sialolithiasis, 5 submandibular glands with sialolithiasis(33.3%) showed CT values of less than 0 Hounsfield units(HU). Furthermore, 5 of the 6 subman- dibular glands(83.3%) with CT values less than 0HU had sialoliths. Furthermore, the number of sialolith glands showing decreased uptake was 12(80.0%).
Table 2 shows the relationship between CT values and salivary gland excretion in the submandibular glands with and without sialoliths. The CT values in the submandib- ular glands with and without sialoliths were 9.9±44.9 HU and 34.2±21.8HU, respectively(P=.233). Regard- ing the salivary gland excretion fraction measured using scintigraphy(Fig. 2), the A/B value in the submandibular glands with sialoliths(1.09±0.23) was significantly lower than in those without sialoliths(1.99±0.57, P=.000).
discussion
Konstantinidis et al.8 stated that fat infiltration of the major salivary glands has been reported in several condi- tions: as part of the normal aging process in sialadenosis;
in diseases related to fat metabolism, as in alcoholism, malnutrition, anorexia, bulimia, hypothyroidism, and di- abetes mellitus; in HIV infections; and in autoimmune disorders such as Sjögren syndrome. Sumi et al.9 reported that CT could show some active inflammatory changes in glands affected by sialolithiasis; furthermore, CT in symptomatic patients showed that the affected glands had a greater density, while CT in asymptomatic patients showed that the affected glands had a lower density (due to fat deposition in atrophic glands). Garrett10 described differences in fat deposition in the submandibular sali- vary glands according to aging and chronic inflammation.
In this study, 5 of the 15 submandibular glands(33.3%) with sialolithiasis showed CT values less than 0HU, cor- responding to so-called fatty degeneration. Furthermore, 5 of the 6 submandibular glands(83.3%) with CT values less than 0HU had sialoliths. We suggest that sialolithia- sis might be a factor contributing to fatty degeneration in the submandibular gland.
Sialolithiasis is diagnosed using clinical and radiographic methods.11 Furthermore, 99mTc-pertechnetate salivary gland scintigraphy is useful for the diagnosis of diseases that af- fect the salivary glands, as this noninvasive and accurate method assesses the functional state and degree of injury to the gland. This study showed that the A(before stimul- ation test[counts/frame])/B(after stimulation test[counts/
frame]) value of submandibular glands with sialoliths (1.09±0.23) was lower than that of submandibular glands without sialoliths(1.99±0.57, P=.000). Wu et al.5 re-
Fig. 1. Correlation between computed tomography(CT) values of submandibular glands with/without sialoliths and before/after the stimulation test. With: submandibular gland with sialoliths, with- out: submandibular gland without sialoliths.
Before/after stimulation test
Sialolithiasis With Without 3.0
2.5
2.0
1.5
1.0
.5
CT value of submandibular gland(HU)
-75.0 -50.0 -25.0 .0 25.0 50.0
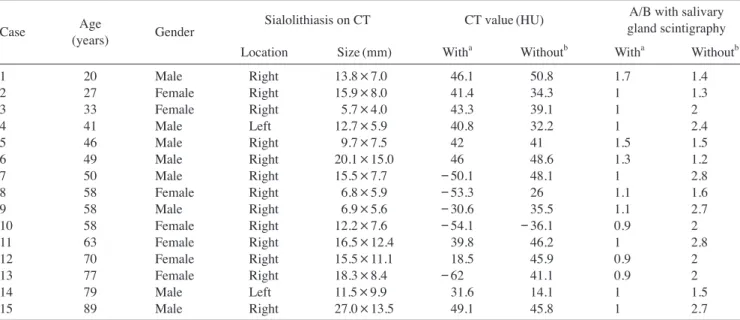
Table 1. Case of submandibular sialolithiasis with computed tomography(CT) and salivary gland scintigraphy
Case Age
(years) Gender Sialolithiasis on CT CT value(HU) A/B with salivary
gland scintigraphy
Location Size(mm) Witha Withoutb Witha Withoutb
1 20 Male Right 13.8×7.0 46.1 50.8 1.7 1.4
2 27 Female Right 15.9×8.0 41.4 34.3 1 1.3
3 33 Female Right 5.7×4.0 43.3 39.1 1 2
4 41 Male Left 12.7×5.9 40.8 32.2 1 2.4
5 46 Male Right 9.7×7.5 42 41 1.5 1.5
6 49 Male Right 20.1×15.0 46 48.6 1.3 1.2
7 50 Male Right 15.5×7.7 -50.1 48.1 1 2.8
8 58 Female Right 6.8×5.9 -53.3 26 1.1 1.6
9 58 Male Right 6.9×5.6 -30.6 35.5 1.1 2.7
10 58 Female Right 12.2×7.6 -54.1 -36.1 0.9 2
11 63 Female Right 16.5×12.4 39.8 46.2 1 2.8
12 70 Female Right 15.5×11.1 18.5 45.9 0.9 2
13 77 Female Right 18.3×8.4 -62 41.1 0.9 2
14 79 Male Left 11.5×9.9 31.6 14.1 1 1.5
15 89 Male Right 27.0×13.5 49.1 45.8 1 2.7
A: before stimulation test[counts/frame], B: after stimulation test(counts/frame), Witha: submandibular gland with sialolithiasis, Withoutb: submandibular gland without sialolithiasis, CT: computed tomography, HU: Hounsfield units
ported that uptake and excretion by the glands were sub- stantially decreased in patients with sialolithiasis. In this study, 12 of 15 sialolith glands showed decreased uptake (80.0%). We conclude that sialoliths were a factor that affected salivary gland excretion in the submandibular gland.
The limitations of this study were as follows: the num- ber of patients with submandibular sialolithiasis was small, and logistic multivariate regression analysis was not used to determine the relationship between CT values of the submandibular glands with and without sialoliths and salivary gland excretion measured using salivary gland scintigraphy. Furthermore, our study did not eval- uate the relationship between patients’ clinical symptoms and biopsy results(fatty degeneration), which would have also provided supplemental information about differenc- es in CT values and biopsy results in relation to clinical
symptoms. Therefore, further research is necessary to val- idate these results.
In conclusion, CT values and the salivary gland excre- tion fraction measured using scintigraphy in the subman- dibular glands seemed to be useful tools evaluating sub- mandibular sialolithiasis.
references
1. Kim JH, Aoki EM, Cortes AR, Abdala-Júnior R, Asaumi J, Arita ES. Comparison of the diagnostic performance of pan- oramic and occlusal radiographs in detecting submandibular sialoliths. Imaging Sci Dent 2016; 46: 87-92.
2. Lustmann J, Regev E, Melamed Y. Sialolithiasis. A survey on 245 patients and a review of the literature. Int J Oral Maxillo- fac Surg 1990; 19: 135-8.
3. Schwarz D, Kabbasch C, Scheer M, Mikolajczak S, Beutner D, Luers JC. Comparative analysis of sialendoscopy, sonography, Table 2. Relationship between CT values and salivary gland excretion in the submandibular glands with/without sialoliths
With sialoliths
Mean±SD(Range) Without sialoliths
Mean±SD(Range) P value
CT value(HU) 9.9±44.9(-62.0-49.1) 34.2±21.8(-36.1-50.8) 0.233
A/B with salivary gland scintigraphy 1.09±0.23(0.90-1.70) 1.99±0.57(1.20-2.80) 0.000 A: before stimulation test(counts/frame), B: after stimulation test(counts/frame), CT: computed tomography, HU: Hounsfield units, SD: standard deviation
Fig. 2. A 50-year-old male with right-sided submandibular sialoli- thiasis. An axial soft-tissue algo- rithm computed tomography(CT) image(A) demonstrates a sialolith (long arrow) and submandibular glands(short arrows). The density of the right submandibular gland was less than that of the left sub- mandibular gland. Axial bone tissue algorithm CT(B) shows a sialolith (long arrow). The A(before stimu- lation test[counts/frame])/B(after stimulation test[counts/frame]) val- ue using time-activity curves of the right submandibular gland(C) was lower than that of the left subman- dibular gland(D).
A B
C D
and CBCT in the detection of sialolithiasis. Laryngoscope 2015; 125: 1098-101.
4. Gulati A, Scott J, Blythe JN, Southorn B, Brennan PA. Re- view of salivary papers published in the British Journal of Oral & Maxillofacial Surgery during 2009-2010. Br J Oral Maxillofac Surg 2011; 49: 627-9.
5. Wu CB, Xi H, Zhou Q, Zhang LM. The diagnostic value of technetium 99m pertechnetate salivary gland scintigraphy in patients with certain salivary gland diseases. J Oral Maxillo- fac Surg 2015; 73: 443-50.
6. Drage NA, Brown JE. Cone beam computed sialography of sialoliths. Dentomaxillofac Radiol 2009; 38: 301-5.
7. Li J, Gong X, Xiong P, Xu Q, Liu Y, Chen Y, et al. Ultrasound and computed tomography features of primary acinic cell carcinoma in the parotid gland: a retrospective study. Eur J
Radiol 2014; 83: 1152-6.
8. Konstantinidis I, Tsakiropoulou E, Chatziavramidis A, Ia- kovou I, Scintigraphic detection of a parotid salivary gland malfunction, in chronic sialolithiasis and fat infiltration with no risk factors. Hell J Nucl Med 2014; 17: 49-51.
9. Sumi M, Izumi M, Yonetsu K, Nakamura T. The MR imaging assessment of submandibular gland sialoadenitis secondary to sialolithiasis: correlation with CT and histopathologic find- ings. AJNR Am J Neuroradiol 1999; 20: 1737-43.
10. Garrett JR. Some observations on human submandibular sali- vary glands. Proc R Soc Med 1962; 55: 488-91.
11. Jardim EC, Ponzoni D, de Carvalho PS, Demétrio MR, Arane- ga AM. Sialolithiasis of the submandibular gland. J Craniofac Surg 2011; 22: 1128-31.