JPNT 5(2), 47-57 (2016)
http://dx.doi.org/10.11003/JPNT.2016.5.2.047 J PNT
Journal of Positioning,Navigation, and Timing
1. INTRODUCTION
The Global Navigation Satellite System (GNSS), which is an important infrastructure providing navigation information globally, is used in various areas including surveying, time synchronization, weapon system, and communication. However, the GNSS may be disabled by external interferences such as jamming and spoofing, since the received signal strength is very weak (Jeong et al.
2012). To prepare against the GNSS failure, many countries have plans of backup systems based on terrestrial radio navigation systems. The U.S. has a backup system plan which is the NextGen Implementation Plan announced by the Federal Aviation Administration (Eldredge et al.
Modeling & Simulation Software Design for Coverage Analysis of Multiple Radio Positioning Integration System
Moonsuk Koo
1, YoungJoon Kim
2, Hyoungmin So
3, Sang Heon Oh
4, Seong-Cheol Kim
2, Dong-Hwan Hwang
1†1
Department of Electronics Engineering, Chungnam National University, Daejeon 34134, Korea
2
Department of Electrical Engineering, Seoul National University, Seoul 08826, Korea
3
The 3rd Research and Development Institute, Agency for Defense Development, Daejeon 34186, Korea
4
Integrated Navigation Division, Navcours Co., Ltd, Daejeon 34014, Korea
ABSTRACT
Since the Global Navigation Satellite System (GNSS) may not provide navigation information due to external interferences, many countries have plans to prepare a backup system for this situation. One of the possible GNSS backup systems is a multiple radio positioning integration system in combination with the terrestrial radio navigation system. Before constructing such a GNSS backup system, M&S software is needed to analyze if the system satisfies the performance the required navigation performance. This study presents requirements of M&S software for coverage analysis of the navigation system, and proposes an M&S software design scheme on the basis of the requirements. The M&S software is implemented, and coverage analysis is performed to verify the validity of the proposed design scheme.
Keywords: coverage analysis, M&S software, gap filling, terrestrial radio navigation system, integrated navigation system
2010, Lo et al. 2010, FAA 2014). Similarly, Sweden has the Swedish Radio Navigation Plan announced by the Swedish Maritime Administration (SMA 2009). Germany has a plan similar to that of the U.S., which is the Single European Sky ATM Research (Lo et al. 2015). The U.K is carrying out a GNSS backup system on the basis of enhanced Long range navigation (eLoran), which is currently under initial operation (Inside GNSS 2014).
Before applying these GNSS backup systems to the actual environment, a performance evaluation should be required. It should be considered if the required navigation performance is satisfied in the area where the navigation system is operated, and, if not, reducing the gap should be taken into consideration, through a deployment of additional signal sources and/or other methods (Kim 2012a, b).
This study provides results of the M&S software design for the deployment of signal sources of the radio navigation system and the coverage analysis. Through the M&S software, the dilution of precision (DOP) distribution and the coverage are shown and deployment of new signal Received Jan 30, 2016 Revised Mar 18, 2016 Accepted Mar 21, 2016
†
Corresponding Author E-mail: [email protected]
Tel: +82-42-821-5670 Fax: +82-42-823-5436
sources to extend the coverage as well as change of the DOP distribution and the coverage of the new signal sources is also verified.
2. COVERAGE ANLYSIS AND GAP FILLING
2.1 Coverage Analysis
Coverage analysis is a process of identifying the areas where a given performance is satisfied on the basis of the suggested deployment of ground station. In case of aircraft, the International Civil Aviation Organization provides the Total System Error (TSE) as an index for the require navigation performance for each flight stages, as shown in Eq. (1):
Before applying these GNSS backup systems to the actual environment, a performance evaluation should be required. It should be considered if the required navigation performance is satisfied in the area where the navigation system is operated, and, if not, reducing the gap should be taken into consideration, through a deployment of additional signal sources and/or other methods (Kim 2012a, 2012b).
This study provides results of the M&S software design for the deployment of signal sources of the radio navigation system and the coverage analysis. Through the M&S software, the dilution of precision (DOP) distribution and the coverage are shown and deployment of new signal sources to extend the coverage as well as change of the DOP distribution and the coverage of the new signal sources is also verified.
2. COVERAGE ANLYSIS AND GAP FILLING 2.1 Coverage Analysis
Coverage analysis is a process of identifying the areas where a given performance is satisfied on the basis of the suggested deployment of ground station. In case of aircraft, the International Civil Aviation Organization provides the Total System Error (TSE) as an index for the require navigation performance for each flight stages, as shown in Eq. (1):
2 2 2
TSE PDE FTE NSE (1) In Eq. (1), the TSE, defines how much an aircraft is deviated from the planned course. The Path Definition Error (PDE) is the error between the planned course and the defined error, and includes variables reflecting the navigation database error, calculation error, and display error.
The Flight Technical Error (FTE) refers to the error caused by pilot’s ability or automatic pilot system. The Navigation System Error (NSE) refers to the error between the true position of the aircraft and the estimated position of the navigation system. The PDE generally has a fixed value of 0.25 NM, while the FTE has fixed values according to the flight stages and the required navigation performance, as shown in Table 1. Therefore, the coverage analysis analyzes change of the NSE according to the distribution of the navigation signal sources in the target region (PBN Korea 2014a, 2014b).
For the coverage analysis to the deployment of the navigation signal source, the DOP corresponding to the NSE of the target navigation system should be obtained. The DOP, representing the effect of the navigation system measurement error on the navigation result, is calculated from the measurement matrix of the navigation equation.
After calculating the DOP corresponding to the NSE of the target navigation system in the target region, the DOP is multiplied by the navigation system measurement error to calculate the estimated error at a certain position. If the estimated performance satisfies a desired vale, the position is included in the coverage (Kim 2012a, 2012b). In the case of a unit navigation system, the performance is estimated from multiplication of the DOP and the navigation system measurement error. However, in the case of an integration of multiple navigation systems, weighting values are given to calculate the weighted DOP, since the errors of the unit navigation systems are different. The estimated performance is calculated and the coverage is determined in the target region on the basis of the weighted DOP (Won et al. 2012).
(1)
In Eq. (1), the TSE, defines how much an aircraft is deviated from the planned course. The Path Definition Error (PDE) is the error between the planned course and the defined error, and includes variables reflecting the navigation database error, calculation error, and display error. The Flight Technical Error (FTE) refers to the error caused by pilot’s ability or automatic pilot system. The Navigation System Error (NSE) refers to the error between the true position of the aircraft and the estimated position of the navigation system. The PDE generally has a fixed value of 0.25 NM, while the FTE has fixed values according to the flight stages and the required navigation performance, as shown in Table 1. Therefore, the coverage analysis analyzes change of the NSE according to the distribution of the navigation signal sources in the target region (PBN Korea 2014a, b).
For the coverage analysis to the deployment of the navigation signal source, the DOP corresponding to the NSE of the target navigation system should be obtained.
The DOP, representing the effect of the navigation system measurement error on the navigation result, is calculated
from the measurement matrix of the navigation equation.
After calculating the DOP corresponding to the NSE of the target navigation system in the target region, the DOP is multiplied by the navigation system measurement error to calculate the estimated error at a certain position. If the estimated performance satisfies a desired vale, the position is included in the coverage (Kim 2012a, b). In the case of a unit navigation system, the performance is estimated from multiplication of the DOP and the navigation system measurement error. However, in the case of an integration of multiple navigation systems, weighting values are given to calculate the weighted DOP, since the errors of the unit navigation systems are different. The estimated performance is calculated and the coverage is determined in the target region on the basis of the weighted DOP (Won et al. 2012).
2.2 Gap Filling
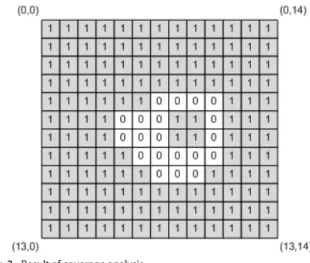
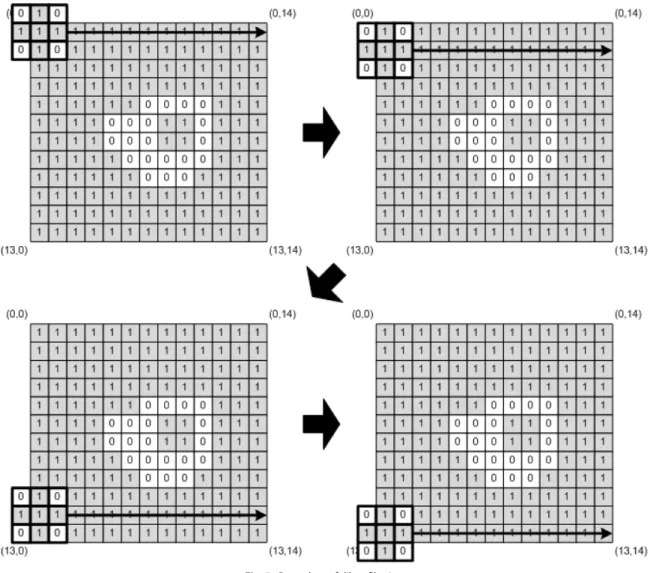
The gap filling is a process determining positions of additional deployment of navigation signal sources to have a maximum coverage when the coverage is not sufficient and extension is required (Kim 2012a, b).
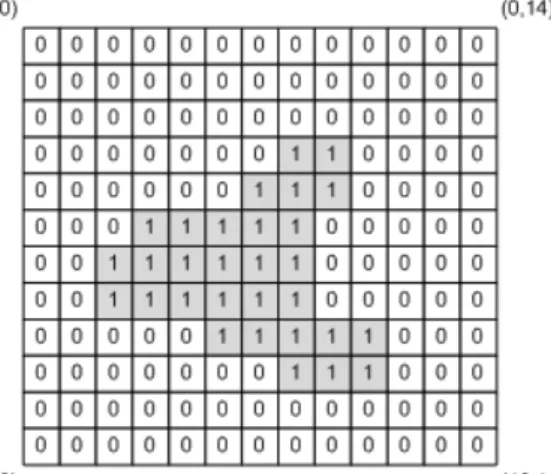
First, in the coverage analysis result, the areas where the navigation signals are not reached and the required navigation performance is not satisfied are defined as the gap. Positions of the additionally deployed navigation signal sources are determined in the gap. The coverage analysis is performed again to the original navigation signal sources and the additionally deployed navigation signal sources to calculate the coverage area. The newly calculated areas of the coverage are compared. The position of the additionally deployed navigation signal source is a result of the gap filling when the area of the coverage is maximum.
3. REQUIREMENT OF COVERAGE ANALYSIS M&S SOFTWARE
As mentioned previously, the coverage analysis depending on the spatial deployment of the navigation signal sources of the multiple radio navigation systems is a process of identifying the coverage in the target region and determining the positions of the additionally deployed navigation signal sources to extend the coverage satisfying the required navigation performance. The following points should be considered when designing M&S software for the coverage analysis:
1) The M&S software should enable to input parameters Table 1. FTE value at each flight stage (PBN Korea 2014b).
Flight stage Required navigation performance FTE (95%)
En route RNAV 5.0
RNP 4.0 RNAV 1.0 RNP 1.0
2.5 NM 2.0 NM 0.5 NM 0.5 NM
Terminal RNAV 2.0
RNAV 1.0 RNP 1.0
1.0 NM 0.5 NM 0.5 NM
Final approach RNP APCH 0.25 NM
Missed approach RNP APCH 0.5 NM
Moonsuk Koo et al. Modeling & Simulation Software for Coverage Analysis 49
needed for the coverage analysis, including the types of navigation signal sources, the deployment of the navigation signal sources, the required navigation performance, and the target region.
2) The M&S software should enable to provide the coverage analysis results according to the deployment of the navigation signal sources.
3) The M&S software should enable to calculate and verify the types and position of new navigation signal sources to carry out the gap filling.
4) The M&S software should enable to compare coverages for various deployments of navigation signal sources.
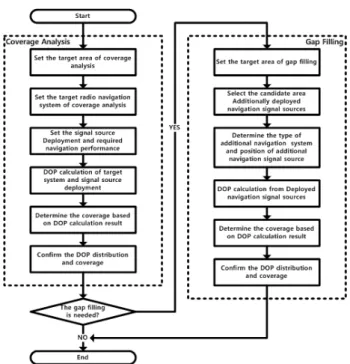
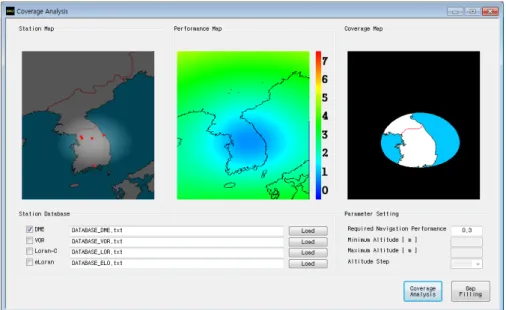
Fig. 1 shows the coverage analysis and the gap filling process. Fig. 2 shows the design concept reflecting the requirements of the coverage analysis M&S software.
4. DESIGN OF COVERAGE ANALYSIS M&S SOFTWARE
This section presents the design technique for the coverage analysis M&S software reflecting requirements presented in Section 3. The coverage analysis M&S software should enable users to input the parameters in Table 2, and output the results in the items in Table 3. The coverage analysis M&S software consists of the graphic user interface (GUI) part, the coverage analysis part, and the gap filling Fig. 1. Multi-GNSS signals in frequency space.
Fig. 2. Coverage analysis M&S software design concept.
Table 2. Inputs for coverage analysis.
Items Parameters Unit
Target region Northern boundary of coverage analysis degree (dms) Eastern boundary of coverage analysis degree (dms) Western boundary of coverage analysis degree (dms) Southern boundary of coverage analysis degree (dms) Required
navigation performance
Type NM
Performance index -
Navigation signal source
Navigation signal source ID -
Navigation signal source type -
Navigation signal source latitude degree (dms) Navigation signal source longitude degree (dms) Navigation signal source altitude meter Additional
navigation signal source
Navigation signal source type -
Navigation signal source latitude degree (dms) Navigation signal source longitude degree (dms) Navigation signal source altitude meter
Table 3. M&S software outputs.
Items Information Unit