• 검색 결과가 없습니다.

Comparison between dental and basal arch forms in normal occlusion and Class III malocclusions utilizing cone-beam computed tomography

N/A
N/A
Protected

Academic year: 2022

Share "Comparison between dental and basal arch forms in normal occlusion and Class III malocclusions utilizing cone-beam computed tomography"

Copied!
8
0
0

로드 중.... (전체 텍스트 보기)

전체 글

(1)

Comparison between dental and basal arch forms in normal occlusion and Class III malocclusions utilizing cone-beam computed tomography

Objective: The purpose of this study was to investigate the relationship between the mandibular dental and basal arch forms in subjects with normal occlusion and compare them with those of Class III malocclusion using cone-beam computed tomography (CBCT). Methods: CBCT images of 32 normal occlusion (19 males, 13 females; 24.3 years) and 33 Class III malocclusion subjects (20 males, 13 females, 22.2 years) were selected. Facial axis and root center points were identified from the left to right mandibular first molars. Distances between the facial axis and root center points for each tooth were calculated, and 4 linear and 2 ratio variables were measured and calculated for each arch form.

The variables were compared between groups by independent t-test. Pearson correlation coefficient was applied to assess the relationships between dental and basal variables within each group. Results: The mandibular dental and basal intercanine widths were significantly greater in the Class III group than in normal occlusion subjects (p < 0.05). The dental and basal intercanine widths as well as the dental and basal intermolar widths were strongly correlated in normal occlusion and moderately correlated in Class III malocclusion. Conclusions:

The dental arch form demon strated a strong positive correlation with the basal arch form in the normal occlusion group and moderate correlation in the Class III malocclusion group. These results might be helpful for clinicians to have a better understanding of the importance of basal arch form in the alveolar bone.

[Korean J Orthod 2013;43(1):15-22]

Key words: Dental arch form, Basal arch form, Normal occlusion, Class III malocclusion, Cone-beam computed tomography

Kyung Eun Suk

a

Jae Hyun Park

b,c

Mohamed Bayome

d

Young-Ok Nam

e

Glenn T. Sameshima

f

Yoon-Ah Kook

a

a

Department of Orthodontics, Seoul St. Mary’s Hospital, The Catholic University of Korea, Seoul, Korea

b

Postgraduate Orthodontic Program, Arizona School of Dentistry & Oral Health, A.T. Still University, Mesa, AZ, USA

c

Graduate School of Dentistry, Kyung Hee University, Seoul, Korea

d

Department of Dentistry, The Catholic University of Korea College of Medicine, Seoul, Korea

e

Department of Dental Hygiene, Wonkwang Health Science University, Iksan, Korea

f

Department of Orthodontics, School of Dentistry, University of Southern California, Los Angeles, CA, USA

Received May 17, 2012; Revised August 28, 2012; Accepted October 9, 2012.

Corresponding author: Yoon-Ah Kook.

Department of Orthodontics, Seoul St. Mary’s Hospital, 222 Banpo-daero, Seocho-gu, Seoul 137-701, Korea.

Tel +82-2-2258-1776 e-mail [email protected]

© 2013 The Korean Association of Orthodontists.

The authors report no commercial, proprietary, or fi nancial interest in the products or companies described in this article.

This is an Open Access article distributed under the terms of the Creative Commons Attribution Non-Commercial License (http://creativecommons.org/licenses/by-nc/3.0) which permits unrestricted non-commercial use, distribution, and reproduction in any medium, provided the original work is properly cited.
pISSN 2234-7518 • eISSN 2005-372X

http://dx.doi.org/10.4041/kjod.2013.43.1.15

(2)

INTRODUCTION

Conventionally, basal bone has been assessed by mea- suring the apical third of a root or through measurement of a specific distance from the gingival margin to the mucogingival junction (MGJ) on dental casts.

1,2

Recently, however, virtual models have been considered a feasible alternative to plaster models due to their accuracy.

3,4

Previous studies evaluated the relationship between dental and basal arch forms using the WALA (acronym for Will Andrews and Larry Andrews, who proposed a band of soft tissue immediately superior to the muco- gingival junction) ridge on virtual models,

5-7

but soft tissue thickness, which varies among teeth, may affect the WALA point positions.

8

Cone-beam computed tomography (CBCT) has come to replace traditional 2-dimensional (2D) radiographs in current practice. Numerous studies have documented the accuracy and reliability of CBCT-derived images.

9,10

Tai et al.

11

evaluated dental and skeletal dimensions using CBCT before and after application of a Schwartz appliance. Bayome

12

evaluated the relationship between dental and basal arches with 3-dimensional (3D) virtual models and CBCT images in normal occlusion subjects.

Several studies have evaluated arch dimensions in dif- ferent malocclusion samples.

13-15

However, few have com pared the dental and basal arch forms of Class I and III subjects. Slaj et al.

16

investigated the dental arch dimensions in different malocclusions and found larger intercanine and intermolar widths in Class III subjects when compared to Class I or II subjects. Furthermore, Braun et al.

17

reported that dental arches associated with Class III malocclusion were wider than those of Class I.

The mandible of Class III cases may demonstrate a wider variety of relationships between the dental and basal arch forms compared to normal occlusion samples.

So far, dental casts or virtual models have been used to investigate dental and basal arch forms in different ske- letal classes, but no CBCT evaluation of the relationship between dental and basal arch forms in normal occlu- sion and Class III malocclusion has been reported.

There fore, the purpose of this study was to investigate the relationship between mandibular dental and basal arch forms in subjects with normal occlusion and for comparison with Class III malocclusion subjects using CBCT.

MATERIALS AND METHODS

CBCT images of subjects with normal occlusion and Class III malocclusion were selected for this study. The normal occlusion group, consisting of 32 dental students (19 males, 13 females), served as a control group and was selected from a sample pool of 480 students from

Wonkwang University, Iksan, Korea. Their ages ranged from 19.1 to 34.6 years (mean age, 24.3 years). They were classified as having a skeletal and dental Class I relationship; ANB angle of 0° to 2° and canine and molar Class I relationship.

For the Class III malocclusion group, which served as the experimental group, 33 patients (20 males, 13 females) were selected from a sample pool of 301 patients from Seoul St. Mary’s Hospital, The Catholic University of Korea. The ages ranged from 16.9 to 39.5 years (mean age, 22.2 years). These patients were diagnosed with skeletal and dental Class III malocclusions, with an ANB angle of less than 0° and Wits value of less than –4 mm. Exclusion criteria for both groups included (1) missing or decayed teeth;

(2) dental restorations that altered tooth size, shape, or location of the midpoint of the clinical crown; (3) prosthetic crowns or gingival defects; (4) arch length discrepancies greater than 3 mm crowding or 1 mm spacing; (5) facial asymmetry with unilateral or bilateral crossbite. Institutional Review Board approval for this study was granted by the Catholic Clinical Research Coordinating Center of Catholic University of Korea.

CBCT images of the head and neck of the normal occlusion group were acquired using the VEGA system (Asahi Roentgen Ind. Co. Ltd., Kyoto, Japan) with a 200

× 179-mm field of view, 80 kV, and 5 mA, resulting in 0.39-voxel resolution. CBCT images of the Class III malocclusion group were obtained using an iCAT scanner (Imaging Science International, Hatfield, PA, USA). The scanning parameters were 120 kV, 47.7 mA, 20 s per revolution, and a 170 × 130-mm field of view. These settings resulted in a voxel size of 0.4 mm.

Each subject’s head position was oriented so that the Frankfort plane was parallel to the floor in a seated position, and images were taken at the intercuspal position.

The CBCT data were exported in digital imaging and communications in medicine (DICOM) multi-file format and imported into InVivo5.1 software (Anatomage, San Jose, CA, USA) for 3D volume rendering. All mea- surements were made by the same operator (K.E.S).

Reorientation of the head position of each scan was

performed. The contact point between the mandibular

central incisors (MCI) was selected as the origin of the

X, Y, and Z coordinates. Then, the image was rotated so

the transverse reference plane (X-axis) coincided with

the occlusal plane, which connects the mesiobuccal cusp

tip of the right and left mandibular first molars and

the origin. The midsagittal plane (Y-axis) was defined

by passing a line through the MCI and parallel to the

anterior and posterior nasal spines. The vertical plane

(Z-axis) was perpendicular to both X and Y axes in which

the right, anterior, and superior directions were positive.

(3)

The anatomical reference points, the facial axis (FA) points

18

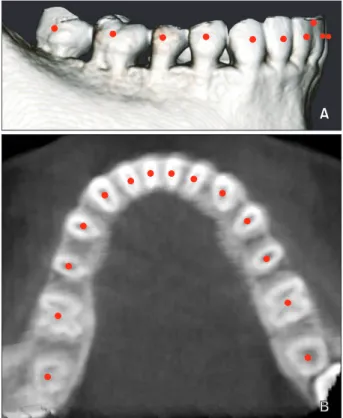
and root center (RC) points, were identified from the left to right first molar. The RC points were digitized at the center of the root on a transverse section parallel to the occlusal plane at the level of the coronal third of the right and left canine roots. This level was selected to correspond to the vertical level of the WALA point,

19

Figure 1. Digitized rendered view of a cone-beam com- puted tomography scan. A, Facial axis points. B, Root center points.

Figure 2. Schematic drawing for basal arch identification.

Blue dotted line, facial axis (FA) points; yellow dotted line, interrupted arch connecting the center of resistance of each tooth; red solid line, continuous arch parallel to the occlusal plane and at the level of the coronal third of canine roots.

Table 1. Definitions of arch form variables

Variable Definition

Dental intercanine width The distance between the FA points of the right and left canines Dental intermolar width The distance between the FA points of the right and left first molars

Dental intercanine depth The shortest distance from a line connecting the FA points of the right and left canines to the origin

Dental intermolar depth The shortest distance from a line connecting the FA points of the right and left first molars to the origin

Dental intercanine width/depth ratio Ratio between dental intercanine width and depth Dental intermolar width/depth ratio Ratio between dental intermolar width and depth

Basal intercanine width The distance between the root center points of the right and left canines Basal intermolar width The distance between the root center points of the right and left first molars Basal intercanine depth The shortest distance from a line connecting the root center points of the right and

left canines to the midpoint between the root center points of the right and left central incisors

Basal intermolar depth The shortest distance from a line connecting the root center points of the right and left first molars to the midpoint between the root center points of the two central incisors Basal intercanine width/depth ratio Ratio between basal intercanine width and depth

Basal intermolar width/depth ratio Ratio between basal intermolar width and depth

FA, Facial axis.

(4)

which is located at the most convex point on the MGJ, directly below the FA point and perpendicular to the occlusal plane (Figures 1 and 2).

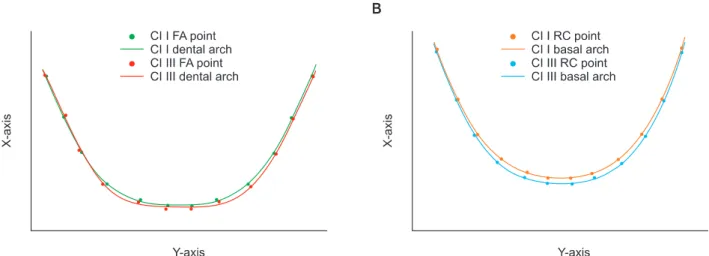
The coordinates of digitized points were then exported into Microsoft Office Excel 2007 (Microsoft, Redmond, WA, USA). Distances between the FA and RC points for each tooth were then calculated. Four linear and 2 ratio variables were measured and calculated for each arch form (Table 1). The best-fitting curves of mean FA and RC points for normal occlusion and Class III groups were constructed to illustrate arch form differences between the groups. The X and Y coordinates for the mean FA and RC points of each group were inputted into mathematical software (Matlab

®

7.5 [R2007b]; The MathWorks Inc., Natick, MA, USA) to generate the best- fitting curve that represented the arch using the fourth

degree polynomial equation:

f(x) = ax

4

+bx

3

+cx

2

+dx+e

To evaluate the intra-operator reliability of the FA and RC point identification, 30 randomly selected CBCT images from both groups were re-digitized 2 weeks later by the same examiner. Intraclass correlation coefficient (ICC), using a 2-factor mixed effect model and consistency as type, showed high reliability for dental (ICC ≥ 0.97) and basal measurements (ICC ≥ 0.95).

Statistical analysis

The dental and basal arch dimensions and the mean distances between the FA and RC points at each tooth were compared between normal occlusion and

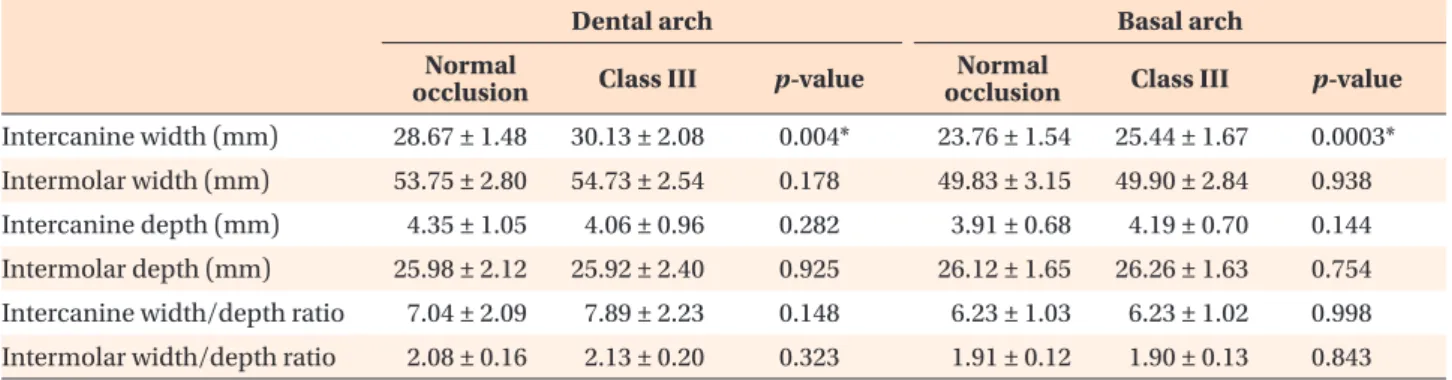
Table 2. Dental and basal intercanine and intermolar dimensions for normal occlusion and Class III groups

Dental arch Basal arch

Normal

occlusion Class III p-value Normal

occlusion Class III p-value Intercanine width (mm) 28.67 ± 1.48 30.13 ± 2.08 0.004* 23.76 ± 1.54 25.44 ± 1.67 0.0003*

Intermolar width (mm) 53.75 ± 2.80 54.73 ± 2.54 0.178 49.83 ± 3.15 49.90 ± 2.84 0.938 Intercanine depth (mm) 4.35 ± 1.05 4.06 ± 0.96 0.282 3.91 ± 0.68 4.19 ± 0.70 0.144 Intermolar depth (mm) 25.98 ± 2.12 25.92 ± 2.40 0.925 26.12 ± 1.65 26.26 ± 1.63 0.754 Intercanine width/depth ratio 7.04 ± 2.09 7.89 ± 2.23 0.148 6.23 ± 1.03 6.23 ± 1.02 0.998 Intermolar width/depth ratio 2.08 ± 0.16 2.13 ± 0.20 0.323 1.91 ± 0.12 1.90 ± 0.13 0.843 Values are presented as mean ± standard deviation.

Independent sample t-test; *p < 0.05.

NS, not significant.

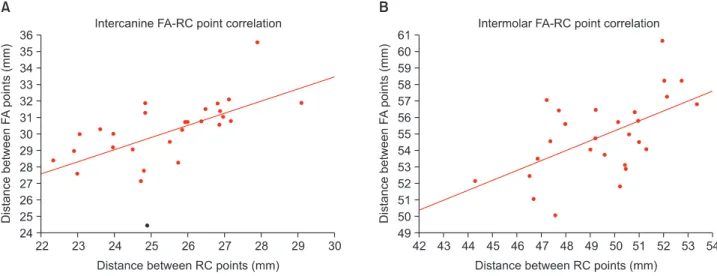
Figure 3. A, Scatter plot showing the correlation between the dental and basal mandibular intercanine widths in the

normal occlusion group ( r = 0.71, p < 0.001). B, Scatter plot showing the correlation between the dental and basal

mandibular intermolar widths in the normal occlusion group ( r = 0.76, p < 0.001). FA, Facial axis; RC, root center.

(5)

Class III groups by independent sample t-test. The correlation between the basal and dental intermolar and intercanine widths was evaluated by Pearson correlation independently in each group. p -values < 0.05 were considered statistically significant.

RESULTS

Dental and basal intercanine widths were the only di- mension that significantly differed between normal occlusion and Class III groups. For Class III subjects, the dental and basal intercanine widths were 30.13 and 25.44 mm, significantly larger than their normal occlusion counterparts, which were 28.67 and 23.76 mm, respectively (p < 0.05) (Table 2). In the normal occlusion group, strong positive correlations were found between intercanine dental and basal widths (r = 0.71;

p < 0.001) as well as between intermolar dental and basal widths (r = 0.76; p < 0.001) (Figure 3). In the Class III malocclusion group, moderate correlations were found between the intercanine dental and basal widths (r = 0.60; p < 0.001) as well as between the intermolar dental and basal widths (r = 0.62; p < 0.001) (Figure 4).

The distances between FA and RC points significantly differed between the 2 groups at each tooth except for the canines (Table 3). Best-fitting curves of the mean FA and RC points for both groups indicated that the differences were mainly in the anterior region, with the Class III arches appearing larger than the normal occlusion arches (Figure 5). The curves of the dental and basal arch forms for each group demonstrated different arch shapes as well (Figure 6).

DISCUSSION

Understanding the relationship between the dental and basal arch forms is of diagnostic and therapeutic importance because expansion of the dental arch is limited. Negative iatrogenic effects, such as dehiscences, have been reported as a complication in the anterior alveolar bone after retraction of the anterior teeth.

20

However, no method devised to date permits accurate determination of the basal arch form.

Recently, the relationship between dental and basal arch forms has been reported in Class I and II maloc- clusions.

5,6

However, no similar study has been con- ducted with Class III patients using CBCT imaging or 3D virtual models. Therefore, our study evaluated the relationship between dental and basal arch forms in Figure 4. A, Scatter plot showing correlation between the dental and basal mandibular intercanine widths in the Class III malocclusion group ( r = 0.60, p < 0.001). B, Scatter plot showing correlation between the dental and basal mandibular intermolar widths in the Class III malocclusion group ( r = 0.62, p < 0.001). FA, Facial axis; RC, root center.

Table 3. Horizontal distances between FA and RC points at each tooth for Class III malocclusion and normal occlu- sion groups (mm)

Class III Normal

occlusion p-value Central incisor 5.03 1.61 5.55 1.34 0.046*

Lateral incisor 4.86 1.46 5.39 1.25 0.027*

Canine 5.11 1.27 5.48 0.98 0.067

First premolar 4.31 1.02 4.78 0.92 0.007

Second premolar 4.06 1.14 4.41 0.81 0.049 First molar 5.46 0.91 5.92 1.16 0.012*

Values are presented as mean ± standard deviation.

Independent sample t-test; * p < 0.05,

p < 0.01.

(6)

subjects with normal occlusion and III malocclusion using CBCT imaging and compared the 2 groups. It would have been better if the same CBCT machine had been used in acquiring the data for both groups.

Although there is no difference in magnification in the resulting CBCT images, subjective image quality can vary between machines.

21

Interestingly, most studies conducted on the basal arch form suggested using landmarks located on the alveolar bone rather than the basal bone.

5-7,22-24

Thus, the term “basal arch” used in these studies, including ours, is a misnomer. Nonetheless, this basal arch, or more accurately “alveolar arch,” may be of more significance to clinical practice than the anatomical basal bone, since the alveolar process is the enclosing structure of the teeth.

With the advent of CBCT, a new landmark, i.e., RC,

was defined to assess the basal arch on CBCT images.

12

The RC point corresponds to the WALA point, but is lo cated inside the basal anatomical structure, and it approximates the center of resistance of each tooth.

There fore, the basal arch may be more accurately ex- pressed using this landmark rather than the WALA points on a virtual model. In addition, digitization of an anatomical landmark such as the root apex to identify the basal arch may be unreliable due to high variability in position and shape of the respective tooth. Hence, a constructed landmark such as the RC point may increase the reliability of results while accurately representing the basal arch form. The high associated radiation dose is a major disadvantage of CBCT. However, a recent study reported that for some CBCT machines, the effective dose could be as low as triple the dose of a dental panoramic view.

25

Nevertheless, the benefits of CBCT Figure 6. Best-fitting curves of the mean facial axis (FA) and root center (RC) points for the normal occlusion and Class III groups. A, normal occlusion; B, Class III. Units: mm.

Figure 5. Comparison of the best-fitting curves of the mean facial axis (FA) and root center (RC) points between the

normal occlusion and Class III groups. A, dental; B, basal arch. Units: mm.

(7)

imaging should be weighed against the radiation dose separately for each case.

In our study, RC points were digitized on a single trans verse section at the level of the coronal third of the canine roots, because applying separate transverse sections at the center of resistance of each tooth would not allow for consistent basal arch form. Also, since the average root length of mandibular teeth ranges from 12.6 to 15.9 mm,

26

the maximum difference in the length of one-third of a root, approximately 1.0 mm, is negligible (Figures 1B and 2).

Recently, Slaj et al.

16

evaluated dental arch dimensions on 3D models and reported larger intercanine and intermolar widths and depths in Class III malocclusion subjects when compared to Class I and II malocclusion cases. However, in our study, only intercanine dental and basal widths were significantly larger in the Class III group. As shown in Figure 5, best-fit curves showed differences mainly in the anterior region.

This inconsistency may be due to differences in the methodology and landmarks employed in these studies.

13,15,16

The best-fitting curves for the dental and basal arches of the Class III group demonstrated square- like arch forms (Figure 6). This finding is supported by previous studies reporting that the transverse dimension of Class III subjects is wider than that of Class I or II subjects.

13,15,16

The dental and basal intercanine and intermolar widths demonstrated strong correlations in the normal occlu sion group and moderate correlations in the Class III group. This finding suggests that the dental arch form corresponds to the basal arch form more strongly in normal occlusion than in Class III malocclusions, sup porting the “apical base” theory that the dental arch form is initially shaped by the configuration of its supporting bone, which limits dental arch expansion.

7

Recognition of the dimensions and shapes of the dental and basal arch forms, as well as their relationship, may help clinicians to accurately position teeth during treatment and preserve patients’

arch forms, which could in turn lead to more stable and predictable treatment outcomes.

Our results may be useful for clinicians to better under- stand the relationship between dental and basal arch forms in normal occlusion and Class III malocclusion patients. The stability of the treatment outcome may be questionable without consideration for the relationship between the dental and basal arch. In addition, evalua- tion of the dental and basal arch dimensions in diffe- rent Angle classifications should be followed by assess- ment of the different shapes of these arch forms, for example tapered, ovoid, and square. Previous studies demon strated different arch form distributions among different ethnic groups.

27-29

Therefore, evaluation of the

basal arches of different arch forms in different ethnic groups is recommended. Moreover, our relatively small sample size made it difficult to stratify the Class III group into mild, moderate, and severe cases; however, to achieve a homogenous group, all subjects in the Class III group were surgical cases. The effect of the severity of malocclusion on the basal arch form should also be evaluated. Additionally, further study is needed to determine whether anatomical landmarks other than RC points could serve as an even more accurate representation of basal bone. Finally, an investigation of the different types of basal arch forms is required.

CONCLUSION

Our findings from this CBCT study are summarized as follows.

1. The dental and basal intercanine widths were signi- ficantly larger in Class III subjects than in normal occlusion subjects.

2. Dental and basal arch widths were strongly correlated in the normal occlusion group and moderately cor- related in the Class III group.

3. These results might be helpful for clinicians to have a better understanding of the importance of basal arch form in the alveolar bone.

REFERENCES

1. Howes AE. Model analysis for treatment planning: a portion of a symposium on case analysis and treat- ment planning. Am J Orthod 1952;38:183-207.

2. Rees DJ. A method for assessing the proportional relation of apical bases and contact diameters of the teeth. Am J Orthod 1953;39:695-707.

3. Stevens DR, Flores-Mir C, Nebbe B, Raboud DW, Heo G, Major PW. Validity, reliability, and reproducibility of plaster vs digital study models: comparison of peer assessment rating and Bolton analysis and their constituent measurements. Am J Orthod Dentofacial Orthop 2006;129:794-803.

4. Quimby ML, Vig KW, Rashid RG, Firestone AR. The accuracy and reliability of measurements made on computer-based digital models. Angle Orthod 2004;74:298-303.

5. Ball RL, Miner RM, Will LA, Arai K. Comparison of dental and apical base arch forms in Class II Division 1 and Class I malocclusions. Am J Orthod Dentofacial Orthop 2010;138:41-50.

6. Gupta D, Miner RM, Arai K, Will LA. Comparison of the mandibular dental and basal arch forms in adults and children with Class I and Class II malocclusions.

Am J Orthod Dentofacial Orthop 2010;138:10.e1-8.

7. Ronay V, Miner RM, Will LA, Arai K. Mandibular arch

(8)

form: the relationship between dental and basal anatomy. Am J Orthod Dentofacial Orthop 2008;134:

430-8.

8. Cha BK, Lee YH, Lee NK, Choi DS, Baek SH. Soft tissue thickness for placement of an orthodontic miniscrew using an ultrasonic device. Angle Orthod 2008;78:403-8.

9. Berco M, Rigali PH Jr, Miner RM, DeLuca S, Ander- son NK, Will LA. Accuracy and reliability of linear cephalometric measurements from cone-beam com- puted tomography scans of a dry human skull. Am J Orthod Dentofacial Orthop 2009;136:17.e1-9.

10. Damstra J, Fourie Z, Huddleston Slater JJ, Ren Y.

Accuracy of linear measurements from cone-beam com puted tomography-derived surface models of different voxel sizes. Am J Orthod Dentofacial Orthop 2010;137:16.e1-11.

11. Tai K, Hotokezaka H, Park JH, Tai H, Miyajima K, Choi M, et al. Preliminary cone-beam computed tomo graphy study evaluating dental and skeletal changes after treatment with a mandibular Schwarz appliance. Am J Orthod Dentofacial Orthop 2010;

138:262.e1-262.e1-11.

12. Bayome M. Evaluation of three-dimensional relation- ships among skeletal, dentoalveolar, and soft tissue variables in normal occlusion sample [doctorial dis- ser tation]. Seoul, Korea: The Catholic University of Korea; 2011.

13. Kuntz TR, Staley RN, Bigelow HF, Kremenak CR, Kohout FJ, Jakobsen JR. Arch widths in adults with Class I crowded and Class III malocclusions compared with normal occlusions. Angle Orthod 2008;78:597- 603.

14. Al-Khateeb SN, Abu Alhaija ES. Tooth size discre- pancies and arch parameters among different maloc - clu sions in a Jordanian sample. Angle Orthod 2006;

76:459-65.

15. Uysal T, Usumez S, Memili B, Sari Z. Dental and alveolar arch widths in normal occlusion and Class III malocclusion. Angle Orthod 2005;75:809-13.

16. Slaj M, Spalj S, Pavlin D, Illes D, Slaj M. Dental archforms in dentoalveolar Class I, II and III. Angle Orthod 2010;80:919-24.

17. Braun S, Hnat WP, Fender DE, Legan HL. The form

of the human dental arch. Angle Orthod 1998;68:29- 36.

18. Andrews LF. The six keys to normal occlusion. Am J Orthod 1972;62:296-309.

19. Andrews LF, Andrews WA. The six elements of orofacial harmony. Andrews J 2000;1:13-22.

20. Sarikaya S, Haydar B, Ci ğer S, Ariyürek M. Changes in alveolar bone thickness due to retraction of anterior teeth. Am J Orthod Dentofacial Orthop 2002;122:15- 26.

21. Shelley AM, Brunton P, Horner K. Subjective image quality assessment of cross sectional ima- ging methods for the symphyseal region of the mandible prior to dental implant placement. J Dent 2011;39:764-70.

22. Howes AE. A polygon portrayal of coronal and basal arch dimensions in the horizontal plane. Am J Orthod 1954;40:811-31.

23. Kim KY, Bayome M, Kim K, Han SH, Kim Y, Baek SH, et al. Three-dimensional evaluation of the relation- ship between dental and basal arch forms in normal occlusion. Korean J Orthod 2011;41:288-96.

24. Sergl HG, Kerr WJ, McColl JH. A method of mea- suring the apical base. Eur J Orthod 1996;18:479- 83.

25. Ludlow JB, Ivanovic M. Comparative dosimetry of dental CBCT devices and 64-slice CT for oral and maxillofacial radiology. Oral Surg Oral Med Oral Pathol Oral Radiol Endod 2008;106:106-14.

26. Scheid RC, Weiss G, Woelfel JB. Woelfel’s dental anatomy. 8th ed. Philadelphia: Wolters Kluwer Health/Lippincott Williams & Wilkins; 2012.

27. Bayome M, Sameshima GT, Kim Y, Nojima K, Baek SH, Kook YA. Comparison of arch forms between Egyptian and North American white populations. Am J Orthod Dentofacial Orthop 2011;139:e245-52.

28. Kook YA, Nojima K, Moon HB, McLaughlin RP, Sinclair PM. Comparison of arch forms between Korean and North American white populations. Am J Orthod Dentofacial Orthop 2004;126:680-6.

29. Nojima K, McLaughlin RP, Isshiki Y, Sinclair PM. A comparative study of Caucasian and Japanese man- dibular clinical arch forms. Angle Orthod 2001;

71:195-200.

수치

Figure 1. Digitized rendered view of a cone-beam com- com-puted tomography scan.  A, Facial axis points
Table 2. Dental and basal intercanine and intermolar dimensions for normal occlusion and Class III groups
Table 3. Horizontal distances between FA and RC points  at each tooth for Class III malocclusion and normal  occlu-sion groups (mm)
Figure 5. Comparison of the best-fitting curves of the mean facial axis (FA) and root center (RC) points between the  normal occlusion and Class III groups

참조

관련 문서

In maxilla, arch perimeters and intermolar widths of crowded group were significantly smaller than normal occlusion group but intercanine width of crowded

Objective: The purpose of this study was to investigate the relationship between the awareness of death and the ethical attitude to Do-Not-Resuscitate (DNR) among some

Purpose: The aim of this study is to identify the relationship between knowledge and awareness of radiation department students and their intent in

Objective: The purpose of this study was to analyze recent trend in incidence of basal cell carcinoma and squamous cell carcinoma in patients from the Gwangju City

Actinic keratoses showed a trend towards increased expression in the basal layer compared with normal skin.. In actinic keratoses, Keratoacanthomas and seborrheic

Objective: The purpose of this study is to investigate the relationship between employee satisfaction and patient safety and quality improvement after compulsory certification

Objective: The purpose of this study is to investigate the relationship between depression and evening meals for adult women by using the National Health and Nutrition Survey

The purpose of this study was to analyze the impaction pattern of the impacted mandibular third molar and the relationship with the inferior alveolar nerve