413 DOI: 10.4196/kjpp.2010.14.6.413
ABBREVIATIONS: OMR, optomotor response; ETR, edge triggering response.
Received November 3, 2010, Revised December 13, 2010, Accepted December 14, 2010
Corresponding to: Chang-Sub Jung, Natural Sciences Section, Department of Medical Lifescience, College of Medicine, The Catholic University of Korea, 505, Banpo-dong, Socho-gu, Seoul 137-701, Korea. (Tel) 82-2-2258-7241, (Fax) 82-2-2258-7761, (E-mail) cjung@
catholic.ac.kr
The Role of the Pattern Edge in Goldfish Visual Motion Detection
Sun-Hee Kim, and Chang-Sub Jung
Natural Sciences Section, Department of Medical Lifescience, College of Medicine, The Catholic University of Korea, Seoul 137-701, Korea
To understand the function of edges in perception of moving objects, we defined four questions to answer. Is the focus point in visual motion detection of a moving object: (1) the body or the edge of the object, (2) the leading edge or trailing edge of the object, (3) different in scotopic, mesopic and photopic luminance levels, or (4) different for colored objects? W e measured the Optomotor Response (OMR) and Edge Triggering Response (ETR) of goldfish. W e used a square and sine wave patterns with black and red stripes and a square wave pattern with black and grey stripes to generate OMR’s and ETR’s in the goldfish. W hen we used black and red stripes, the black leading edges stimulated an ETR under scotopic conditions, red leading edges stimulated an ETR under photopic conditions, and both black and red leading edges stimulated an ETR under mesopic luminance levels. For black and gray stripes, only black leading edges stimulated an ETR in all three light illumination levels.
W e observed less OMR and ETR results using the sine wave pattern compared to using the square wave pattern. From these results, we deduced that the goldfish tend to prefer tracking the leading edge of the pattern. The goldfish can also detect the color of the moving pattern under photopic luminance conditions. We decided that ETR is an intriguing factor in OMR, and is suitable as a method of behavioral measurement in visual system research.
Key Words: Optomotor response, Goldfish, Edge, Leading, Motion detection
INTRODUCTION
We started our research by considering what part of an object is most salient to an animal’s optomotor system when it notices movement in an object. Our theory was that an object’s leading edge provides the first visual information regarding movement. Papers regarding the theoretical edge and line specific detectors supported our theory [1-8].
Marr & Hildreth [5] redefined the edge, as an area of dramatic change in intensity and as the mathematically calculated zero crossing point. They proposed that an ob- ject’s initial movement is detected at the edge. Morrone &
Burr described lines and edges as the points corresponding to maximum local energy by phase dependent energy mod- els [6]. Thus the detection process is based on finding zero crossings or maximal energy by these models. Morrone and Burr deduced their hypothesis from results which con- firmed the existence of edge detectors. Stimuli such as edges or lines evoke changes in action potentials in gan- glion cells [9] and simple striate cells [10], and at a later time the geniculate neurons in a cat’s retina [1,11]. Our behavioral experiments are the first regarding the focus point and triggers of motion detection. The research refer-
enced in this paragraph supports the validity of our experiments.
We measured the activation of optomotor response (OMR) in goldfish. OMR can be observed in free swimming fish. As the fish approaches the rotating pattern we detect the part of the pattern, which triggers OMR. The goldfish is an excellent subject for our experiments due to its ability to perceive color [12]. Our experiments indicated that the trigger of OMR in goldfish is the leading edge of the rotat- ing pattern, which may be colored under photopic conditions.
METHODS Animals
We used the goldfish (Carassius auratus) in our experi- ments. This vertebrate has predictable behavior and the ability to detect colors. The goldfish used in our experiment were 7∼9 cm in length and weighed 10∼16 g. We pur- chased them from a local fish shop and kept them in room temperature water. Normal lighting in the room was a 12 hour light/dark daily cycle and we fed them once a day.
Behavioral experiments
The set up for our experiments was similar to the equip- ment used by Schaerer & Neumeyer [13]. The cylinder (height: 170 mm, inner diameter: 150 mm) was spun
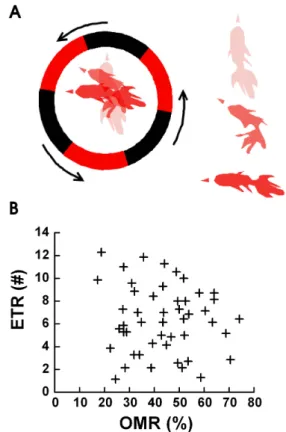
Fig. 1. The Definition of ETR (A) and ETR versus OMR (B). (A) We defined one ETR as when the head of the goldfish in the fish bowl starts to turn as the fish tracks a single edge of the black/red square wave pattern and turns at least 90 degrees (left side of Fig.
1A in circle) from the initial direction of head. The initial position of the goldfish is indicated by the lightest drawing, the next position is a darker drawing, and the last position is the darkest drawing (the point when the goldfish turned 90 degrees). On the right side of fig. 1a, the overlapped three stages of one goldfish ETR are shown separately from top to bottom. (B) A correlation graph between OMR and ETR from experiments with 50 goldfish. Both OMR and ETR were in a wide range from 1 to 12 or 20% to 75%
and had mean values of OMR=43.47±4.34% and ETR=6.38±2.91.
around a cylindrical fishbowl (height: 140 mm, inner diame- ter: 115 mm) containing the goldfish. Square and sine wave patterns of black and red stripes and square wave patterns of black and grey stripes, of spatial frequency 8.33×10⁻³ cycles deg−1 were used. We illuminated the stripes with white light using an LCD projector (Sharp XG-SV1A, Tokyo, Japan). Based on the design of experiments by Hood and Finkelstein [14], we selected scotopic, mesopic, and photopic illumination levels at 5,200 and 450 nW cm−2 re- spectively as our ambient light levels. We controlled the white light intensity using a computer connected to the projector. We measured the optical density of the luminance levels and the stripe surfaces with a radiometer (Internal light IL1400A radiometer, Newburyport, MA).
The low spatial frequency of a pattern at 12 rpm is useful for OMR and ETR calculations. Each measurement con- sisted of a 1 minute period of pattern rotation and a sub- sequent 30 second period without pattern movement. The cylinder was rotated clockwise first and then counter- clockwise alternately to prevent the goldfish from habituat- ing to the direction of cylinder movement. The OMR meas- urement process was conducted 7 times with this protocol.
OMR data were obtained by subtracting the turns in which the goldfish moved in the opposite direction to that of the pattern's rotation from those in which it moved in the same direction to the pattern's rotation, based on the direction of goldfish's head [OMR=(goldfish rotation number in one minute/pattern rotation number in one minute)×100 (%)].
Light and dark adaptation
The goldfish’s retina requires a period of adaptation to light or dark environments. Therefore, after placing the goldfish in the experiment fish bowl, we exposed the gold- fish to each specific light luminance condition for about 20 minutes and then proceeded with the experiment.
Statistical analysis
All data are reported as mean±S.E.M. Student’s t-test was used with p<0.05 as the criterion for statistical signifi- cance.
RESULTS The edge triggering response (ETR)
Fig. 1A shows a diagram of the change in head position when a goldfish is following the black and red pattern. The red arrowheads indicate the direction of initial position (bright red), middle position (darker red), and final position (very dark red) of the goldfish’s head. The ETR is defined as the specific behavior observed in goldfish when it follows the edge of a moving pattern. The goldfish’s head was al- most stationary in the beginning of the experiment. We de- fined one ETR as when the goldfish followed a single point on each rotating pattern and the goldfish’s head moved more than 90 degrees from the initial direction of head.
Fig. 1B shows the OMR and ETR results of experiments with 50 goldfish. The OMR and ETR induced by black and red 3 cycle patterns in the circle were random and their averages were as follows: OMR=43.47±4.34% and ETR=
6.38±2.91. The random and low OMR measurements were due to the use of a 3 cycle pattern resulting in a milder
stimulation of the goldfish. We were very precise in our ob- servations of each ETR. Previous experiments with 6 cycles per revolution gave a stable 71±1.2% OMR [15]. ETR meas- urements varied greatly with a range between 1 and 12, depending on the goldfish. We observed no correlation be- tween OMR and ETR, as shown in Fig. 1B.
Color detection and leading edge
In order to define the experimental situations when the ETR’s occur, we developed some terms by placing a bar re- lated characteristic in front of the word ETR with a dash.
For example, “red-ETR” as the triggered response observed when the fish perceives the leading edge of a red bar. A
“black-ETR” is when the leading edge of a black bar trig- gered a response. In each experiment total ETR’s are the sum of ETR’s generated by only the two colors on a pattern.
The term “ETR ratio” means the total measured ETR’s in an experiment, compared to ETR’s measured from one color on the pattern.
Fig. 3. OMR occurs when an edge is perceived. We measured the OMR and ETR responses induced by the square and sine wave patterns as shown on (A) under each light illumi- nation condition (n=8). (B) Under all three light illumination conditions, the OMR results decreased signifi- cantly when we changed to using the sine wave pattern. (C) Under all three light illumination conditions the black-ETR results from using the square wave pattern were signifi- cantly higher than when we used the sine wave pattern. The black-ETR from the square wave or sine wave pattern was the greatest under sco- topic conditions and decreased as the surroundings brightened. (D) The red-ETR from the square wave or sine wave pattern was the lowest under scotopic conditions and increa- sed as the surroundings brightened.
Under all three light illumination conditions, the red-ETR results dec- reased significantly when we used the sine wave pattern. *p<0.05 com- pared with square-wave pattern.
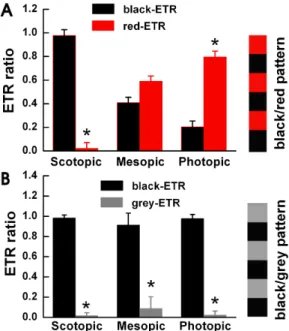
Fig. 2. The goldfish detects movement of color under photopic luminance conditions. We allowed the goldfish to adapt to the three light illumination conditions. We measured the ETR ratio using a square wave black/red pattern (n=5) in Fig. 2A and a black/grey pattern in Fig. 2B. (A) We observed mostly black-ETR’s under scotopic conditions, more red-ETR’s than black-ETR’s under photopic conditions, and almost equal amounts under mesopic conditions.
Each specimen displayed different results when stimulated with a black/grey pattern. (B) We used black/grey pattern stripes with identical contrast levels to the black/red pattern stripes used in Fig. 2A. Under all light conditions a black-ETR was the most frequent result. Before the experiment, we allowed each goldfish to adapt to its light level for about 20 minutes. Under the three light illumination levels, we measured similar contrast results of 0.4 (scotopic), 0.42 (mesopic), and 0.43 (photopic). Each bar repre- sents mean±S.E.M. *p<0.05 compared with black-ETR.
Fig. 2 compares ETR ratios between the black/red and black/gray pattern experiments under photopic, mesopic and scotopic conditions. We measured an ETR when the black/red pattern stimulated a single specimen. We used the black/red ETR results as our control. We then used a black/gray pattern on the same specimen (n=5). Fig. 2A shows the ETR ratio of the black/red pattern using three different illumination levels. We observed the black-ETR (0.98±0.05) mainly under the scotopic conditions and the red-ETR (0.80±0.05) under the photopic conditions. Under mesopic conditions, we observed both the black and red-ETR’s in similar values. When we used the black/gray pattern we measured an exceedingly high ratio of ETR’s to the black color under all three illumination levels (as shown in Fig 2B). Under photopic conditions, the ETR ratio compared to black increased from 0.20±0.05 with the black/red pattern to 0.98±0.04 with the black/gray pattern.
These results demonstrate that goldfish detect color in pho- topic conditions. Without color a goldfish only detect shades.
The results also demonstrate the tendency of goldfish to trail the leading edge of the pattern.
Definite edge
Fig. 3 shows OMR and ETR results using the black/red pattern and three luminance conditions. We used a square wave pattern with the control specimens and compared these results with the results from specimens exposed to sine wave patterns. When we compared the OMR results, the specimens exposed to the sine wave had over a 50%
reduction in OMR (Fig. 3B). We confirmed that an OMR frequently occurs in the presence of a pattern with definite edges and infrequently when a continuous smooth sine wave pattern is used. The goldfish needs a definite edge to track motion.
Fig. 3C displays a comparison of black-ETR’s with the square wave and sine wave patterns under identical con-
ditions (n=8). Under all three light conditions we observed a far greater number of black-ETR’s when we used the square wave pattern than when we used the sine wave pattern. Using both patterns, black-ETR’s were the highest under scotopic conditions and gradually decreased as the ambient conditions became darker. Fig. 3D shows a com- parison of red-ETR’s between the square and sine wave pat- terns, showing a gradual increase of red-ETR’s for both pat- terns under scotopic, mesopic, and photopic conditions. Under all three light conditions, red-ETR’s were significantly greater when we used the square wave pattern. Definite edges induce ETR’s, and more frequent generation of ETR’s induce more OMR’s in goldfish.
DISCUSSION
The goldfish swims following the cylindrical pattern at approximately 70% of the 12 rpm speed of the patterned cylinder [13,15]. The goldfish is unable to continuously cir- cle the bowl as quickly as the cylinder under normal conditions. The causes for this are complex and are seen in other types of behavioral experiments. The behavioral characteristic we were most interested in measuring was OMR, and the tendency of goldfish to track the rotating pattern. During the 1 minute period while the pattern ro- tated at 12 rpm, the goldfish frequently re-tracks the pat- tern (6.38±2.91 times in Fig. 1B). When we observed the goldfish carefully, we realized that most goldfish track the edges of the pattern rather than the middle of the pattern.
This is best observed when we used the 3 cycle pattern.
We confirmed a behavioral tendency for the goldfish to ig- nore the center of the moving pattern and to track the edge of the pattern for tracking purposes.
Interesting goldfish behaviors have been discovered in- cluding the compass reaction and escaping behavior [16,17].
To identify the direction of goldfish movement relative to compass headings, a pattern was placed under the fish bowl [16]. The pattern had 32 stripes on the disk and each stripe has two sectors with two different colors. When the width of stripes was small we could not accurately determine which point on the stripes the goldfish was tracking. Our solution to this problem was to use only 3 stripes with 2 bars in each stripe, for a total of 6 bars at 60 degrees per bar. Faber, Fetcho and Korn [17] carried out some interest- ing goldfish behavior research regarding retreating move- ment during escape. We discovered goldfish behavior is dif- ferent during an ETR. In our experiment, the goldfish tried to escape when we used a one cycle black/red stripe pattern on the cylinder around the fish bowl but this escaping be- havior changed to tracking behavior when we used 3 cycle black/red stripes on the cylinder. Our experimental con- ditions failed to induce optimum OMR because the 3 cycle stripes on the cylinder create a low spatial frequency. Since we focused on measuring ETR rather than OMR, the con- ditions allowed us to see the induction of goldfish ETR be- havior with our naked eyes.
We discovered a consistency in the goldfish’s response to the black/red pattern. When the goldfish was exposed to the black/red pattern, the number of times the red edge triggered an ETR and the number of times the black edge triggered an ETR was different for each goldfish. The inter- esting observation was that the ratio of red- to black-ETR’s was consistent in most goldfish under photopic conditions.
For example, with the first goldfish we would measure 2
red-ETR responses and 4 black-ETR responses using the black/red pattern, creating a ratio of 1:2. On the next gold- fish we would measure three times the number of black- ETR and red-ETR responses but the ratio of red- to black- ETR’s was very similar to the first goldfish. Our conclusion is that edge colors of a pattern are an important character- istic which generate significantly different ETR responses.
We decided to define these results as a “color related” ETR.
There are two edges in a moving pattern. Depending on the direction of movement the edges are designated as ei- ther the leading or trailing edge. We used the black and red colors and the black and gray colors with the square pattern to compare ETR’s generated by the leading edge versus the trailing edge. We noticed that the leading edge creates significantly more ETR results. The data was not reliable concerning the trailing edge ETR results. We con- cluded that goldfish prefer tracking the leading edge of the pattern and may not perceive the trailing edge of the pattern. When we used the black/gray pattern we measured an exceedingly high ratio of ETR’s to the black color under all three illumination levels (as shown in Fig. 2B). Under photopic conditions, the ETR ratio compared to black in- creased from 0.20±0.05 with the black/red pattern to 0.98±
0.04 with the black/gray pattern. These results demon- strate that goldfish detect color in photopic conditions.
We analyzed the edge characteristics of color and pattern the goldfish perceive, compared to the rotating direction of the pattern. We found that there was no difference in the results when the pattern was moving either clockwise or counter clockwise. We found other factor effects ETR results. We defined a “pattern related” characteristic be- cause when we use a different pattern, square versus sine, we get significantly different results. When we used the sign wave black/red pattern in three different illumination levels, both the OMR and ETR decreased significantly com- pared to the values obtained when we used the square wave pattern (Fig. 3). It is unclear whether this reduction is due to the decrease in contrast or blurring of the edges. We think that both conditions have an effect. The black/red pat- tern on the cylinder has a slope which not only blurs the edges but also decreases the contrast between the two stripes.
The response of ganglion cells within the retinal receptive field of cats depends on the position of the stimulating ob- ject’s edge within the retina receptive field [9]. When the stimulating edge was positioned in the center of the field, they observed no change in the cell’s discharge, while they obtained maximum change in pulse density when the edge was a short distance (0.3 deg) to either side of the center.
The research also identified a reduction in response when a specimen was exposed to an object with low contrast edges. Enroth-Cugell and Robson’s experiment was in vitro [9]. Goodwin and colleagues did experiments with cats re- lated to edge stimulation [10]. Their experiments were in vitro, on cat simple strait cortex cells. They deduced that the specimen cells react to movement of light and dark edges in the same way. Our in vivo experiments with gold- fish proved that we can induce a specific behavior by acti- vating a goldfish’s visual system with moving edges.
ACKNOWLEDGEMENTS
We thank Dave Hansford for assisting us with English editing. This research was supported by Basic Science
Research Program through the National Research Founda- tion of Korea (NRF) funded by the Ministry of Education, Science and Technology (2010-0012276). The authors wish to acknowledge the financial support of the Catholic Medical Center Research Foundation made in the program year of 2010.
REFERENCES
1. Field DJ, Tolhurst DJ. The structure and symmetry of simple- cell receptive-field profiles in the cat's visual cortex. Proc R Soc Lond B Biol Sci. 1986;228:379-400.
2. Hesse GS, Georgeson MA. Edge and bars: Where do people see features in 1-D images? Vision Res. 2005;45:507-525.
3. Kern R, Egelhaaf M, Srinivasan MV. Edge detection by landing honeybees: Behavioural analysis and model simulations of the underlying mechanism. Vision Res. 1997;37:2103-2117.
4. Kulikowski JJ, Abadi R, King-Smith PE. Orientational selectivity of grating and line detectors in human vision. Vision Res.
1973;13:1479-1486.
5. Marr D, Hildreth E. Theory of edge detection. Proc R Soc Lond B Biol Sci. 1980;207:187-217.
6. Morrone MC, Burr DC. Feature detection in human vision: a phase-dependent energy model. Proc R Soc Lond B Biol Sci.
1988;235:221-245.
7. Shapley RM, Tolhurst DJ. Edge detectors in human vision. J Physiol. 1973;229:165-183.
8. Tolhurst DJ. On the possible existence of edge detector neurones in the human visual system. Vision Res. 1972;12:797-804.
9. Enroth-Cugell C, Robson JG. The contrast sensitivity of retinal ganglion cells of the cat. J Physiol. 1966;187:517-552.
10. Goodwin AW, Henry GH, Bishop PO. Direction selectivity of simple striate cells: properties and mechanism. J Neurophysiol.
1975;38:1500-1523.
11. Dreher B, Sanderson KJ. Receptive field analysis: Responses to moving visual contours by single lateral geniculate neurones in the cat. J Physiol. 1973;234:95-118.
12. Cronly-Dillon JR, Muntz WRA. The spectral sensitivity of the goldfish and the clawed toad tadpole under photopic conditions.
J Exp Biol. 1965;42:481-493.
13. Schaerer S, Neumeyer C. Motion detection in goldfish investi- gated with the optomotor response is “color blind”. Vision Res.
1996;36:4025-4034.
14. Hood DC, Finkelstein MA. Sensitivity to light. In: Boff KR, Kaufman L, Thomas JP, eds. Handbook of Perception and Human Performance. New York: Wiley; 1986. 5-1-5-66 p.
15. Lee SY, Jung CS. Intraocular injection of muscimol induces illusory motion reversal in goldfish. Korean J Physiol Pharmacol.
2009;13:469-473.
16. Anstis S, Hutahajan P, Cavanagh P. Optomotor test for wavelength sensitivity in Guppyfish (Poecilia reticylata). Vision Res. 1998;38:45-53.
17. Faber DS, Fetcho JR, Korn H. Neuronal networks underlying the escape response in goldfish. General implications for motor control. Ann NY Acad Sci. 1989;563:11-33.