INTRODUCTION
Cardiovascular disease (CVD) is among the main causes of de-
ath in the Korean adult population. A study on causes of death in 2015, carried out by the Korean national statistical office, showed that cardiac disorder (10.3%) and cerebrovascular dis- eases (8.9%) were second only to cancer (27.9%) as primary causes of death.1 Dyslipidemia, hypertension, and diabetes are risk factors of CVD, as well as preceding diseases.2-4 Thus, im- proving the management of such diseases can be an effective measure to prevent CVD.
Dyslipidemia includes not only hypercholesterolemia, but also hypertriglyceridemia, hyper-low-density lipoprotein (LDL)- cholesterolemia, and hypo-high-density lipoprotein (HDL)- cholesterolemia. According to a 2015 report from the Korean So- ciety of Lipidology and Atherosclerosis, 47.8% of Korean adults aged 30 years old and older were diagnosed with dyslipidemia.5 Considering the rates of hypertension (30%) and diabetes (10%) diagnosed in the same group,6 the prevalence of dyslipidemia is the highest of the three. However, awareness and treatment
Management Status of Cardiovascular Disease Risk Factors for Dyslipidemia among Korean Adults
Jongseok Lee
1, Heejeong Son
2*, and Ohk-Hyun Ryu
3*
1School of Business Administration, Hallym University, Chuncheon;
2Department of Anesthesiology, Kangwon National University School of Medicine, Kangwon National University Hospital, Chuncheon;
3Department of Internal Medicine, College of Medicine, Hallym University, Chuncheon Sacred Heart Hospital, Chuncheon, Korea.
Purpose: Dyslipidemia, hypertension, and diabetes are well-established risk factors for cardiovascular disease (CVD). This study in- vestigated the prevalence and management status of these factors for dyslipidemia among Korean adults aged 30 years old and older.
Materials and Methods: The prevalence and management status of dyslipidemia, hypertension, and diabetes were analyzed among 12229 subjects (≥30 years) participating in the Korea National Health and Nutrition Survey 2010–2012. Dyslipidemia was defined ac- cording to treatment criteria rather than diagnostic criteria in Korea. Therefore, hyper-low-density lipoprotein (LDL) cholesterolemia was defined if LDL cholesterol levels exceeded the appropriate risk-based threshold established by the National Cholesterol Educa- tion Program Adult Treatment Panel III.
Results: The age-standardized prevalence was highest for dyslipidemia (39.6%), followed by hypertension (32.8%) and diabetes (9.8%). The lowest patient awareness was found for dyslipidemia (27.9%). The treatment rate was 66.5% for diabetes and 57.3% for hypertension, but only 15.7% for dyslipidemia. The control rate among those undergoing treatment was highest for hypertension (64.2%), followed by dyslipidemia (59.2%) and diabetes (22.1%). The higher the risk levels of CVD were, the lower the control rate of dyslipidemia.
Conclusion: While the prevalence of dyslipidemia was higher than hypertension and diabetes, awareness and treatment rates thereof were lower. Higher CVD-risk categories showed lower control rates of dyslipidemia. In order to improve awareness and control rates of dyslipidemia, diagnostic criteria should be reconciled with treatment targets based on cardiovascular risk in Korean populations.
Key Words: Management, dyslipidemia, diabetes mellitus, hypertension
pISSN: 0513-5796 · eISSN: 1976-2437
Received: July 5, 2016 Revised: October 13, 2016 Accepted: October 15, 2016
Co-corresponding authors: Dr. Heejeong Son, Department of Anesthesiology, Kangwon National University School of Medicine, Kangwon National University Hospital, 156 Baengnyeong-ro, Chuncheon 24289, Korea.
Tel: 82-33-258-2977, Fax: 82-33-258-2459, E-mail: [email protected] and Dr. Ohk-Hyun Ryu, Department of Internal Medicine, College of Medicine, Hallym University, Chuncheon Sacred Heart Hospital, 77 Sakju-ro, Chuncheon 24253, Korea.
Tel: 82-33-240-5833, Fax: 82-33-255-4291, E-mail: [email protected]
*Heejeong Son and Ohk-Hyun Ryu contributed equally to this work.
•The authors have no financial conflicts of interest.
© Copyright: Yonsei University College of Medicine 2017
This is an Open Access article distributed under the terms of the Creative Com- mons Attribution Non-Commercial License (http://creativecommons.org/licenses/
by-nc/3.0) which permits unrestricted non-commercial use, distribution, and repro- duction in any medium, provided the original work is properly cited.
Yonsei Med J 2017 Mar;58(2):326-338 https://doi.org/10.3349/ymj.2017.58.2.326
rates of dyslipidemia are reported to be lower than those for hy- pertension and diabetes. According to the Korea Health Statis- tics of 2012, the awareness of hypercholesterolemia remained at 47.4% with a treatment rate of 37.3%. In the same period, awareness of hypertension and diabetes reached 65.9% and 72.7%, with treatment rates of 60.7% and 63.9%, respectively.7 Analyses of the Korea National Health and Nutrition Examina- tion Survey (KNHANES) data (Roh, et al.)8 showed that only 13.7% of those diagnosed with dyslipidemia had awareness of their disease, and the treatment rate remained at 7.4%.
The National Health Insurance benefit criteria, which de- cides the actual form of treatment, designates dyslipidemia as hypercholesterolemia, and its application is limited to hyper- LDL-cholesterolemia and hypertriglyceridemia only.9 In 2014, the National Health Insurance benefit criteria shifted its stan- dard from its original total cholesterol basis to an LDL choles- terol basis, because LDL cholesterol is the primary target of therapy for dyslipidemia.10 The treatment guidelines for dys- lipidemia categorize patients into four CVD risk categories ac- cording to number of present risk factors, and applies a graded LDL cholesterol cut-off (160, 130, 100, and 70 mg/dL) for each category.11 The National Health Insurance benefit criteria ag- rees with the National Cholesterol Education Program Adult Treatment Panel III (updated NCEP-ATP III).11 For triglycerides, the number of risk factors and the presence or absence of dia- betes decide which of the two graded cut-offs (200 or 500 mg/
dL) is applied.10
The Korea National Health Screening Program (KNHSP) ac- cepts the term dyslipidemia, and its diagnostic criteria are total cholesterol ≥240 mg/dL, LDL cholesterol ≥160 mg/dL, HDL cholesterol <40 mg/dL, or triglycerides ≥200 mg/dL.12 Howev- er, CVD risk factors and their levels are not applied in the di- agnostic criteria of the KNHSP. Consequently, the diagnostic criteria do not agree with treatment guidelines that take CVD risk factors and levels thereof into account, and this vagueness causes confusion for health care providers in both diagnosis and treatment. As a result, patient awareness and treatment rates of dyslipidemia remain considerably low.
The objective of this study was to utilize the results of the KNHANES, which are representative of the general population of adults in Korea, in order to understand the prevalence and management status of CVD risk factors (dyslipidemia, hyper- tension, and diabetes) for dyslipidemia and to propose policy changes. Notably, the prevalence and management status of dyslipidemia was analyzed not by the diagnostic criteria of the KNHSP, but by treatment guidelines (i.e., the National Health Insurance benefit criteria). For this reason, the prevalence, aw- areness, treatment rate, and control rates of dyslipidemia were calculated and evaluated by sex and risk category. The relative influence of risk factors such as hypertension and diabetes on the occurrence of hyper-LDL-cholesterolemia was also evalu- ated.
MATERIALS AND METHODS
Study participants
This study is a secondary data analysis from phase 5 of the KNHANES from 2010 to 2012. The KNHANES is a nationwide cross-sectional survey carried out annually by Korea Centers for Disease Control and Prevention (KCDC). Subjects are hier- archically extracted to represent the population of Korea. For the fourth and fifth phases, rolling survey sampling was em- ployed in order to extract similar subjects yearly. Of the health behavior investigation, examination investigation, and nutri- tion examination that are included in the survey, this study employed the materials from health surveys and examination surveys, accordingly to KCDC regulations regarding the disclo- sure and use of raw data. In order to increase the number of sa- mples, we included data collected during all three years (2010–
2012) of the phase 5 survey. We included only data on the 12229 adults (M: 5020, F: 7209) aged 30 years old and older who had no missing values for any of the research variables we exam- ined. The yearly composition of samples from the survey was 4053 (M: 1677, F: 2376) in 2010, 4202 (M: 1714, F: 2488) in 2011, and 3974 (M: 1629, F: 2345) in 2012.
Measurement of variables and definitions Body measurement and blood specimen/pressure tests Weight, height, and waist measurements were taken into ac- count. Height and weight were measured in lightweight cloth- ing by the Seca 225 (Seca Deutchland, Hamburg, Germany) and the GL-6000-20 scale (CAS-Korea, Seoul, Korea). Waist cir- cumference was measured at the midpoint between the bot- tom of the rib cage and above the top of the iliac crest during minimal respiration. Body mass index (BMI) was calculated as the weight (kilograms) divided by the square of the height (me- ters squared).
Blood pressure was found through the average value of two separate measurements using a mercury sphygmomanometer (Baumanometer, W.A., Baum Company, Copiague, NY, USA) of diastolic and systolic blood pressure, each after 10 minutes of relaxation. Blood tests were taken with the Hitachi Automatic Analyzer 7600 (Hitachi, Tokyo, Japan) after 12 hours of fasting to measure fasting blood glucose, total cholesterol, LDL cho- lesterol, HDL cholesterol, and triglycerides. On the occasions that triglycerides measurements were found to be below 400 mg/dL, LDL cholesterol was calculated using the Friedewald formula, as follows: LDL cholesterol=total cholesterol-HDL cholesterol-(triglycerides/5). If triglycerides measurements were over 400 mg/dL, the actual measurement of the LDL cho- lesterol was taken into account.
Diagnosis of obesity, hypertension, and diabetes
Obesity was defined as BMI ≥25 kg/m2 according to the WHO’s cut-off points for Asian populations.13 Central obesity was de-
fined as over 90 cm in waist circumference for males and over 85 cm for females. Hypertension was defined by systolic blood pressure ≥140 mm Hg, diastolic blood pressure ≥90 mm Hg, a doctor’s diagnosis, or the use of hypertension medicines. Fol- lowing the current WHO guidelines,14 diabetes was defined as a fasting blood glucose ≥126 mg/dL, a doctor’s diagnosis, or the use of diabetes medications or insulin injections.
CVD risk factors and categories
Risk level was classified into very high, high, moderate, and low risk categories following dyslipidemia treatment guidelines15 revised in 2015. Individuals with a clinical history of CVD (cere- bral infarction, myocardial infarction, or angina) were classified into the very high risk category, while diabetes patients were categorized into the high risk category. Information on clinical history of carotid artery disease or abdominal aortic aneurysm had not been collected by the KNHANES, and thus only patients with diabetes were included in the high-risk category. The fol- lowing risk factors were evaluated in order to define the mod- erate risk category (presence of two or more factors) and low risk category (presence of none or one factor): smoking, hyperten- sion, low HDL cholesterol (<40 mg/dL), age (M: over 45, F: over 55), and clinical history of CVD among family members (history of cerebral infraction, myocardial infarction, or angina in a direct family member, that is, aparent or sibling). High HDL choles- terol (≥60 mg/dL) was deemed to be a protective factor, reduc- ing the number of pertinent risk factors by one.
Diagnosis of dyslipidemia according to treatment criteria The primary goal of dyslipidemia treatment is to lower LDL cholesterol levels below a target level. The target LDL choles- terol levels by risk categories were as follows: very high risk
<70 mg/dL; high risk <100 mg/dL; moderate risk <130 mg/dL;
and low risk <160 mg/dL. Thus, hyper-LDL-cholesterolemia was defined as an LDL cholesterol level above the target level of the relevant risk category, a doctor’s diagnosis, or use of cho- lesterol lowering agents. For those deemed low risk, hypertri- glyceridemia was defined as when triglycerides ≥500 mg/dL and for the group who had one or more risk factors, triglycer- ides ≥200 mg/dL. Dyslipidemia was defined as hyper-LDL- cholesterolemia or hypertriglyceridemia following the NCEP ATP III.
Awareness, treatment rate, and control rate
Awareness of dyslipidemia, hypertension, and diabetes were measured as a percentage of those who have answered “yes”
to the question “Have you ever been diagnosed with this dis- ease by a doctor?” Treatment rate was measured as a percentage of those using medication among patients. For dyslipidemia patients, those who were taking cholesterol-lowering agents for more than 20 days per month were taken into account. Pa- tients whose cholesterol, dyslipidemia, blood pressure, and/
or HbA1c had been controlled under the diagnostic standards
were accounted for in the proportion classified into the con- trolled group. Rather than evaluating fasting blood glucose to determine whether diabetes was “controlled,” it was defined by an HbA1c level under 6.5%.
Diagnosis of the metabolic syndrome
In accordance with the standards of the NCEP-ATP III from the 2011 U.S. NCEP,10 diagnosis of the metabolic syndrome was made when three or more of the following indices were relevant:
central obesity: waist circumference ≥90 cm (M), ≥85 cm (F);
diabetes: fasting blood glucose ≥100 mg/dL or history of dia- betes; hypertension: systolic/diastolic blood pressure ≥130/85 mm Hg or history of hypertension; hypertriglyceridemia: tri- glycerides ≥150 mg/dL; and hypo-HDL-cholesterolemia: HDL cholesterol <40 mg/dL (M), <50 mg/dL (F).
Analysis
Data were analyzed using IBM SPSS Statistics for Windows (ver- sion 21.0; IBM Corp., Armonk, NY, USA). All statistical outcomes were based on two-sided tests, and a p value less than 0.05 was considered statistically significant. Data are presented as means and standard deviations for continuous variables and frequen- cies and percentages for categorical variables. To compare the difference between men and women, a t test for two indepen- dent samples was used for continuous variables, and Fisher’s exact test was used for categorical variables. The age-standard- ized prevalence, awareness, treatment, and control rates were calculated using the age- and sex-specific structures of estimat- ed population based on the 2010 Korea Census (Supplemen- tary Table 1, only online). Fisher’s exact test was conducted to examine differences in age-standardized rates between men and women. One-way analysis of variance was performed for multiple comparison of the mean risk factors among the risk categories. The chi-square test for trend was carried out to eval- uate differences in the prevalence and management of dyslip- idemia among the risk levels for CVD. To assess the relative influence of risk factors on hyper-LDL-cholesterolemia, logis- tic regression analysis was performed by sex.
RESULTS
Characteristics of cardiovascular risk factors of research subjects
The characteristics of each risk factor of CVD and their differ- ences by sex are shown in Table 1. The average age of the 12229 subjects, who were all 30 years old and over, was 54.1 years.
The average total cholesterol, LDL cholesterol, HDL choles- terol, and triglyceride levels were 192.2 mg/dL, 117.4 mg/dL, 49.0 mg/dL, and 130.5 mg/dL, respectively. The average total cholesterol, LDL cholesterol, and HDL cholesterol levels were found to be higher in females than in males, while the average triglyceride levels were higher in males than in females. The av-
erage systolic and diastolic blood pressure levels were 121.4 mm Hg and 76.6 mm Hg, respectively; and both were higher in males than in females. Average fasting blood glucose was 98.8 mg/dL, with males averaging higher than females.
Prevalence and management of dyslipidemia
The age-standardized prevalence of the adults, who were 30 years of age and older, was 39.6%, and the awareness, treatment, and control rates of a diagnosed patient were 27.9, 15.7, and 13.2%, respectively. The control rate was 59.3% among treated individuals (Table 2). Prevalence was higher in the male pop- Table 1. Characteristics of Risk Factors for Cardio-Cerebrovascular Disease of the Study Population*
Variables Total (n=12229) Gender
p value† Men (n=5020) Women (n =7209)
Age, yrs 54.1±14.3 54.8±14.2 53.6±14.3 <0.001
Obesity
BMI, kg/m2 23.8±3.3 24.0±3.0 23.7±3.4 <0.001
WC, cm 81.8±9.6 84.9±8.6 79.5±9.6 <0.001
BMI ≥25 kg/m2 4022 (32.9) 1791 (35.7) 2231 (30.9) <0.001
WC ≥90 cm in men ≥85 in women 3369 (27.5) 1379 (27.5) 1990 (27.6) 0.885
Dyslipidemia
TC, mg/dL 192.2±36.2 189.2±35.8 194.3±36.3 <0.001
LDL-C, mg/dL 117.4±32.5 113.8±32.7 119.9±32.1 <0.001
HDL-C, mg/dL 49.0±11.4 46.2±10.8 50.9±11.4 <0.001
TG, mg/dL 130.5±87.2 149.1±104.0 117.6±70.4 <0.001
TC ≥240 mg/dL 1180 (9.6) 392 (7.8) 788 (10.9) <0.001
LDL-C ≥160 mg/dL 1196 (9.8) 399 (7.9) 797 (11.1) <0.001
HDL-C <40 mg/dL 2809 (23.0) 1592 (31.7) 1217 (16.9) <0.001
TG ≥200 mg/dL 1845 (15.1) 1045 (20.8) 800 (11.1) <0.001
Diagnosis 1518 (12.4) 548 (10.9) 970 (13.5) <0.001
Medication use 908 (7.4) 312 (6.2) 596 (8.3) <0.001
Hypertension
SBP, mm Hg 121.4±17.6 123.6±16.4 119.8±18.3 <0.001
DBP, mm Hg 76.6±10.4 79.2±10.6 74.9±9.9 <0.001
SBP ≥140 mm Hg 1853 (15.2) 788 (15.7) 1065 (14.8) 0.166
DBP ≥90 mm Hg 1484 (12.1) 865 (17.2) 619 (8.6) <0.001
Diagnosis 3191 (26.1) 1320 (26.3) 1871 (26.0) 0.676
Medication use 2890 (23.6) 1178 (23.5) 1712 (23.7) 0.729
Diabetes
Fasting glucose, mg/dL 98.8±22.4 101.8±24.3 96.6±20.6 <0.001
Fasting glucose ≥126 mg/dL 873 (7.1) 464 (9.2) 409 (5.7) <0.001
Diagnosis 1105 (9.0) 547 (10.9) 558 (7.7) <0.001
Medication use 986 (8.1) 482 (9.6) 504 (7.0) <0.001
Cardio-cerebrovascular disease
Stroke 256 (2.1) 146 (2.9) 110 (1.5) <0.001
Myocardial infarction 114 (0.9) 70 (1.4) 44 (0.6) <0.001
Angina pectoris 295 (2.4) 131 (2.6) 164 (2.3) 0.255
Other risk factor
Current smoking 2047 (16.7) 1785 (35.6) 262 (3.6) <0.001
Aging‡ 6906 (56.5) 3538 (70.5) 3368 (46.7) <0.001
Family history§ 2171 (17.8) 877 (17.5) 1294 (17.9) 0.501
HDL-C ≥60 mg/dL 2018 (16.5) 537 (10.7) 1481 (20.5) <0.001
BMI, body mass index; WC, waist circumference; TC, total cholesterol; LDL-C, low-density lipoprotein cholesterol; HDL-C, high-density lipoprotein cholesterol;
TG, triglycerides; SBP, systolic blood pressure; DBP, diastolic blood pressure.
*Values are presented as mean±standard deviation for continuous variables and frequency (percentage) for categorical variables, †p values were calculated t- test for two independent samples or Fisher’s exact two-tailed test, ‡Aging: age ≥45 years in men, or ≥55 years in women, §Family history of cardio-cerebrovas- cular disease: stroke, myocardial infarction, and angina pectoris in first-degree relative.
ulation (M: 45.6% vs. F: 33.9%), although awareness, treatment, and control rates were lower (M: 21.3% vs. F: 34.1%, M: 11.3%
vs. F: 19.7%, and M: 8.9% vs. F: 17.1%, respectively). The control rate among the treated was also found to be lower in males than females (53.2% vs. 65.0%).
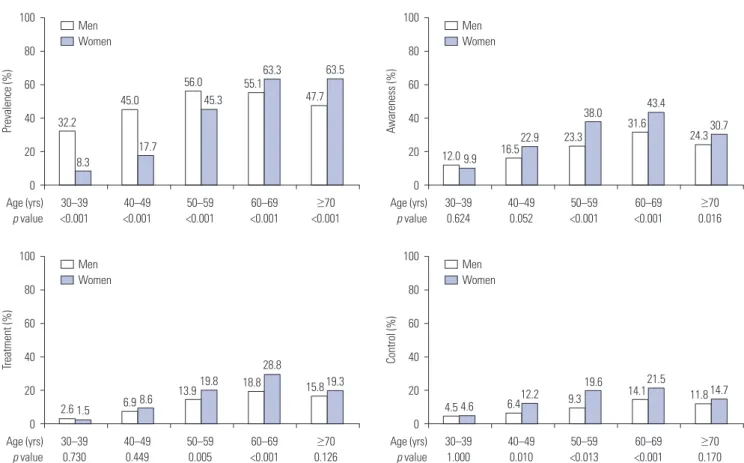
Fig. 1 illustrates sex differences in prevalence, awareness, treatment, and control rates among age groups. For those in their 30’s, 40’s, and 50’s, the prevalence in the male population was higher than in females; prevalence in the female population rapidly rose after their 50’s. In the 60’s and 70’s age groups, the prevalence of dyslipidemia was higher in the female population.
Awareness was higher in females than in males across all age groups, and the difference was significant in all groups, except those in their 30’s. In the 50’s and 60’s age groups, treatment rates were significantly higher in females, and control rates in the female group were significantly higher than in the males in the 40’s and 50’s age groups.
The distribution and average of the number of risk factors per risk category are shown in Table 3. Therein, 3.4% of the very high risk category and 6.1% of the high risk category were with- out any risk factors. The average number of risk factors was largest in the moderate risk category (2.45), followed by the very Table 2. Prevalence, Awareness, and Management of Dyslipidemia, Hypertension, and Diabetes
Prevalence Awareness Treatment Control Control among treated
n (%) p value* n (%) p value* n (%) p value* n (%) p value* n (%) p value*
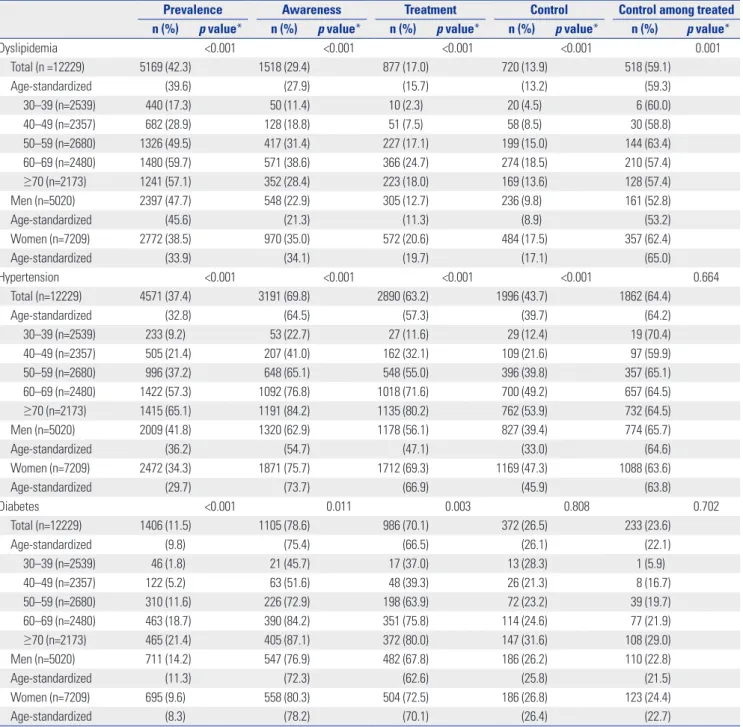
Dyslipidemia <0.001 <0.001 <0.001 <0.001 0.001
Total (n =12229) 5169 (42.3) 1518 (29.4) 877 (17.0) 720 (13.9) 518 (59.1)
Age-standardized (39.6) (27.9) (15.7) (13.2) (59.3)
30–39 (n=2539) 440 (17.3) 50 (11.4) 10 (2.3) 20 (4.5) 6 (60.0)
40–49 (n=2357) 682 (28.9) 128 (18.8) 51 (7.5) 58 (8.5) 30 (58.8)
50–59 (n=2680) 1326 (49.5) 417 (31.4) 227 (17.1) 199 (15.0) 144 (63.4)
60–69 (n=2480) 1480 (59.7) 571 (38.6) 366 (24.7) 274 (18.5) 210 (57.4)
≥70 (n=2173) 1241 (57.1) 352 (28.4) 223 (18.0) 169 (13.6) 128 (57.4)
Men (n=5020) 2397 (47.7) 548 (22.9) 305 (12.7) 236 (9.8) 161 (52.8)
Age-standardized (45.6) (21.3) (11.3) (8.9) (53.2)
Women (n=7209) 2772 (38.5) 970 (35.0) 572 (20.6) 484 (17.5) 357 (62.4)
Age-standardized (33.9) (34.1) (19.7) (17.1) (65.0)
Hypertension <0.001 <0.001 <0.001 <0.001 0.664
Total (n=12229) 4571 (37.4) 3191 (69.8) 2890 (63.2) 1996 (43.7) 1862 (64.4)
Age-standardized (32.8) (64.5) (57.3) (39.7) (64.2)
30–39 (n=2539) 233 (9.2) 53 (22.7) 27 (11.6) 29 (12.4) 19 (70.4)
40–49 (n=2357) 505 (21.4) 207 (41.0) 162 (32.1) 109 (21.6) 97 (59.9)
50–59 (n=2680) 996 (37.2) 648 (65.1) 548 (55.0) 396 (39.8) 357 (65.1)
60–69 (n=2480) 1422 (57.3) 1092 (76.8) 1018 (71.6) 700 (49.2) 657 (64.5)
≥70 (n=2173) 1415 (65.1) 1191 (84.2) 1135 (80.2) 762 (53.9) 732 (64.5)
Men (n=5020) 2009 (41.8) 1320 (62.9) 1178 (56.1) 827 (39.4) 774 (65.7)
Age-standardized (36.2) (54.7) (47.1) (33.0) (64.6)
Women (n=7209) 2472 (34.3) 1871 (75.7) 1712 (69.3) 1169 (47.3) 1088 (63.6)
Age-standardized (29.7) (73.7) (66.9) (45.9) (63.8)
Diabetes <0.001 0.011 0.003 0.808 0.702
Total (n=12229) 1406 (11.5) 1105 (78.6) 986 (70.1) 372 (26.5) 233 (23.6)
Age-standardized (9.8) (75.4) (66.5) (26.1) (22.1)
30–39 (n=2539) 46 (1.8) 21 (45.7) 17 (37.0) 13 (28.3) 1 (5.9)
40–49 (n=2357) 122 (5.2) 63 (51.6) 48 (39.3) 26 (21.3) 8 (16.7)
50–59 (n=2680) 310 (11.6) 226 (72.9) 198 (63.9) 72 (23.2) 39 (19.7)
60–69 (n=2480) 463 (18.7) 390 (84.2) 351 (75.8) 114 (24.6) 77 (21.9)
≥70 (n=2173) 465 (21.4) 405 (87.1) 372 (80.0) 147 (31.6) 108 (29.0)
Men (n=5020) 711 (14.2) 547 (76.9) 482 (67.8) 186 (26.2) 110 (22.8)
Age-standardized (11.3) (72.3) (62.6) (25.8) (21.5)
Women (n=7209) 695 (9.6) 558 (80.3) 504 (72.5) 186 (26.8) 123 (24.4)
Age-standardized (8.3) (78.2) (70.1) (26.4) (22.7)
*p values for difference in rates between men and women were calculated by Fisher’s exact two-tailed test.
high risk category (2.26), high risk category (2.13), and low risk category (0.37). The differences among the group averages were all significant, with the high risk category showing an especial- ly large standard deviation.
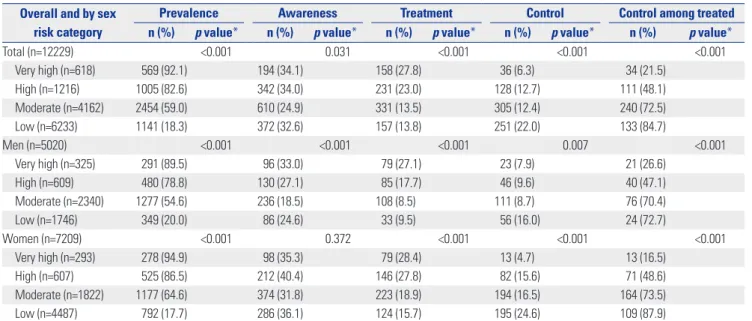
Table 4 lists the prevalence, awareness, treatment rate, and control rate of each risk category. Both sexes showed higher prevalence in the higher risk categories, and in all risk catego- ries, excluding the low risk category, prevalence was higher in females than in males. Prevalence in the very high risk category, high risk category, moderate risk category, and low risk category for males was 89.5, 78.8, 54.6, and 20.0%, respectively, while for females, it was 94.9, 86.5, 64.6, and 17.7%, respectively. Aware- ness among the patients was found to be higher in those in higher risk categories for males, but for females, there were no
significant trends among risk categories. Unawareness of dyslip- idemia in the very high risk category and high risk category reached two-thirds in the study population.
Treatment rates were significantly higher in higher risk cat- egories for both sexes, and across all risk categories, males sh- owed lower treatment rates than females. The treatment rates of the very high risk category, high risk category, moderate risk category, and lower risk category for males were 27.1, 17.7, 8.5, and 9.5%, while for females, they were 28.4, 27.8, 18.9, and 15.7%, respectively. Control rates were significantly lower in the higher risk categories, while in all risk categories, exclud- ing the very high risk category, males showed a lower control rate than females. Control rates in the very high risk category, high risk category, moderate risk category, and low risk cate- Fig. 1. Prevalence and management of dyslipidemia by age groups. p values for difference in rates between men and women were calculated by Fisher’s exact two-tailed test.
Age (yrs) 30–39 40–49 50–59 60–69 ≥70 p value <0.001 <0.001 <0.001 <0.001 <0.001
100
80
60
40
20
0
Prevalence (%) 32.2
45.0
56.0 55.1
47.7 Men
Women
8.3
17.7
45.3
63.3 63.5
Age (yrs) 30–39 40–49 50–59 60–69 ≥70 p value 0.730 0.449 0.005 <0.001 0.126
100
80
60
40
20
0
Treatment (%)
2.6 6.9 13.9 18.8 15.8
Men Women
1.5 8.6
19.8
28.8
19.3
Age (yrs) 30–39 40–49 50–59 60–69 ≥70 p value 0.624 0.052 <0.001 <0.001 0.016
100
80
60
40
20
0
Awareness (%)
12.0 16.5 23.3 31.6
24.3 Men
Women
9.9
22.9
38.0 43.4
30.7
Age (yrs) 30–39 40–49 50–59 60–69 ≥70 p value 1.000 0.010 <0.013 <0.001 0.170
100
80
60
40
20
0
Control (%)
4.5 6.4 9.3 14.1 11.8
Men Women
4.6 12.2 19.6 21.5
14.7
Table 3. Distribution of Risk Factor Number by Risk Categories
Number of risk factors Risk category
Total (n=12229) Very high (n=618) High (n=1216) Moderate (n=4162) Low (n=6233)
≤0, n (%) 21 (3.4) 74 (6.1) 0 (0.0) 3257 (52.3) 3352 (27.4)
1, n (%) 105 (17.0) 240 (19.7) 0 (0.0) 2976 (47.7) 3321 (27.2)
2, n (%) 240 (38.8) 454 (37.3) 2602 (62.5) 0 (0.0) 3296 (27.0)
3, n (%) 200 (32.4) 345 (28.4) 1251 (30.1) 0 (0.0) 1796 (14.7)
4, n (%) 48 (7.8) 97 (8.0) 293 (7.0) 0 (0.0) 438 (3.6)
5, n (%) 4 (0.6) 6 (0.5) 16 (0.4) 0 (0.0) 26 (0.2)
Mean±SD (T)* 2.26±0.97 (C) 2.13±1.06 (B) 2.45±0.64 (D) 0.37±0.67 (A) 1.35±1.24
*The same letters indicate non-significant difference between groups (α=0.05) on Tamhane’s multiple comparison test.
gory were 7.9, 9.6, 8.7, and 16.0% in males and 4.7, 15.6, 16.5, and 24.6% in females, respectively.
Prevalence and management of hypertension
The age-standardized prevalence of hypertension in the adult
population of individuals 30 years and over was 32.8%, and the awareness, treatment, and control rates of patients was 64.5, 57.3, and 39.7%, respectively. The control rate among the treat- ed was 64.2% (Table 2). The prevalence of hypertension was significantly higher in males than in females (36.2% vs. 29.7%),
Table 4. Prevalence, Awareness, and Management of Dyslipidemia by Sex and Risk Categories Overall and by sex
risk category
Prevalence Awareness Treatment Control Control among treated
n (%) p value* n (%) p value* n (%) p value* n (%) p value* n (%) p value*
Total (n=12229) <0.001 0.031 <0.001 <0.001 <0.001
Very high (n=618) 569 (92.1) 194 (34.1) 158 (27.8) 36 (6.3) 34 (21.5)
High (n=1216) 1005 (82.6) 342 (34.0) 231 (23.0) 128 (12.7) 111 (48.1)
Moderate (n=4162) 2454 (59.0) 610 (24.9) 331 (13.5) 305 (12.4) 240 (72.5)
Low (n=6233) 1141 (18.3) 372 (32.6) 157 (13.8) 251 (22.0) 133 (84.7)
Men (n=5020) <0.001 <0.001 <0.001 0.007 <0.001
Very high (n=325) 291 (89.5) 96 (33.0) 79 (27.1) 23 (7.9) 21 (26.6)
High (n=609) 480 (78.8) 130 (27.1) 85 (17.7) 46 (9.6) 40 (47.1)
Moderate (n=2340) 1277 (54.6) 236 (18.5) 108 (8.5) 111 (8.7) 76 (70.4)
Low (n=1746) 349 (20.0) 86 (24.6) 33 (9.5) 56 (16.0) 24 (72.7)
Women (n=7209) <0.001 0.372 <0.001 <0.001 <0.001
Very high (n=293) 278 (94.9) 98 (35.3) 79 (28.4) 13 (4.7) 13 (16.5)
High (n=607) 525 (86.5) 212 (40.4) 146 (27.8) 82 (15.6) 71 (48.6)
Moderate (n=1822) 1177 (64.6) 374 (31.8) 223 (18.9) 194 (16.5) 164 (73.5)
Low (n=4487) 792 (17.7) 286 (36.1) 124 (15.7) 195 (24.6) 109 (87.9)
*p values were calculated by chi-square test for trend among risk categories.
Age (yrs) 30–39 40–49 50–59 60–69 ≥70 p value <0.001 <0.001 <0.001 1.000 <0.001
100
80
60
40
20
0
Prevalence (%)
18.6
31.4
42.0
57.4 58.1
Men Women
3.5
14.4
34.0
57.3
70.4
Age (yrs) 30–39 40–49 50–59 60–69 ≥70 p value 0.014 0.015 0.055 0.066 0.004
100
80
60
40
20
0
Treatment (%)
8.4
27.9
51.6
69.1 76.3
Men Women
21.8
38.5
57.8
73.6 82.6
Age (yrs) 30–39 40–49 50–59 60–69 ≥70 p value 0.001 0.017 0.009 0.031 0.030
100
80
60
40
20
0
Awareness (%)
17.4
36.7
60.6
70.4
81.5 Men
Women
40.0 47.5
68.7
79.0 85.9
Age (yrs) 30–39 40–49 50–59 60–69 ≥70 p value 0.009 0.020 0.023 0.364 0.702
100
80
60
40
20
0
Control (%)
9.0 18.0
35.8
47.8 54.5
Men Women
23.6 27.0
42.9 50.3 53.4
Fig. 2. Prevalence and management of hypertension by age groups. p values for difference in rates between men and women were calculated by Fisher’s exact two-tailed test.
although awareness, treatment, and control rates were signifi- cantly lower (54.7% vs. 73.7%, 47.1% vs. 66.9%, and 33.0% vs.
45.9%, respectively). The control rate among the treated did not show a significant difference between sexes (64.6% vs. 63.8%).
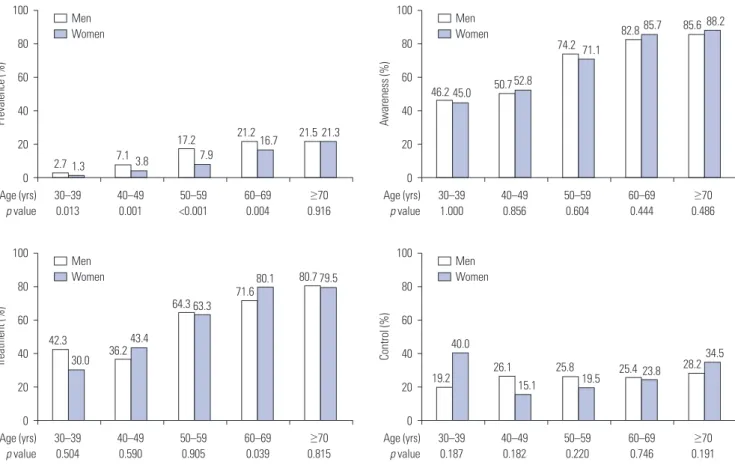
Fig. 2 illustrates the sex differences in the prevalence, aware- ness, treatment, and control rates across all age groups. For the groups of those in their 30’s and 40’s, the prevalence of hyper- tension in the male population was significantly higher than that in females, although it evened out during their 50’s. Begin- ning in the 60’s, the prevalence of hypertension was higher in the female population. Awareness among patients was higher in females than in males across all age groups. The treatment rate of hypertension was higher in females across all age groups, and the differences were all significant, except in the 50’s. The control rate was higher in females in their 30–50’s, and begin- ning in their 60’s, there was no significant difference between the sexes.
Prevalence and management of diabetes
The age-standardized prevalence of diabetes in the adult pop- ulation of individuals 30 years and over was 9.8%, and the aw- areness, treatment rate, and control rates thereof were, respec- tively, 75.4, 66.5, and 26.1%. The control rate among the treated was 22.1% (Table 2). The control rate among the treated was lower than that among diabetes patients. This phenomenon could be explained by the inclusion of mild diabetic pati-ents
who were newly diagnosed by fasting blood glucose in this sur- vey. The prevalence of diabetes was significantly higher in males than in females (11.3% vs. 9.6%), while awareness and treatment rates were significantly lower (72.3% vs. 78.2% and 62.6% vs. 70.1%, respectively). There were significant sex differ- ences in control rates among both the diagnosed (with/without treatment) and treatment alone groups.
Fig. 3 illustrates sex differences in prevalence, awareness, tr- eatment, and control rates among age groups. Male prevalence was significantly higher throughout the 30’s to 60’s; there was no significant difference between the sexes in the groups in their 70’s and over. Male prevalence rapidly rose beginning with in- dividuals in their 50’s. Female prevalence rose rapidly begin- ning with individuals in their 60’s, catching up with the males and showing no significant difference by their 70’s. Higher age groups showed higher treatment rates among the patients, and there were no significant differences in any of the age groups, except the 60’s. There was no specific trend in the control rate among patients across all age groups in both sexes, and no significant sex differences either.
Risk factors, metabolic syndrome, and hyper-LDL- cholesterolemia
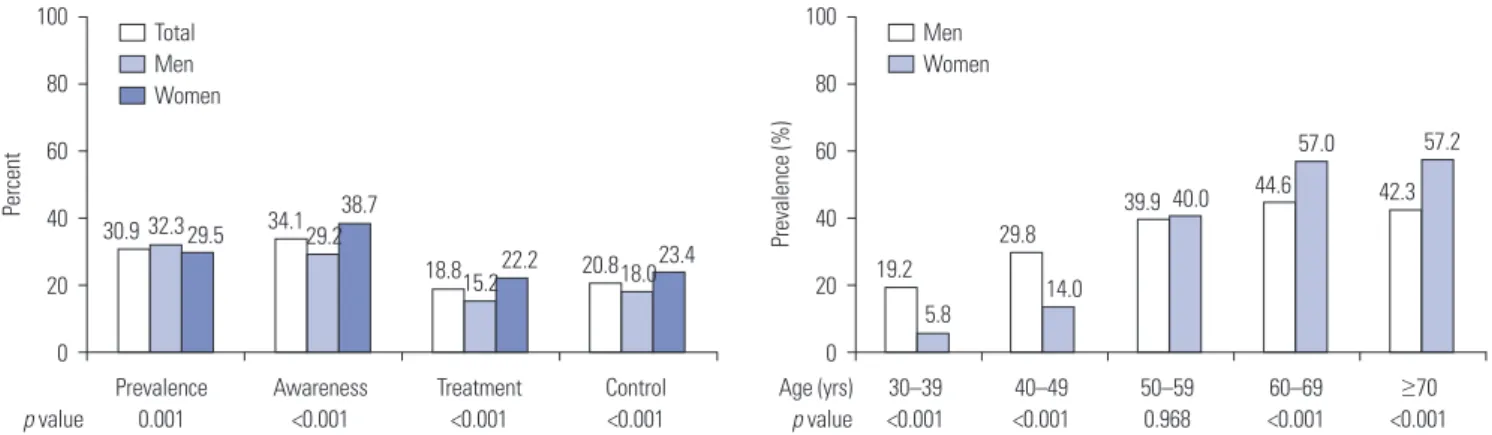
Fig. 4 illustrates the prevalence, awareness, treatment, and con- trol rates of hyper-LDL-cholesterolemia. The age-standardized prevalence was 30.9%, and the awareness, treatment, and con-
Fig. 3. Prevalence and management of diabetes by age groups. p values for difference in rates between men and women were calculated by Fisher’s exact two-tailed test.
Age (yrs) 30–39 40–49 50–59 60–69 ≥70 p value 0.013 0.001 <0.001 0.004 0.916
Age (yrs) 30–39 40–49 50–59 60–69 ≥70 p value 0.504 0.590 0.905 0.039 0.815
Age (yrs) 30–39 40–49 50–59 60–69 ≥70 p value 1.000 0.856 0.604 0.444 0.486
Age (yrs) 30–39 40–49 50–59 60–69 ≥70 p value 0.187 0.182 0.220 0.746 0.191 100
80
60
40
20
0
100
80
60
40
20
0
100
80
60
40
20
0
100
80
60
40
20
0
Prevalence (%)Treatment (%) Awareness (%)Control (%)
2.7
42.3
46.2
19.2 7.1
36.2
50.7
26.1 17.2
64.3
74.2
25.8 21.2
71.6
82.8
25.4 21.5
80.7
85.6
28.2 Men
Women
Men Women
Men Women
Men Women 1.3
30.0
45.0
40.0 3.8
43.4
52.8
15.1 7.9
63.3
71.1
19.5 16.7
80.1
85.7
23.8 21.3
79.5
88.2
34.5
trol rates were 34.1, 18.8, and 20.8%, respectively, in the adult population 30 years and over. Males showed significantly high- er prevalence than females (32.3% vs. 29.5%), although aware- ness, treatment, and control rates were significantly lower (29.2% vs. 38.7%, 15.2% vs. 22.2%, and 18.0% vs. 23.4%, respec- tively). In the 30’s and 40’s age groups, prevalence was signifi- cantly higher in males, but in the 50’s, no significant sex differ- ences were found, and female prevalence rose significantly higher than in males beginning with subjects in their 60’s.
Fig. 5 compares the prevalence of hyper-LDL-cholesterol- emia according to the presence of risk factors of CVD. Smoking showed no significant difference in prevalence, although the presence of other risk factors showed a higher prevalence. The prevalence of hypertension was 52.8%, and the prevalence of diabetes patients was 76.0%. Those without the metabolic syn- drome showed a prevalence of 26.3%, while those with meta- bolic syndrome showed a prevalence of 53.1%.
Table 5 compares the logistic regression analysis results by sex in order to understand the relative influence of risk factors according to the presence of hyper-LDL-cholesterolemia. Mod- el 1 used the risk factors of dyslipidemia as independent vari- ables. The odds ratio (OR) of high HDL cholesterol (≥60 mg/
dL), which is a protective factor, was significantly lower than 1 in both sexes, while the ORs of all other risk factors were sig- nificantly greater than 1. When compared with males, the OR
of age in males was 2.54, while that of females was 4.94, which was approximately two-fold more. Model 2 used the classifi- cation of risk categories as independent variables, and showed the relative risk of hyper-LDL-cholesterolemia among other risk categories when the OR of the low risk category was des- ignated as 1. The ORs of the moderate risk category, high risk category, and very high risk category in males were 4.53, 15.84, and 49.30, respectively. Females showed higher scores at 7.10, 24.11, and 78.59 across all risk categories. Model 3 used the five risk factors that designate metabolic syndrome as independent variables, and illustrated that females show larger ORs for all risk factors, excluding low-HDL-cholesterolemia (M: <40 mg/
dL, F: 50 mg/dL), compared to males. Model 4 used the num- ber of risk factors of metabolic syndrome that are present as an independent variable, and illustrated changes in relative risk with an increase in the number of risk factors. In all occasions where there was more than one risk factor, females showed a larger OR than males, and in the metabolic syndrome group, where there were three or more risk factors, the OR of females was about three times larger than that for males.
DISCUSSION
This study utilized the raw data of 12229 adults aged 30 years
Fig. 4. Age-standardized prevalence and management of hyper-LDL-cholesterolemia. p values for difference in rates between men and women were calculated by Fisher’s exact two-tailed test. LDL, low-density lipoprotein.
Prevalence Awareness Treatment Control p value 0.001 <0.001 <0.001 <0.001
Age (yrs) 30–39 40–49 50–59 60–69 ≥70 p value <0.001 <0.001 0.968 <0.001 <0.001 100
80
60
40
20
0
100
80
60
40
20
0
Percent Prevalence (%)30.9 34.1
18.8 20.8 19.2
29.8
39.9 44.6 42.3
Total Men Women
Men Women
32.3 29.2
15.2 18.0
29.5
38.7
22.2 23.4
5.8 14.0
40.0
57.0 57.2
Fig. 5. Risk factor status and prevalence of hyper-LDL-cholesterolemia. 1) Obesity: body mass index ≥25 kg/m2. AO: waist circumference ≥90 cm in men, or 85 cm in women. Hyper-TG: TG ≥150 mg/dL. Hypo-HDL-C: HDL-C <40 mg/dL in men, or <50 mg/dL in women. 2) p values for difference in prev- alence rates were calculated by Fisher’s exact two-tailed test. AO, abdominal obesity; TG, triglycerides; HDL-C, high-density lipoprotein cholesterol;
MS, metabolic syndrome; LDL, low-density lipoprotein.
Smoking Obesity AO Hypertension Diabetes Hyper-TG Hypo-HDL-C MS
p value 0.161 <0.001 <0.001 <0.001 <0.001 <0.001 <0.001 <0.001 100
50
0
Prevalence (%)
34.2 29.2 28.7 23.5 29.1 30.6 30.3 26.3
No or absence Yes or presence
35.8 45.1 49.6 52.8
76.0
43.7 39.9
53.1
old and older from the KNHANES (2010–2012), which is repre- sentative of the general population of Korea, to investigate the prevalence and management status of dyslipidemia, hyperten- sion, and diabetes.
The prevalence of dyslipidemia was not analyzed by diag- nostic criteria, but by the National Health Insurance benefit cri- teria, which designates the actual form of treatment. The main results can be summarized as follows: 1) The age-standardized prevalence was highest in dyslipidemia, at 39.6%, followed by hypertension at 32.8%, and diabetes at 9.8%. 2) Awareness among patients was highest for diabetes, at 75.4%, followed by hypertension at 64.5% and dyslipidemia at 27.9%. 3) The treat- ment rate among patients was 66.5% for diabetes, 57.3% for hypertension, and only 15.7% for dyslipidemia. 4) The control rate among the treated was highest for hypertension, at 64.2%, followed by dyslipidemia at 59.3% and diabetes at 22.1%. 5) The male population showed a higher prevalence of diabetes, hyper- tension, and dyslipidemia, but lower awareness and treatment rates. 6) Finally, females showed a lower prevalence of high- LDL-cholesterolemia than males, but a higher relative risk level based on risk factors.
Studies on the prevalence and management of dyslipidemia have been based on different diagnostic criteria. The National Health Statistics, published by the Republic of Korea’s Centers for Disease Control and Prevention, is an analysis of the data of the KNHANES, where they classify dyslipidemia into hyper- cholesterolemia and hypertriglyceridemia. Ahn, et al.,16 which used KNHSP data from 2003 to 2010 in order to analyze treat- ment rates, focused on hypercholesterolemia. It can be as- sumed that this was because the customary standard at that time was to use total cholesterol and triglycerides and the con- sequent ease of obtaining relevant data for these measures.
The dyslipidemia treatment guidelines,15 revised by the Korean Society of Lipidology and Atherosclerosis in 2015, recommends that the diagnostic criteria for dyslipidemia are total choles- terol ≥240 mg/dL, LDL cholesterol ≥160 mg/dL, HDL choles- terol <40 mg/dL, or triglycerides ≥200 mg/dL. However, in a study of prevalence rates published in 2015 by the Korean So- ciety of Lipidology and Atherosclerosis,5 total cholesterol was not used as a diagnostic criterion for dyslipidemia. Debate is ongoing about whether total cholesterol can be an appropriate diagnostic criterion for dyslipidemia, because high HDL cho- Table 5. Multiple Logistic Regression Results: ORs for Hyper-LDL-Cholesterolemia by Sex
Model Men Women
Independent variable OR (95% CI) p value OR (95% CI) p value
Model 1: major risk factors of dyslipidemia
Current smoking 1.22 (1.07, 1.39) 0.002 1.82 (1.36, 2.44) <0.001
Hypertension (SBP/DBP ≥140/90 mm Hg) 1.93 (1.71, 2.19) <0.001 2.72 (2.42, 3.07) <0.001
Low HDL-C (<40 mg/dL) 1.30 (1.14, 1.48) <0.001 1.18 (1.02, 1.36) 0.031
High HDL-C (≥60 mg/dL) 0.51 (0.41, 0.63) <0.001 0.67 (0.58, 0.78) <0.001
Age (≥45/55 yrs in men/women) 2.54 (2.18, 2.95) <0.001 4.94 (4.37, 5.59) <0.001
Family history of cardio-cerebrovascular disease 1.82 (1.56, 2.12) <0.001 1.83 (1.59, 2.12) <0.001 Model 2: risk categories of dyslipidemia
Low risk (zero or one risk factor) 1.00 1.00
Moderate risk (two or more risk factors) 4.53 (3.83, 5.36) <0.001 7.10 (6.27, 8.03) <0.001
High risk (diabetes) 15.84 (12.66, 19.81) <0.001 24.11 (19.36, 29.98) <0.001
Very high risk* 49.30 (34.66, 70.13) <0.001 78.59 (49.54, 124.67) <0.001
Model 3: metabolic syndrome factors
Abdominal obesity† 1.37 (1.20, 1.57) <0.001 1.79 (1.58, 2.11) <0.001
Diabetes (fasting glucose ≥100 mg/dL) 1.59 (1.41, 1.81) <0.001 3.36 (3.00, 3.75) <0.001
Hypertension (SBP/DBP ≥130/85 mm Hg) 2.19 (1.93, 2.48) <0.001 2.48 (2.20, 2.80) <0.001
Triglycerides (≥150 mg/dL) 0.95 (0.83, 1.08) 0.408 1.47 (1.29, 1.67) <0.001
HDL-C (<40/50 mg/dL in men/women) 1.39 (1.22, 1.58) <0.001 1.08 (0.96, 1.21) 0.205
Model 4: number of metabolic syndrome factors
0 risk factor of metabolic syndrome 1.00 <0.001 1.00 <0.001
1 risk factor of metabolic syndrome 2.18 (1.76, 2.71) <0.001 2.77 (2.29, 3.35) <0.001
2 risk factor of metabolic syndrome 3.43 (2.78, 4.23) <0.001 6.30 (5.21, 7.62) <0.001
3 risk factor of metabolic syndrome 3.91 (3.15, 4.87) <0.001 10.04 (8.24, 12.24) <0.001
4 risk factor of metabolic syndrome 5.70 (4.46, 7.28) <0.001 15.43 (12.36, 19.27) <0.001
5 risk factor of metabolic syndrome 5.45 (3.77, 7.87) <0.001 19.55 (14.37, 26.59) <0.001
OR, odd sratio; CI, confidence interval; SBP, systolic blood pressure; DBP, diastolic blood pressure; HDL-C, high-density lipoprotein cholesterol; LDL, low-density lipoprotein.
*Very high risk group: stroke, myocardial infarction, and angina pectoris, †Abdominal obesity, waist circumference of ≥90 cm in men or ≥85 cm in women.
lesterol, which is a protective factor, can result in a finding of hypercholesterolemia as well.17 Other studies8 have applied tri- glycerides ≥150 mg/dL or HDL cholesterol <40 mg/dL (M)/<50 mg/dL (F) as the diagnostic criteria for dyslipidemia. This is be- cause the NCEP-ATP III guideline published in 2001 designates LDL cholesterol as the primary aim of dyslipidemia treatment, and suggests controlling the level of triglycerides and HDL cho- lesterol based on the criteria for the metabolic syndrome.
Unlike its diagnostic criteria, the treatment guidelines for dyslipidemi are commend that a graded treatment aim for LDL cholesterol be applied by different risk categories, depending on the evaluation of CVD risk factors and their levels.15 This study analyzed the prevalence and management status of dys- lipidemia (hyper-LDL-cholesterolemia or hypertriglyceride- mia) found in adults aged 30 years old and older by applying the National Health Insurance benefit criteria as the treatment criteria. The age-standardized prevalence was 39.6%, high- lighting a significant difference from the studies that apply di- agnostic criteria for their analysis. According to a report in 2015 by the Korean Society of Lipidology and Atherosclerosis, the prevalence (hyper-LDL-cholesterolemia, hypertriglyceridemia, or hypo-HDL-cholesterolemia) found in adults aged 30 years old and older was 47.8%.5 The 2012 National Health Statistics,7 which analyzed only hypercholesterolemia (≥240 mg/dL or use of cholesterol lowering agents), suggested that the preva- lence in adults 30 and over was 14.5% in 2012. In the present study, the awareness, treatment, and control rates among pa- tients were 27.9, 15.7, and 13.2, respectively. Considering the awareness, treatment, and control rates of hypercholesterol- emia patients among adults over 30, which were 44.8, 34.1, and 27.0% in 2012, the management indices of dyslipidemia de- rived by this study were significantly lower. The control rate among the treated was 59.5%, which is significantly different than the 77.6% control rate among those who were treated for hypercholesterolemia, as suggested by the 2012 National Health Statistics. Lee, et al.,18 which also employed the LDL cholesterol treatment guidelines, analyzed the data of adults 20 years and over from the KNHANES of 2008–2010, and showed a 23.2%
prevalence, 13.2% awareness, and 10.2% treatment rate for hy- per-LDL-cholesterolemia. However, our study analyzed hyper- LDL-cholesterolemia found in adults 30 years and over using the data from the KNHANES of 2010–2012. The prevalence was 30.9%, and the awareness, treatment, and control rates among the patients were 34.1, 18.8, and 20.8%, respectively. These dif- ferences can be assumed to be attributed to the different sub- jects and time of the research. In addition, this study analyzed dyslipidemia (hyper-LDL-cholesterolemia and hypertriglycer- idemia) and compared the prevalence, awareness, treatment rate, and control rate with those of hypertension and diabetes, which are some of the main factors that contribute to CVD. The prevalence of dyslipidemia was 39.6%, ranking highest among the risk factors of CVD, although its awareness and treatment rate were the lowest. Its control rate among the treated was
59.5%, following hypertension. Prevalence was higher in mid- dle-aged (in their 30’s, 40’s, and 50’s) men than in women. How- ever, awareness, treatment, and control rates were lower in men than in women. These sex-difference patterns in prevalence and management of dyslipidemia were also reported in other Asian countries.19-21 Mentend to have unhealthy lifestyles, such as alcohol intake, cigarettes smoking, and an unhealthy diet, especially in those under the age of 50 years.20
The age-standardized prevalence of hypertension found in adults 30 years and over was 32.8%, and the prevalence of males was significantly higher than that of females (36.2% vs. 29.7%).
In this study, the awareness, treatment rate, and control rate among patients with hypertension was found to be 64.5, 57.4, and 39.7%, respectively. Males showed a significantly lower awareness, treatment, and control rates than females. The con- trol rate among the treated found in this study was 64.2%, and there was no significant difference between the sexes (M: 64.6%
vs. F: 63.8%).
The age-standardized prevalence of diabetes found in adults aged 30 years old and older in this study was 9.8%, and male prevalence was significantly higher than that of females (11.3%
vs. 8.3%). In the present study, the awareness, treatment, and control rate of diabetes patients were 75.4, 66.5, and 26.1%, re- spectively. Males showed a significantly lower awareness and treatment rate than females, although the control rate showed no significant difference. The control rate among those who were treated for diabetes was found in our study to be 22.1%, with no significant sex difference (21.5% vs. 22.7%). This implies that regardless of sex, four out of five treated patients are not able to control their blood glucose levels.
Dyslipidemia, hypertension, and diabetes are risk factors of CVD, as well as preceding diseases.2-4 In this study, the preva- lence of dyslipidemia was higher than that of both hypertension and diabetes. On the other hand, its awareness, treatment, and control rates were found to be lower. Subjects in higher risk cat- egories in particular showed a higher prevalence regardless of sex, although the control rate in both patients and treated was found to be the lowest. The control rates found in the very high risk category, high risk category, moderate risk category, and low risk category were M: 7.9, 9.6, 8.7, and 16.0% and F: 4.7, 15.6, 16.5, and 24.6%, respectively. The fact that higher risk categories show lower control rates implies that the management of dys- lipidemia with a focus on the risk level is not being properly ha- ndled. The prevalence of dyslipidemia found in diabetes pa- tients was 82.6%, and the awareness, treatment, and control rates among the diagnosed patients were 34.0, 23.0, and 12.7%, respectively. This implies that eight out of 10 diabetes patients have dyslipidemia, and only one out of 10 patients with diag- nosis of both diseases have lipid control as their treatment aim.
The limitations of this study are as follows. First, LDL cho- lesterol was measured by the Friedewald formula, instead of actual measurements for the subjects with triglycerides below 400 mg/dL. This method is used in the current system of the
KNHSP, but the Friedewald equation is known to produce some error, compared to actual measurements. Second, the current treatment guidelines were not fully taken into account in eval- uating the risk factors and levels of CVD. In particular, the ages of premature CVD prevalence were not taken into consider- ation as a risk factor in evaluating the clinical history of the fam- ily of the subjects. The high risk category only accounted for diabetes patients, and the very high risk category, only those who had a clinical history of CVD. Third, the awareness and tre- atment rate found in this study relied on self-reported question- naire data collected in the KNHANES, and may thus be errone- ous. Fourth, the incidence and risk of CVD is much lower than that observed in Western countries. However, there is little ev- idence available for CV risk estimation and treatment target de- termination for dyslipidemia in Korea. This study applied the 2015 Korean Society of Lipidology and Atherosclerosis guide- line compatible with the updated NCEP-ATP III guidelines for CV risk estimation and risk-based LDL cholesterol targets. Th- erefore, our study results should be cautiously interpreted with the acknowledgement of overestimation of CV risk and preva- lence in dyslipidemia.
This study is significant in that it analyzed the prevalence and management status of dyslipidemia in Korean adults aged 30 years old and older on the basis of a treatment guidelines grad- ed by risk level, instead of more general diagnostic criteria. The prevalence of dyslipidemia was higher relative to that of hyper- tension and diabetes. However, its awareness, treatment, and control rates were the lowest. Seven out of 10 dyslipidemia pa- tients were not aware of their disease, and eight or more patients were not receiving any treatment. The control rate among the treated was found to be the lowest for diabetes, at 22.1%, fol- lowed by dyslipidemia at 59.3% and hypertension at 64.2%.
These results suggest that a nationwide effort aimed at raising awareness and the treatment rate of dyslipidemia, as well as raising the control rate of those who are being treated for dia- betes, is needed.
Thus, this paper proposes the following steps in order to improve upon the current protocols of the KNHSP. First, the diagnosis-based examination system of dyslipidemia must be shifted to one that is centered around the treatment and man- agement of patients. In the current system of the KNHSP, ad- ditional examinations for those who are suspected to have dys- lipidemia in the initial examination are not being carried out, and consequently, the patients are lacking post-management.
Thus, subjects of additional examination should include not only suspected hypertension and diabetes patients, but also those suspected to have dyslipidemia in order to designate a risk category, provide relevant education, and decide on the administration of medication. If this were to cause a financial burden on the National Health Insurance, it can be suggested that at least the patients belonging to the very high or high risk categories, such as diabetes patients, are examined for dyslip- idemia and treated with post-management thereon. Second,
the diagnostic criteria for dyslipidemia in the KNHSP must be reconciled with treatment guidelines. This requires a meticulous evaluation of the number of risk factors and their levels, which should be recorded with the examination results. In addition, graded diagnostic criteria should be applied by risk category to suggest differential treatment goals by LDL cholesterol level.
Third, an improvement of the questionnaires in the KNHSP is required. In order to implement a graded application of the di- agnostic criteria for hyper-LDL-cholesterolemia by risk catego- ry, the questions on the risk factors for CVD must be more spe- cific and systematic to achieve measurability. For example, in the domain of “family history of premature prevalence of coro- nary artery disease,” the risk factor is specifically the “prevalence of coronary artery diseases in direct family members before the age of M: 55 and F: 65”. However, the item in the questionnaire of the current KNHSP survey, which only mentions “family his- tory of coronary artery disease,” is not specific enough to obtain this information.
In conclusion, we analyzed the prevalence and management status of CVD risk factors for dyslipidemia on the basis of treat- ment guidelines graded by CV risk level, because the low rate of awareness and treatment might be caused by disagreement be- tween diagnostic criteria and treatment guidelines on dyslipid- emia. The prevalence of dyslipidemia was highest relative to that of hypertension and diabetes. Its awareness, treatment, and control rates were found to be the lowest, however. Nonetheless, the control rate among treated individuals was higher than that of diabetes. We also observed that the higher CVD-risk catego- ries show lower control rates of dyslipidemia. In order to im- prove the awareness and control rates of dyslipidemia, it should be defined according to the treatment criteria based on CV risk rather than the diagnostic criteria in Korea. However, there is lit- tle evidence available on CV risk estimation and treatment target determination for dyslipidemia in Korea. To assess the exact CV risk in Korean population, large-scale cohort studies should be implemented in the future.
REFERENCES
1. Statistics Korea. 2015 Annual report on the cause of death statis- tics [accessed on 2016 September 27]. Available at: http://kostat.
go.kr/portal/korea/kor_nw/2/6/2/index.board?bmode=read&bS eq=&aSeq=356345&pageNo=1&rowNum=10&navCount=10&cur rPg=&sTarget=title&sTxt.
2. Cooper R, Cutler J, Desvigne-Nickens P, Fortmann SP, Friedman L, Havlik R, et al. Trends and disparities in coronary heart disease, stroke, and other cardiovascular diseases in the United States:
findings of the national conference on cardiovascular disease prevention. Circulation 2000;102:3137-47.
3. Go AS, Mozaffarian D, Roger VL, Benjamin EJ, Berry JD, Blaha MJ, et al. Heart disease and stroke statistics--2014 update: a report from the American Heart Association. Circulation 2014;129:e28-292.
4. Okamura T. Dyslipidemia and cardiovascular disease: a series of epidemiologic studies in Japanese populations. J Epidemiol 2010;
20:259-65.
5. Korean Society of Lipidology and Atherosclerosis. Dyslipidemia
Fact Sheet in Korea 2015 [accessed on 2016 June 18]. Available at:
http://www.lipid.or.kr/bbs/?code=fact_sheet.
6. Kim HJ, Kim Y, Cho Y, Jun B, Oh KW. Trends in the prevalence of major cardiovascular disease risk factors among Korean adults:
results from the Korea National Health and Nutrition Examina- tion Survey, 1998-2012. Int J Cardiol 2014;174:64-72.
7. Korea Centers for Disease Control and Prevention. Korea Health Statistics 2012: National Korea National Health and Nutrition Sur- vey (KNHANES V) 2013 [accessed on 2015 January 28]. Available at: http://knhanes.cdc.go.kr/knhanes/index.do.
8. Roh E, Ko SH, Kwon HS, Kim NH, Kim JH, Kim CS, et al. Preva- lence and Management of Dyslipidemia in Korea: Korea National Health and Nutrition Examination Survey during 1998 to 2010.
Diabetes Metab J 2013;37:433-49.
9. Ministry of Health and Welfare. 2014 revised criteria for medical care benefits: drug therapy for hyperlipidemia (Notice No. 2013- 210) [accessed on 2016 June 30]. Available at: http://www.mohw.
go.kr/front_new/jb/sjb0406vw.jsp?PAR_MENU_ID=03&MENU_
ID=030406&CONT_SEQ=321852&page=1.
10. Expert Panel on Detection, Evaluation, and Treatment of High Blood Cholesterol in Adults. Executive Summary of The Third Re- port of The National Cholesterol Education Program (NCEP) Ex- pert Panel on Detection, Evaluation, And Treatment of High Blood Cholesterol In Adults (Adult Treatment Panel III). JAMA 2001;285:
2486-97.
11. Grundy SM, Cleeman JI, Merz CN, Brewer HB Jr, Clark LT, Hun- ninghake DB, et al. Implications of recent clinical trials for the Na- tional Cholesterol Education Program Adult Treatment Panel III guidelines. Circulation 2004;110:227-39.
12. National Health Insurance Service. 2009 Guideline for the Korea National Screening Program [accessed on 2016 June 30]. Available at: http://www.mohw.go.kr/front_new/jb/sjb0403vw.jsp?PAR_
MENU_ID=03&MENU_ID=030403&CONT_SEQ=222527&page=1.
13. World Health Organization, Regional Office for the Western Pa- cific. The Asia-Pacific perspective: redefining obesity and its treat- ment. Sydney: Health Communications Australia; 2000.
14. Alberti KG, Zimmet PZ. Definition, diagnosis and classification of diabetes mellitus and its complications. Part 1: diagnosis and clas- sification of diabetes mellitus provisional report of a WHO consul- tation. Diabet Med 1998;15:539-53.
15. Committee for Guidelines for Management of Dyslipidemia. 2015 Korean Guidelines for Management of Dyslipidemia. J Lipid Ath- eroscler 2015;4:61-92.
16. Ahn E, Shin DW, Yang HK, Yun JM, Chun SH, Suh B, et al. Treat- ment gap in the national health-screening program in Korea:
claim-based follow-up of statin use for sustained Hypercholester- olemia. J Korean Med Sci 2015;30:1266-72.
17. Cho YG, Song HJ, Park BJ. The comparison of guidelines for man- agement of dyslipidemia and the appropriateness of them in Ko- rea. Korean J Fam Med 2010;31:171-81.
18. Lee YH, Lee SG, Lee MH, Kim JH, Lee BW, Kang ES, et al. Serum cholesterol concentration and prevalence, awareness, treatment, and control of high low-density lipoprotein cholesterol in the Ko- rea national health and nutrition examination surveys 2008-2010:
beyond the tip of the iceberg. J Am Heart Assoc 2014;3:e000650.
19. Pan L, Yang Z, Wu Y, Yin RX, Liao Y, Wang J, et al. The prevalence, awareness, treatment and control of dyslipidemia among adults in China. Atherosclerosis 2016;248:2-9.
20. Bu S, Ruan D, Yang Z, Xing X, Zhao W, Wang N, et al. Sex-specific prevalence of diabetes and cardiovascular risk factors in the mid- dle-aged population of China: a subgroup analysis of the 2007- 2008 China national diabetes and metabolic disorders study. PLoS One 2015;10:e0139039.
21. Arai H, Yamamoto A, Matsuzawa Y, Saito Y, Yamada N, Oikawa S, et al. Prevalence of metabolic syndrome in the general Japanese population in 2000. J Atheroscler Thromb 2006;13:202-8.