• 검색 결과가 없습니다.

Mediation Role of Satisfaction and Trust on Attitudinal Commitment and Relationship Quality

N/A
N/A
Protected

Academic year: 2021

Share "Mediation Role of Satisfaction and Trust on Attitudinal Commitment and Relationship Quality"

Copied!
7
0
0

로드 중.... (전체 텍스트 보기)

전체 글

(1)

Print ISSN: 2288-4637 / Online ISSN 2288-4645 doi:10.13106/jafeb.2020.vol7.n10.275

1

First Author. Lecturer, Faculty of Business Administration, Ho Chi Minh City University of Technology (HUTECH), Ho Chi Minh City, Vietnam. Email: [email protected]

2

Lecturer, School of International Education, Hong Bang International University, Ho Chi Minh City, Vietnam. Email: [email protected]

3

Corresponding Author. Lecturer, Faculty of Business Administration, Ton Duc Thang University, Ho Chi Minh City, Vietnam [Postal Address: 19 Nguyen Huu Tho Street, Tan Phong Ward, District 7, Ho Chi Minh City, 700000, Vietnam] Email: [email protected]

© Copyright: The Author(s)

This is an Open Access article distributed under the terms of the Creative Commons Attribution Non-Commercial License (https://creativecommons.org/licenses/by-nc/4.0/) which permits unrestricted non-commercial use, distribution, and reproduction in any medium, provided the original work is properly cited.

Mediation Role of Satisfaction and Trust on Attitudinal Commitment and Relationship Quality

Thi Trang TRAN

1

, Anh Tung TRAN

2

, Thi Ngan PHAM

3

Received: July 18, 2020 Revised: August 23, 2020 Accepted: August 28, 2020

Abstract

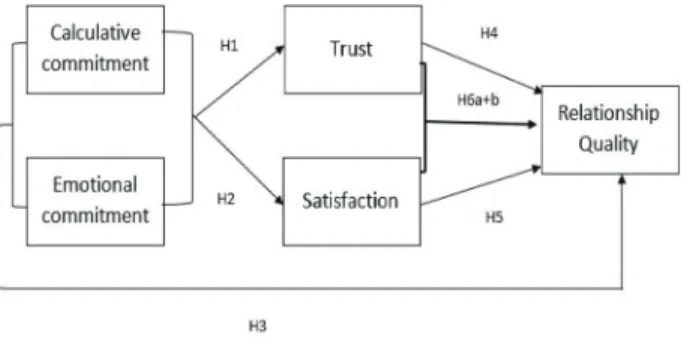
This study aims to explore a new approach of relationship assessment by partially employing attitudinal commitment to measure the influence on perception of cooperation within the Vietnamese rice supply chains, which begins from commercial enterprises up to the retailers in the Vietnamese market. The quantitative research is first built around the measurement instruments for the constructs of relationship quality (RQ) and its dimensions; next, a questionnaire is designed; finally, we deal with sample issues and analyze the data to answer the research questions. The truncated sampling technique and Likert-scale survey is a suitable method for analyzing Vietnamese rice retailers and data collection. The preliminary test was conducted using SPSS Statistics; the main test was, then, carried out to evaluate the proposed model and test the hypotheses. Appropriately, the results point to a significant influence of attitudinal factors on trust and satisfaction. In addition, with the involvement of perceived trust and satisfaction, that combination showed the mediating effect between the attitudinal factors and the relationship quality. The ad-hoc analysis indicated the significant role of the two mediators. To be more specific, the high degree of trust and satisfaction has a positive impact on the formation of the relationship between participants in the sector.

Keywords: Attitudinal Commitment, Relationship Quality, Vietnamese Rice Sector, Mediating Effect, Trust JEL Classification Code: M10, M11, M31

for these problems are the weak relationship between production and consumption, the lack of rice’s trademark, the lack of sharing key market information, and the lack of management’s knowledge (Williams and Hall, 2000).

Relationship with customers, which is an intangible asset of a firm, especially in a highly competitive environment, is difficult to be duplicated by competitors and helps to retain customers. This relationship is known as an important construct in relationship marketing (Christopher and Payne, 1991; Nguyen, 2020).

There are at least six steps for rice to journey from the field to Vietnamese daily meal. The five-stage process is as following: (1) the farmers, who own lands, grow rice and harvest paddies, then sell the harvest to the traders; (2) the traders, who own the means of transportation, collect paddies from many farmers, then sell them to the rice production enterprises; (3) the rice production enterprises own the machinery to mill paddies into brown rice, and polish brown rice into commercial rice; (4) commercial enterprises, who have warehouses, buy the rice from the rice production enterprises, and then sell it to retailers at supermarkets and rice retail stores; (5) consumers buy rice from these retailers. In practice, this process is much longer and complicate because

1. Introduction

The surplus of rice productions, thanks to the human

resources and the advantages of nature, makes Vietnam one of

the major rice exporters in the world. However, the rice sector

in Vietnam has many weaknesses: the price of Vietnamese

rice is lower than that of other countries; production

cost is high; there is a lack of modern infrastructure; and

slow update on the use of high technologies. The reasons

(2)

there are many different commercial intermediates from rice production enterprises to consumers. Furthermore, most rice businesses in Vietnam have a few common characteristics:

the transactions of product-service mix without contract, low switching costs, and high comparison-shopping behavior.

However, the field of RQ in agricultural products in Vietnam is still rarely considered. There is only one report by Tho and Trang (2009), which emphasized the role of RQ in creating marketing competitive advantages for a company by exploring determinants of the relationship value between suppliers and distributors. As a result, this study aims to contribute to the existing literature on relationship marketing by identifying the dimensions of business-to-business RQ and developing a scale for measuring the extent of RQ in customer-based perspective of businesses in Vietnam’s rice sector. The various definitions and dimensions of RQ are reviewed in the context of business marketing.

2. Literature Review

2.1. Definition of Relationship Quality

Since 1990, relationship quality (RQ) is defined by Crosby and Evans (1990) as a construct whereby “the customer is able to rely on the salesperson’s integrity and has confidence in the salesperson’s future performance because the level of past performance has been consistently satisfaction” in consumer market from customer’s perspective. Supporting the definition of Crosby and Evans, (1990), Hennig-Thurau and Klee (1997) also agreed that RQ refers to meeting the requirements of the customer involved in that relationship. In business-to-business settings, Woo and Ennew (2004) determined that RQ is a general assessment on the relationship’s essence. Therefore, conceptualizing the concept of RQ is relevant to the long-term relationship behaviors instead of the short-term exchanges. In addition, Tran (2020) defined business-to-business RQ as the degree to which both parties in a relationship are engaged in an active, long-term working relationship. In conclusion, the authors highlight RQ as an overall assessment on the relationship between seller and buyer.

2.2. Attitudinal Commitment

Vesel and Zabkar (2010) conceptualized the RQ in the retail markets. The research model was the second-order factor model of RQ reflected by attitudinal dimensions such as emotional commitment and calculative commitment.

Farrelly and Quester (2005) generally defined commitment as the specific intentions and behaviors having the purposes of realizing value for both parties over the long term.

Meyer and Allen (1997) posit that emotional, calculative, and normative commitment are the main components of

commitment, however normative commitment is highly correlated with emotional commitment. Therefore, this paper only considers two components of commitment, namely, emotional commitment and calculative commitment.

Firstly, Fullerton (2009) defined emotional commitment as customer’s independence to sustain doing business with a company with which they identify and like. Secondly, calculative commitment depends on economic factor more than emotional commitment, which depends on emotional factor. Calculative commitment is described by Geyskens and Steenkamp (1996) as the personal involvement because of customers’ recognition of their own benefits and losses of ending the relationship. Finally, normative commitment refers to the responsibility of a customer to a firm based on their ethical perspectives (Meyer and Allen, 1997).

From the above discussions, we hypothesize that emotional commitment and calculative commitment are dimensions of business-to-business RQ.

2.3. Trust

To define the conception of trust (TRS), Schurr and Ozanne (1985) suggest that it is when parties take their words or promises and would complete their assignment in a mutual transaction. The faith that emerges in the beginning steps and goes to the last phase is regarded as TRS. According to Anderson and Narus (1990), trust refers to the belief that company partners’ involvement culminates in positive outcomes for the company, not breeding bad results. Doney and Cannon (1997) described trust in term of credibility and benevolence. Firstly, the credibility is the degree to which the firm can believe that its partners have abilities to carry out effective performances (Vesel and Zabkar, 2010). Secondly, the benevolence is the extent to which the partner takes care of the other firm’s well-being. Therefore, the fundamental motivation to maintain a successful relationship over the long time is the trust between the partners. In addition, if the degree of trust is higher, the development and maintenance of the partnership will be easier. Thus, a hypothesis states that TRS is a dimension of RQ construct in Vietnam’s rice sector.

2.4. Satisfaction

Tran and Vo (2020) stated that the customer satisfaction (SAT) is important for a good relationship between a firm and its customers. In the business-to-business context, satisfaction between buyer and seller refers to a positive emotion formed by assessing all aspects (Anderson and Narus, 1990; Ganesan, 1994). According to Vesel and Zabkar (2010), there are many researchers who defined SAT as a cumulative construct because of the general level of customer satisfaction is based on all experiences with a firm.

The argumentation by Anderson and Fornell (1994) is that

(3)

a series of experiences with a firm’s product can improve the evaluation of customers over time. Similarly, Ganesan (1994) emphasized that the concept of satisfaction has both functions of a measuring variable and a predicting variable.

Crosby and Evans (1990) state that overall satisfaction is a dimension of RQ. Therefore, it is hypothesized that SAT is a dimension of RQ.

2.5. Attitudinal Commitment on Relationship Quality

The model of RQ and measurement scales of dimensions of RQ are based on theories of Woo and Ennew (2004), Lages and Lages (2005), Ulaga and Eggert (2006), Vesel and Zabkar (2010), Song and Su (2012), Segarra-Moliner and Moliner- Tena (2013), and Kumar and Poddar (2014). Therefore, studies on retailer-consumer relationship from consumer perceptions include: (1) the influence of relationship marketing tactics on perceived relationship investment;

(2) the influence of perceived relationship investment on RQ; (3) the influence of RQ on behavioral loyalty; (4) the mediating effects of product category involvement and consumer relationship proneness on link between perceived relationship investment and RQ. Thus, RQ is conceptualized by some distinct, but related dimensions such as trust, satisfaction, and commitment.

Moreover, according to Ulaga and Eggert (2006), Vesel and Zabkar (2010), Segarra-Moliner and Moliner-Tena (2013), RQ includes dimensions such as trust, commitment, and satisfaction. These dimensions are popularly used in many studies (Athanasopoulou, 2009). Woo and Ennew (2004), Song and Su (2012) suggested that cooperation is one of the dimensions of RQ, while Lages and Lages (2005), and Kumar and Poddar (2014) suggested communication quality as a dimension of RQ. There is no consensus in conceptualizing the RQ and its dimensions can vary depending on the context of research. Therefore, it is necessary to adjust it to suit the Vietnam’s rice sector.

2.6. Conceptual Framework and Hypotheses

H

1

: Attitudinal commitment factors possess significant effect on Trust.

H

2

: Attitudinal commitment factors possess significant effect on Satisfaction.

H

3

: Attitudinal commitment factors possess significant effect on RQ.

H

4

: Trust has significant impact on RQ.

H

5

: Satisfaction has significant impact on RQ.

H

6a

: Attitudinal commitment factors possess significant effect on RQ mediating solely by Trust

H

6b

: Attitudinal commitment factors possess significant effect on RQ mediating solely by Satisfaction.

Figure 1: The Effect of Attitudinal Commitment on Relationship Quality

3. Material and Methods 3.1. Qualitative Approach

In this research, the author chooses in-depth interview technique because it is one of the easiest interview techniques. In particular, in order to perform this in-depth interview, the author just needs to prepare some questions for exploring and confirming the components of RQ and their measurement scales.

3.2. Quantitative Approach

The quantitative research follows four steps. First, we build the measurement instruments for the constructs of RQ and its dimensions. In the next step, a questionnaire is designed that includes three parts: part one is an introduction;

part two consists of the main questions in relation to the constructs; part three includes characteristics questions of participants. Then, a plan about the sample size is drawn, and a method for collecting sample is prepared. Finally, we collect the samples and analyze the data to answer the research questions

3.3. Data Analysis Techniques

In this study, data analysis went through two steps:

preliminary test, and main analysis. In the preliminary test, the authors use exploratory factor analysis and Cronbach’s alpha with SPSS program to evaluate the reliability of scales, and test whether or not the scales measure exactly what the authors desire to measure on the construct. After the preliminary test, the authors carry out the main analysis to assess the proposed model and test the hypotheses. To do this, methods such as confirmatory factor analysis, structural equation model, and bootstrapping test are used with AMOS program.

Cronbach’s alpha is used first to test the reliability of

measurement scales of concepts. Items with item-total

(4)

correlation< 0.3 will be deleted and the standard for a scale to be chosen is Cronbach’s alpha>0.6 (Nunnally & Burnstein, 1994).

Exploratory factor analysis is appropriate when KMO>0.5, Bartlett’s test has sig. < 0.05, % Cumulative > 50%. Items with non-significant loadings and shared indicators are removed from the measurement model on a one-by-one basis.

The items have factor loading <0.4 or Cross Factor loading

> 0.3 will be deleted (Gerbing & Anderson, 1988). A factor loading is the correlation coefficient between an observed variable and its factors. We expect dimensions of RQ to relate to each other, therefore extraction method used is principal axis factoring and the rotation of factors is Promax.

In the main analysis, the authors use confirmatory factoring analysis, structural equation modeling, and bootstrap test with AMOS program to confirm the validity of the constructs and test the hypotheses. Scale validity is defined in term of the following details: (1) content or face validity depends on conceptual definitions; (2) convergent validity is the degree to which measures of the same concept are correlated; (3) discriminant validity is the degree to which latent variables are distinct; (4) nomological validity is the degree that the concepts are predicted accurately based on the proposed model. The three first validities are evaluated by confirmatory factoring analysis and the final validity is assessed by structural equation modeling.

Confirmatory factoring analysis is a first step in two- stage evaluations proposed by Anderson and Gerbing (1988).

In this stage, we estimate parameters of the measurement model, which show correlation between latent variables dimensions of RQ and evaluate the level of match between our theoretical specification of the factors and the actual data. In other words, we test the degree of representation of measured variable for a smaller number of constructs.

Notice that there are two ways to specify the measurement model: first, one structural path from the latent variable to an indicator can be fixed at 1 to set the scale; second, the variance of the latent variable is fixed at 1. Some criteria such as chi-square (χ2) or the probability of the chi-square;

CMIN/degree of freedom (CMIN/df); root mean square error of approximation (RMSEA); comparative fit index (CFI);

goodness of fit index (GFI) are used to indicate the overall model fit. Table 2 shows the thresholds for these criteria (Hair & Anderson, 1998; Byrne, 2001; Bloom, 2008).

Structural equation modeling is a second stage in the two- stage approach proposed by Anderson and Gerbing (1988).

In this stage, we estimate the structural model. The structural model shows the relationship between the latent variables’

dimensions of RQ and RQ construct as the hypotheses.

RQ construct is tested whether or not it is a second-order factor, and the first-order factors dimensions of RQ act as indicators of the second-order factor. Therefore, all the rules of threshold apply to second-order factor just as they do to

first-order factors. Just as was required in specifying each first-order construct, the scale must be set for the second- order construct as well. Next, we evaluate the fit of model to data and check standardized regression weight and p-value.

Final, we decide whether or not to accept the hypotheses.

Now, we would like to compare the standard error estimates based on the maximum likelihood theory to standard errors obtained from the bootstrap because maximum likelihood estimates are good only under the assumptions and a correct model. The bootstrap is a different approach to find approximate standard errors without the above limitations.

4. Findings

4.1. Reliability and Validity Test

The approach of EFA appears to identify the variables:

Attitudinal factor (ACM) denotes the independent variable, TRS and SAT are the mediating variables, and RQ is the dependent variable. The Promax rotation method applied to sort out the highest factor loadings value, while Principal Component Analysis is applied to extract variables (Hawkins and Tull, 2009). Hence, the items with factor loadings value below 0.5 will be eliminated. As a result, the summary of CFA and EFA outcomes are summarized in Table 1, in which the reliability and validity are shown to measure the whole instruments. In detail, the high value of KMO (0.887) indicates the appropriateness of model, and all values of Cronbach’s Alpha of the proposed model are high, serving the reliability of survey items.

CFA calculation partially sets the basis for SEM, it provides for the establishment of convergent and discriminant indices in order to serve the evaluation of validity construction as well as reliability of instruments.

Referred to the likelihood of two measures, the combination of indices such as composite reliability, average variance extracted (Anderson and Gerbing, 1988), maximum shared variance, and maximum inter-construct correlation are employed to serve the convergent and discriminant validity via factor loadings. Table 2 indicated the proper reliability and validity of all instruments as well as the CFA model in Figure 1 by applying the regulation as CR > 0.7, AVE > 0.5, MSV < AVE, and √AVE > Max correlation.

4.2. Model Fit

Table 3 shows that all indices to test the goodness of fit for the model are satisfactory. GFI, CFI and TLI are above 0.9.

The Root Mean Square Error of Approximation (RMSEA)

has a value of 0.041. This index is bounded lower than 0.08,

which is quite good. The goodness of fit result showed that

the model fits the data quite well.

(5)

Table 1: List of variables used in the analysis

Variables Items Mean SD Loadings

Cronbach’s Alpha

EFA CFA

ACM ACM2 4.11 0.683 0.650 0.72 0.759

ACM3 4.03 0.690 0.748 0.71

ACM4 4.01 0.682 0.620 0.72

TRS TRS1 3.81 0.779 0.685 0.71 0.768

TRS2 3.85 0.767 0.700 0.77

TRS4 3.73 0.794 0.742 0.69

SAT SAT3 4.11 0.668 0.664 0.65 0.726

SAT4 4.13 0.660 0.752 0.76

SAT5 3.99 0.635 0.611 0.65

RQ RQ4 3.85 0.782 0.509 0.61 0.750

RQ6 4.00 0.725 0.622 0.80

RQ7 3.99 0.715 0.895 0.744

Table 2: Convergent and Discriminant results

CR AVE MSV MaxR(H) TRS ACM RQ SAT

TRS 0.728 0.500 0.428 0.738 0.688

ACM 0.759 0.512 0.479 0.759 0.654 0.716

RQ 0.761 0.518 0.479 0.780 0.624 0.692 0.720

SAT 0.768 0.525 0.434 0.773 0.570 0.659 0.486 0.725

SAT 0.768 0.525 0.434 0.773 0.570 0.659 0.486 0.725

Table 3: Model fit indices

Indices Criteria Model

χ

2

/df < 3 2.228

GFI > 0.8 0.976

CFI > 0.9 0.980

TLI > 0.9 0.973

RMSEA ≤ 0.08 0.041

4.3. Hypotheses Testing

Table 4 illustrates the result of the hypotheses given the research model. As can be seen from the table, H

1

, H

2

, H

4

, and H

5

are significantly supported, but H

3

is rejected. ACM presents positive (b = 0.659) and significant (p < 0.004) effect on TRS, so H

1

is supported. In addition, the existence of a relationship between ACM and SAT is significantly confirmed with b = 0.247 and p < 0.008, which implied H

2

is supported. Respectively, the significant impacts between SAT and TRS on RQ (H

4

and H

5

) are supported with

b = 0.507 (p < 0.004) and 0.305 (p < 0.004). In addition, the direct effect of ACM on RQ (H

3

) is not performed with b = - 0.022 and p < 0.666. As a result, H

6a

and H

6b

have significant mediating effects as stated.

The mediation testing shows significant correlation between ACM and RQ with the presence of two mediators.

Consequently, H

6a

and H

6b

are supported as shown in Table

5. This result reminds us to review each mediator separately

to understand the mediation effects in a better way. The post-

hoc studies of the mediation pointed out that TRS and SAT

functioning as significant mediators between ACM and RQ.

(6)

5. Conclusion

This research contributes to the literature of RQ by empirically examining the conceptualization of the RQ in Vietnam’s rice sector. The results of this research are in agreement with Vesel and Zabkar’s (2010) findings, which showed that the attitudinal commitment is a two-dimensional construct. It also implies that Vietnam’s domestic rice sector shares common characteristics with the retail market setting in Vesel and Zabkar’s (2010) research as non-contractual transactions; low switching costs; and high comparison- shopping behavior. As per the results, the RQ in the mind of customers is rationally scaled and measured by commitment through the mediation of satisfaction and trust.

By the measurement of mediators, in building relationship with customers, the firm should concentrate on maintaining its integrity as well as establishing goals for mutual benefits with their customers. Apparently, the high level of trust and satisfaction would lead to the effectiveness in enhancing the relationship between stakeholders, especially in the rice retailing market.

Nevertheless, the scope of this research is only focusing on Vietnam’s rice sector, therefore the generalization of the findings is limited. The RQ construct should be tested empirically in other contexts of Vietnam’s agriculture to build a general measurement scale for Vietnam’s agriculture to promote the development of this traditional sector.

Because the relationship is a dyadic concept, both seller and buyer should be active in their relationship. Future research should consider both sides including buyer and seller. The antecedents and consequences of RQ are aspects lacking in this research. They should be included in the model of RQ in future research.

References

Anderson, E. W., Fornell, C., & Lehmann, D. R. (1994). Customer satisfaction, market share, and profitability: Findings from Sweden. Journal of Marketing, 58(3), 53-66. https://doi.

org/10.1037/1252310

Anderson, J. C., & Narus, J. A. (1990). A model of distributor firm and manufacturer firm working partnerships. Journal of Marketing, 54(1), 42-58. https://doi.org/10.2307/1252172 Athanasopoulou, P. (2009). Relationship quality: a critical literature

review and research agenda. European Journal of Marketing, 43(5/6), 583-610. https://doi.org/10.1108/03090560910946945 Bloom, H. (Ed.). (2008). Ernest Hemingway’s The Old Man and the

Sea. New York, NY: Infobase Publishing.

Byrne, B. M. (2001). Structural equation modeling with AMOS, EQS, and LISREL: Comparative approaches to testing for the factorial validity of a measuring instrument. International Journal of Testing, 1(1), 55-86. https://doi.org/10.1207/

S15327574IJT0101_4

Crosby, L. A., Evans, K. R., & Cowles, D. (1990). Relationship quality in services selling: an interpersonal influence perspective. Journal of Marketing, 54(3), 68-81. https://doi.

org/10.1037/10.2307/1251817

Christopher, M., Payne, A., & Ballantyne, D., (1991). Relationship marketing: bringing quality customer service and marketing together. Oxford, UK: Butterworth-Heinemann. https://doi.

org/10.1002/jsc.4240030208

Doney, P. M., & Cannon, J. P. (1997). An examination of the nature of trust in buyer–seller relationships. Journal of Marketing, 61(2), 35-51. https://doi.org/10.2307/1251829

Farrelly, F. J., & Quester, P. G. (2005). Examining important relationship quality constructs of the focal sponsorship Table 4: Model fit indices

# Hypotheses Result Sig

H

1

Attitudinal Commitment factors possess significant effect on Trust Supported (.659) .004 H

2

Attitudinal Commitment factors possess significant effect on Satisfaction Supported (.247) .008 H

3

Attitudinal Commitment factors possess significant effect on Relationship Quality Rejected (-.022) .666

H

4

Trust has significant impact on Relationship Quality Supported (.507) .004

H

5

Satisfaction has significant impact on Relationship Quality) Supported (.305) .004

Table 5: Results of the mediation analyses

Hypotheses Path Total Direct Indirect Mediation

H

6a

ACM RQ (with the mediation of TRS) 0.37*** 0.54/NS 0.38*** Full mediation

H

6b

ACM RQ (with the mediation of SAT) 0.273*** 0.045/NS 0.228*** Full mediation

*** P value significant at 0.001

(7)

exchange. Industrial Marketing Management, 34(3), 211-219.

https://doi.org/10.1016/j.indmarman.2004.09.003

Fullerton, G. (2009). The impact of brand commitment on loyalty to retail service brands. Canadian Journal of Administrative Sciences, 22(2), 97-110. https://doi.

org/10.1111/j.1936-4490.2005.tb00712.x

Ganesan, S. (1994). Determinants of long-term orientation in buyer-seller relationships. Journal of Marketing, 58(2), 1-19.

https://doi.org/10.2307/1252265

Geyskens, I., Steenkamp, J. B. E., Scheer, L. K., & Kumar, N.

(1996). The effects of trust and interdependence on relationship commitment: A trans-Atlantic study. International Journal of Research in Marketing, 13(4), 303-317. https://doi.org/10.1016/

S0167-8116(96)00006-7

Hair, J., Anderson, R., Tatham, R., & Black, W. (1998).

Multivariate Data Analysis (5th Ed.). London, UK: Prentice Hall International.

Hair, M. L., & Tripp, C. P. (1995). Alkylchlorosilane reactions at the silica surface. Colloids and Surfaces A: Physicochemical and Engineering Aspects, 105(1), 95-103. https://doi.

org/10.1016/0927-7757(95)03298-5

Hawkins, D. I., & Tull D. S. (2009). Marketing Research.

Measurement and Method (6

th

Ed.). New Delhi, India: PHI Learning.

Hennig‐Thurau, T., & Klee, A. (1997). The impact of customer satisfaction and relationship quality on customer retention:

A critical reassessment and model development. Psychology

& Marketing, 14(8), 737-764. https://doi.org/10.1002/

(SICI)1520-6793(199712)14:8<737::AID-MAR2>3.0.CO;2-F Kumar M., R., & Poddar, A. (2014). Problematic customers and

customer service employee retaliation. Journal of Services Marketing, 28(3), 244-255. https://doi.org/10.1108/JSM-02- 2013-0040

Lages, L. F., Lages, C., & Lages, C. R. (2005). Bringing export performance metrics into annual reports: The APEV scale and the PERFEX scorecard. Journal of International Marketing, 13(3), 79-104. https://doi.org/10.1509/jimk.13.3.79

Meyer, J. P., & Allen, N. J. (1997). Commitment in the workplace:

Theory, research, and application. Newbury Park, CA: Sage Publications. https://doi.org/10.4135/9781452231556

Nunnally, J. C., & Bernstein, C. (1994). Psychometric theory. New York, NY: McGraw-Hill. https://doi.

org/10.3102/00028312005003431

Nguyen, T. H. (2020). Impact of Leader-Member Relationship Quality on Job Satisfaction, Innovation and Operational Performance: A Case in Vietnam. Journal of Asian Finance, Economics, and Business, 7(6), 449-456. https://doi.org/

doi:10.13106/jafeb.2020.vol7.no6.449

Schurr, P. H., & Ozanne, J. L. (1985). Influences on exchange processes: Buyers’ preconceptions of a seller’s trustworthiness and bargaining toughness. Journal of Consumer Research, 11(4), 939-953. https://doi.org/ 10.1086/209028

Segarra-Moliner, J. R., Moliner-Tena, M. A., & Sánchez-Garcia, J. (2013). Relationship quality in business to business: a cross-cultural perspective from universities. Marketing Intelligence & Planning, 31(3), 196-215. https://doi.

org/10.1108/02634501311324573

Song, Y., Su, Q., Liu, Q., & Wang, T. (2012). Impact of business relationship functions on relationship quality and buyer’s performance. Journal of Business & Industrial Marketing, 27(4), 286-298. https://doi.org/10.1108/08858621211221661 Tran, V. D. (2020). Assessing the effects of service quality,

experience value, relationship quality on behavioral intentions.

Journal of Asian Finance, Economics, and Business, 7(3), 167- 175. https://doi.org/10.13106/jafeb.2020.vol7.no3.167

Tran, V. D., Vo, T. N. L., & Dinh, T. Q. (2020). The Relationship between Brand Authenticity, Brand Equity and Customer Satisfaction. Journal of Asian Finance, Economics, and Business, 7(4), 213-221. https://doi.org/10.13106/jafeb.2020.

vol7.no4.213

Ulaga, W., & Eggert, A. (2006). Relationship value and relationship quality: Broadening the nomological network of business- to-business relationships. European Journal of Marketing, 40(3/4), 311-327. https://doi.org/10.1108/03090560610648075 Vesel, P., & Zabkar, V. (2010). Relationship quality evaluation

in retailers’ relationships with consumers. European Journal of Marketing, 44(9/10), 1334-1365. https://doi.

org/10.1108/03090561011062871

Williams, A. M., & Hall, C. M. (2000). Tourism and migration: new relationships between production and consumption. Tourism Geographies, 2(1), 5-27. https://doi.

org/10.1080/146166800363420

Woo, K. S., & Ennew, C. T. (2004). Business-to-business relationship

quality: an IMP interaction-based conceptualization and

measurement. European Journal of Marketing, 38(9/10), 1252-

1271. https://doi.org/ 10.1108/03090560410548960.

수치

Figure 1: The Effect of Attitudinal Commitment on  Relationship Quality
Table 1: List of variables used in the analysis
Table 5: Results of the mediation analyses

참조

관련 문서