Effects of Replacing Corn with Rice or Brown Rice on Laying Performance, Egg Quality, and Apparent Fecal Digestibility of Nutrient in Hy-Line Brown Laying Hens
Chan Ho Kim, Seong Bok Park and Hwan Ku Kang
†Poultry Science Division, National Institute of Animal Science, RDA, Cheonan 331-801, Republic of Korea
ABSTRACT This study aimed of effects of replacing maize with rice or brown rice on laying performance, egg quality, and apparent fecal digestibility of nutrient in Hy-Line Brown laying hens. A total of 200, 25-week old Hy-Line Brown laying hens were randomly assigned to one of 5 treatments, each of which was replicated 4 times. Four experimental diets that were formulated two different grains (brown rice or rice) with two inclusion levels of (15 and 30%) as a replacement of maize.
The experimental period was 8 weeks. During the experiment, hens were provided with feed and water ad libitum and were exposed to a 16:8=L:D lighting schedule. There were no differences in feed intake, egg weight, and egg mass during the 8 weeks of the feeding trial among groups. However, hen-day egg production was greater (P<0.05) for Brown rice treatment groups than that for basal and rice treatment groups. In addition, the supplementation of brown rice or rice did not have an effect on eggshell strength, eggshell thickness, and HU during of the feeding trial (Table 4). However, egg yolk color was less (P<0.05) for basal treatment groups than that for among treatment group. ATTD of dry matter (DM) and crude fat were greater (P<0.05) for brown rice 15 treatment than for rice 30 treatment. Crude protein (CP) was greater (P<0.05) for brown rice 15 treatment than for basal treatment. In conclusion, brown rice or rice grains is a good alternative energy feedstuff and can be used in laying hens, totally replacing maize, without any negative effect on the laying performance, egg quality, and nutrient digestibility.
(Key words: brown rice, laying hens, laying performance, maize, nutrient digestibility)
†
To whom correspondence should be addressed : [email protected]
INTRODUCTION
The global demand for maize to be used in the production of agricultural feed and fuel is increasing at a rapid rate (Edgerton, 2009). To offset this demand, several studies demonstrated that the rice, including brown rice, shows potential for use as a substitute for maize in poultry feed (Honda et al., 2011; Sittiya et al., 2011; Nanto et al., 2015, 2016). In Korea, a search for local sources of poultry feed has been underway to replace expensive imported feed stuffs, mainly maize and soybeans. If rice could replace maize as animal feed in area, advantages might accrue to the feed industry and animal production.
Brown rice was husked from one kind of early, long grain, non-glutinous rice (ELGNR, indica rice) in Korea. Brown rice has an excellent AME and crude protein composition com- pared to maize contains 14.02 MJ of AME/kg and 91.6 g/kg crude protein. It has been suggested that the availability of digestible energy, crude protein and dry matter than those of maize ration (Piao et al., 2002; He et al., 2000). The growth
performance and the apparent fecal digestibility were not ne- gative affected when 50% maize was replaced by brown rice in weanling pig diet (Li et al., 2002) and growing pigs (Zhang et al., 2002).
Rice is well known as the major main food in most de- veloping countries in the world, especially in Asia. Asian countries contribute approximately 92% of the world rice production, mostly of the Oryzae sativa species, which has been cultivated widely in warm climates (Alias and Ariffin, 2008). Rice has an excellent AME and crude protein compo- sition compared to maize contains 12.97 MJ of AME/kg and 79.0 g/kg crude protein. Wu et al. (1986) reported that feeding polished rice to growing pigs appeared feasible in growth performance.
The objective of this experiment was to study the effects of replacing corn with rice or brown rice on laying perfor- mance, egg quality, and apparent fecal digestibility of nutrient in Hy-Line Brown laying hens.
MATERIALS AND METHODS
Table 2. Composition and nutrient content of experimental diets (as-fed basis)
Basal Brown rice 15 Brown rice 30 Rice 15 Rice 30
Ingredients (%)
Corn 60.69 45.69 30.69 45.65 30.69
Rice - - - 15.00 30.00
Brown rice - 15.00 30.00 - -
Soybean meal 24.66 23.66 23.06 24.06 22.16
Corn gluten meal - 1.00 1.40 - 1.60
Soybean oil 2.50 2.50 2.70 3.10 3.40
Diacalcium phosphate 1.90 1.90 1.90 1.90 1.90
Limestone 9.80 9.80 9.80 9.80 9.80
NaCl 0.25 0.25 0.25 0.25 0.25
Vitamin-mineral premix
10.20 0.20 0.20 0.20 0.20
Total 100.00 100.00 100.00 100.00 100.00
Energy and nutrient contents
2ME
n(MJ/kg) 2,844.00 2,842.00 2,844.00 2,843.00 2,843.00
Crude protein (%) 16.50 16.60 16.60 16.30 16.50
Calcium (%) 3.96 3.96 3.96 3.96 3.96
Available P (%) 0.72 0.72 0.71 0.70 0.69
Lysine (%) 0.89 0.87 0.85 0.88 0.85
Methionine + cystine (%) 0.56 0.56 0.56 0.55 0.56
1
Provide per kilogram of the complete diet: vitamin A (from vitamin A acetate), 12,500 IU; vitamin D
3, 2,500 IU; vitamin E (from DL-α-tocopheryl acetate), 20 IU; vitamin K
3, 2 mg; vitamin B
1, 2 mg; vitamin B
2, 5 mg; vitamin B
6, 3 mg; vitamin B
12, 18 µg; cal- cium pantothenate, 8 mg; folic acid, 1 mg; biotin, 50 µg; niacin, 24 mg; Fe (as FeSO
4․7H
2O), 40 mg; Cu (as CuSO
4․H
2O), 8 mg; Zn (as ZnSO
4․H
2O), 60 mg; Mn (as MnSO
4․H
2O) 90 mg; Mg (MgO) as 1,500mg.
2
Nutrinet contents in all diets were analyzed.
The protocol for this experiment was reviewed and app- roved by the Institutional Animal Care and Welfare Committee of the National Institute of Animal Science, Rural Develop- ment Administration, Republic of Korea.
1. Diets and Experimental Design
In total, 200 Hy-Line Brown egg-laying hens were (25 weeks of age) were randomly allotted to 1 of 5 dietary treat- ments. Each treatment had 4 replicates with 5 cages and 2 hens per cage (30 × 37 × 40 cm, width × length × height).
A commercial basal diet was formulated to meet or exceed nutrient recommendations of the NRC (1994) for laying hens (Table 2). Four experimental diets that were formulated two different grains (brown rice or rice) with two inclusion levels of (15 and 30%) as a replacement of maize. The experimental
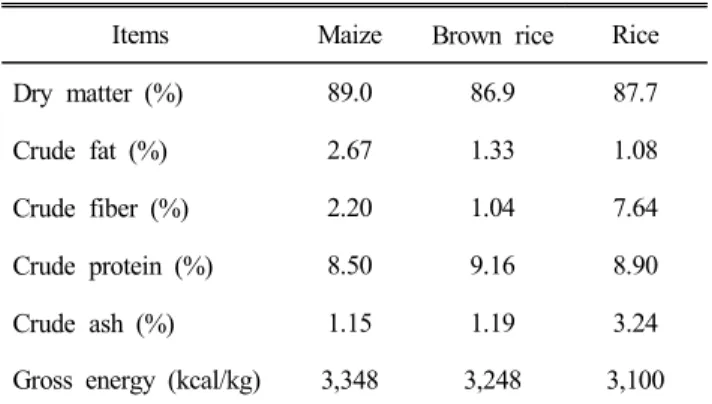
Table 1. Analyzed composition of maize, brown rice, and rice
1Items Maize Brown rice Rice
Dry matter (%) 89.0 86.9 87.7
Crude fat (%) 2.67 1.33 1.08
Crude fiber (%) 2.20 1.04 7.64
Crude protein (%) 8.50 9.16 8.90
Crude ash (%) 1.15 1.19 3.24
Gross energy (kcal/kg) 3,348 3,248 3,100
1
Nutrient composition was analyzed in duplicate for dry matter
(AOAC, 1990; method 934.01), crude fat (AOAC, 1990; method
920.39), crude fiber (AOAC, 1990; method 978.10), crude
protein (AOAC, 1990; method 988.05), and crude ash (AOAC,
1990; method 942.05).
period was 8 weeks. During the experiment, hens were pro- vided with feed and water ad libitum and were exposed to a 16:8=L:D lighting schedule. The temperature and humidity of the laying house was maintained at 18±3 ℃ and 65∼70%, respectively, during the experiment.
2. Laying Performance
Hen-day egg production rate, and egg weight were record- ed daily, whereas feed intake and the feed conversion ratio were recorded weekly. Egg mass was calculated as per Hayat et al. (2009).
Egg mass = Weekly number of eggs in a replicate × Average egg weight
3. Determination of Egg Quality Parameter Ten eggs per replicate were randomly collected at the end of the each week. Eggshell strength, eggshell thickness, egg yolk colour, and Haugh units (HU) were measured. Eggshell strength was measured by the Texture Systems Compression Test Cell (model T2100C, Food Technology Co., Ltd., Rock- ville, MD, USA) and expressed as units of compression force exposed to units of eggshell surface area (kg/cm
2). Eggshell thickness is defined as the mean value of measurements at 3 different locations on the egg (aircell, equator, and sharpend) and was measured with a dial pipe gauge (model 7360, Mi- tutoyo Co. Ltd., Kawasaki, Japan) and calculated using the following formula (Yannako pouls and Tserveni-Gousi 1986).
Eggyolk color was evaluated by the Roche Yolk Color Fan (Hoffman-La Roche Ltd., Basel, Switzerland; 15=dark orange;
1=light pale). Hough unit values were calculated using a mi- crometer (model S-8400, Ames, Walthman, MA, USA) with the following formula described by Eisen et al. (1962):
HU = 100 log (H — 1.7W
0.37+7.6),
where W is egg weight, and H is albumen height.
4. Nutrient Digestibility
Birds were fed the experimental diets for 8 d with a 5-d adaptation period to the diet and a following 3-d excreta collection period. The marker to marker method was used to
ensure total collection of excreta voided form the birds (Ade- ola, 2001). Chromic oxide (0.3%) and ferric oxide (0.3%) were added to the diet at the start of collection period and at the conclusion of the collection period, respectively. Excreta collection was started when chromic oxide was appeared in excreta, and the collection was finished when ferric oxide was appeared in excreta. Full caution was paid to prevent disturb- ing the birds whenever the feces were monitored. Feed intake was recorded on a daily basis, and stored at —4℃ be- fore analysis. Excreta sample were dried in a force-air drying oven at 60℃ for 72 h and finely ground for the subsequent analysis. Diet was analyzed for gross energy using bomb calorimeter (Parr Instrument, Moline, IL). The diets and excreta samples were analyzed for DM (Method, 934.01), crude protein (Method, 988.05), crude fat (Method, 920.39), crude fiber (Method, 978.10), and crude ash (Method, 942.05) using stan- dard procedures of AOAC (1990).
5. Statistical Analysis
All data analyzed by analysis of variance according to a completely randomized design using the Proc Mixed procedure of SAS (SAS Inst., Inc., Cary, NC, USA). Outlier data were identified by the UNIVARIATE procedure of SAS, but no outliers were found. Least squares means were calculated and the means among treatments were compared by the PDIFF option with the Tukey’s adjustment. Significance was set at P<0.05.
RESULTS AND DISCUSSION
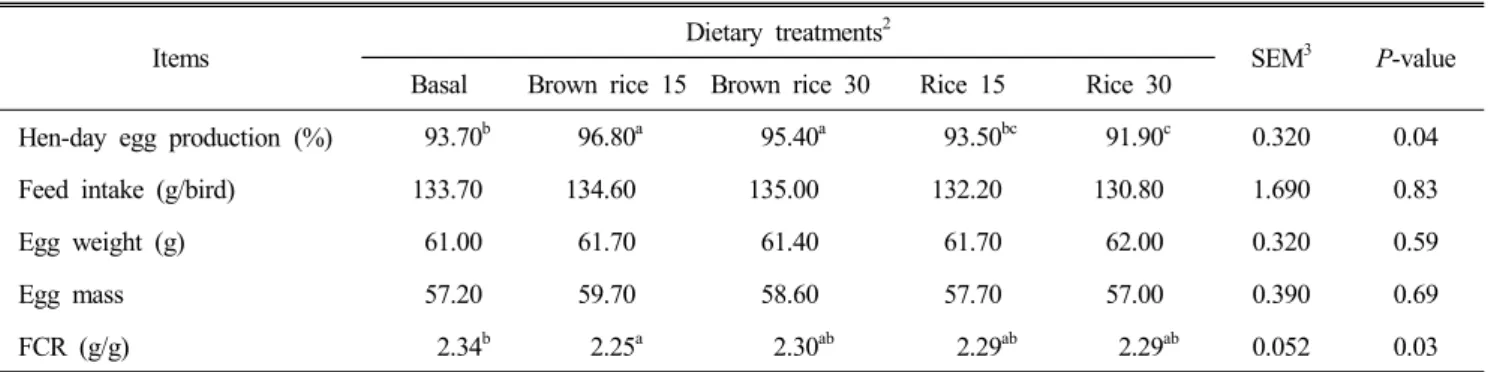
There were no differences in feed intake, egg weight, and egg mass during the 8 weeks of the feeding trial among groups. However, hen-day egg production was greater (P<
0.05) for Brown rice treatment groups than that for basal and rice treatment groups (Table 3). Basal treatments based on compared to, hen-day egg production was increased 3.3, 1.8,
—0.2, and —1.9% respectively. Feed conversion ratio was less
(P<0.05) for brown rice 15 treatment group than that for basal
treatment group. Basal treatments based on compared to, feed
conversion ratio was improved 3.8, 1.7, 2.1 and 2.1%, respec-
tively. Different levels of brown rice or rice used in laying
hens have not been studied.
Table 3. Effects of replacing corn with rice or brown rice on laying performance
1Items
Dietary treatments
2SEM
3P-value Basal Brown rice 15 Brown rice 30 Rice 15 Rice 30
Hen-day egg production (%) 93.70
b96.80
a95.40
a93.50
bc91.90
c0.320 0.04
Feed intake (g/bird) 133.70 134.60 135.00 132.20 130.80 1.690 0.83
Egg weight (g) 61.00 61.70 61.40 61.70 62.00 0.320 0.59
Egg mass 57.20 59.70 58.60 57.70 57.00 0.390 0.69
FCR (g/g) 2.34
b2.25
a2.30
ab2.29
ab2.29
ab0.052 0.03
a,b
Values with different superscripts in the same row are significantly different (P<0.05).
1
Data are least squares means of 4 observations per treatment.
2
Basal diet was supplemented at the level of 15 or 30% brown rice and 15 or 30% rice, respectively.
3
Pooled standard error of mean.
Table 4. Effects of replacing corn with rice or brown rice on egg quality of laying hens
1Items
Dietary treatments
2SEM
3P-value Basal Brown rice 15 Brown rice 30 Rice 15 Rice 30
Eggshell strength (kg/cm
2) 4.11 4.42 4.43 4.40 4.42 0.123 0.29
Eggshell thickness (μm) 421.20 444.70 444.30 450.20 450.90 4.320 0.46
Eggyolk color 11.70
a10.70
b10.50
b10.50
b10.60
b0.090 0.04
Haugh unit 92.50 92.80 93.60 93.60 92.10 0.840 0.52
a,b
Values with different superscripts in the same row are significantly different (P<0.05).
1
Data are least squares means of 10 observations per treatment.
2
Basal diet was supplemented at the level of 15 or 30% brown rice and 15 or 30% rice, respectively.
3
Pooled standard error of mean.
Dietary supplementation of brown rice or rice has been reported to improve BW gain in growing pigs (Zhang et al., 2002) and broilers (Nanto et al., 2012). Brown rice is an ex- cellent source of protein, containing 37% of the total protein as essential amino acids and 18% as BCAA (USDA, 2013).
Gao et al. (1993) reported that the growth performance of pigs feed brown rice was significantly higher than that of the basal treatment when brown rice either partially or completely replaced maize, and the complete replacing took on a little better result than partially replacing with though insignificant difference. He et al. (2000) and Li et al. (2002) reported that the balance of amino acids in brown rice was better than that in maize.
In addition, the supplementation of brown rice or rice did not have an effect on eggshell strength, eggshell thickness, and HU during of the feeding trial (Table 4). However, egg
yolk color was greater (P<0.05) for basal treatment groups
than that for among treatments. Basal treatments based on
compared to, egg yolk color was decreased 8.5, 10.3, 10.3
and 9.4%, respectively. Egg yolk color is a major concern to
consumers and greatly affects their purchasing behavior (De-
Groote, 1970; Fletcher, 1999). Although xanthophylls contain-
ing diet does not provide higher nutrition levels, enhancements
are observed in pigmentation of egg yolk (Bortolotti et al.,
2003; Na et al., 2004; Wang et al., 2007). Maize is one of
the most important ingredients of laying hens fed contains
lutein, zeaxanthin, which are the main xanthophylls in egg
yolks (NRC, 1994). Shin et al. (2015) reported that maize
contained a high amount of lutein (2,096 μg/100g). Minatel
et al. (2014) reported that rice contained amount of lutein
(243.7 μg/100g). Pigmentation of egg yolks is influenced mos-
tly by layer diet (Colin et al., 2004) and maize is a rich
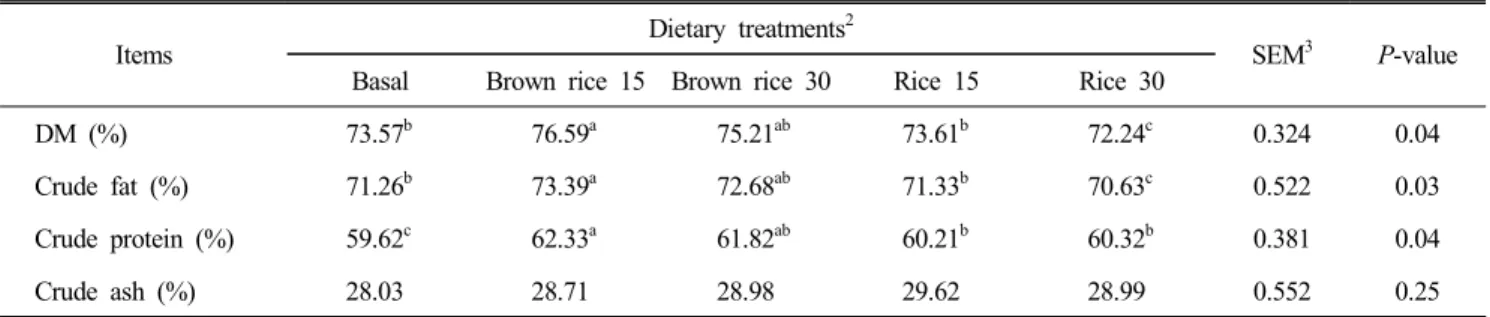
Table 5. Effects of replacing corn with rice or brown rice on apparent total tract digestibility (ATTD) of nutrients of laying hens
1Items
Dietary treatments
2SEM
3P-value Basal Brown rice 15 Brown rice 30 Rice 15 Rice 30
DM (%) 73.57
b76.59
a75.21
ab73.61
b72.24
c0.324 0.04
Crude fat (%) 71.26
b73.39
a72.68
ab71.33
b70.63
c0.522 0.03
Crude protein (%) 59.62
c62.33
a61.82
ab60.21
b60.32
b0.381 0.04
Crude ash (%) 28.03 28.71 28.98 29.62 28.99 0.552 0.25
a,b
Values with different superscripts in the same row are significantly different (P<0.05).
1
Data are least squares means of 8 observations per treatment.
2
Basal diet was supplemented at the level of 15 or 30% brown rice and 15 or 30% rice, respectively.
3