INTRODUCTION
Phytic acid (myo-inositol hexakis-dihydrogenphosphate, IP6) is a ubiquitous compound that is abundant in plant source feed ingredients (cereal grains and oilseeds), serving as the major storage form of phosphorus (P). According to the literature, about two-thirds of the total P in these plant source materials is present as the form of phytate which are salts of phytic acid and act as an anti-nutritional element (Jing et al., 2018). Phytic acid is an unwanted dietary agent and carries a strong negative charge thereby cause it make easily chelates form with these nutrient elements not only macro-micro minerals such Ca, Fe, Zn, Mg, Mn, Cu and Co but also some other organic components like proteins and carbohydrates (Cowieson et al., 2009). Due to chelating nature with nutrients phytate limits the availability of minerals and
other dietary nutrients in monogastric animals because of which poor phytate hydrolyzing enzymes called phytase present in the gastrointestinal tract; therefore, the effect of phytase supplementation in the diet of monogastric animals is being extensively investigated (Adeola and Cowieson, 2011). The beneficial effects of phytase as an additive in the diet which can hydrolyze phytate-bound components as a result may have improve performance and nutrient utilization by increasing metabolic activity and digestibility of monogastric animals (Butani and Parnerkar, 2015). In recent years, a series of studies have shown that phytase has a potent ability to liberate the anti-nutritional effect of phytate and improve the digestibility of phytate-bound P, Ca amino acids and energy as well as minimize of excess P excretion to the environment (Dersjant-li et al., 2015). Additionally, observed results of previous study on laying hens indicated that the supplemen-
Effects of Dietary Available Phosphorus Levels and Phytase Supplementation on Performance, Egg Quality and Serum Biochemical Parameters of Hy-Line Brown Laying Hens
from 40 to 60 Weeks of Age
Chun Ik Lim
1, Md Masud Rana
1, Hwan Ku Kang
2and Kyeong Seon Ryu
3†1
Researcher, Department of Animal Science, Chonbuk National University, Jeonju 54896, Republic of Korea
2
Researcher, Poultry Research Institute, National Institute of Animal Science, RDA, Pyeongchang 25342, Republic of Korea
3
Professor, Department of Animal Science, Chonbuk National University, Jeonju 54896, Republic of Korea
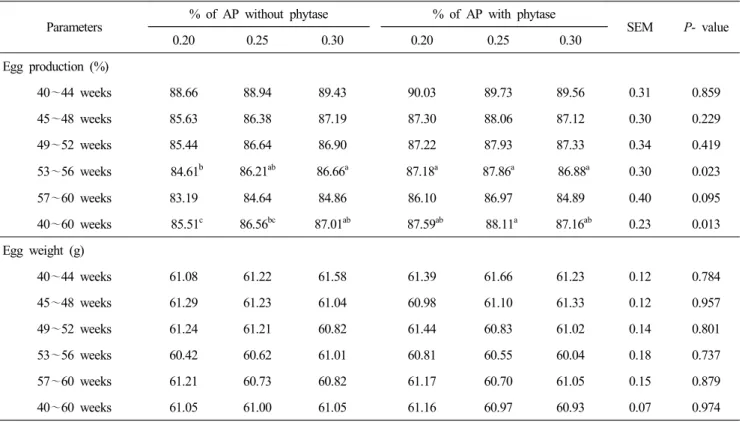
ABSTRACT This study was performed to evaluate the effects of available phosphorus (AP) levels with or without supplemental phytase on the performance, egg quality, and serum biochemical parameters of laying hens. A total of 540 laying hens (40-week-old) were housed in cages and assigned to 6 dietary treatments with 5 replicates each, for 20 weeks. The treatments consisted of 0.20%, 0.25%, and 0.30% AP diets with or without phytase supplementation. During the 20-week period, egg production was lowest in hens fed the 0.20% AP diet; however, phytase supplementation in the diet completely corrected the adverse effect (P<0.05). No consistent difference was observed in egg production between hens fed the 0.25%
and 0.30% AP diets and those fed the 0.20% and 0.30% AP diets with phytase supplementation. Similarly, egg mass was lowest in the 0.20% AP diet-fed group, and no difference in egg mass was observed in the 0.25% and 0.30% AP diet as well as the phytase-supplemented diet groups; however, egg mass was improved in the phytase-supplemented diet groups(P<0.05). Egg quality traits did not differ with dietary treatments. Serum alkaline phosphatase level showed a linear decrease (P<0.05) in the phytase-treated groups with increasing AP levels; moreover, a numerically linear increase (P<0.05) in serum Ca and P levels was observed in the phytase-treated groups. The results of this study indicate that phytase supplementation in the diet of laying hens could increase egg production and may lead to greater mineral absorption.
(Key words: performance, egg quality, serum biochemical, available phosphorus, phytase)
†
To whom correspondence should be addressed :
[email protected]tation of phytase in the diet of laying hens had improved egg production, egg quality, nutrient digestibility, and retention of minerals (Panda et al., 2005; Gao et al., 2013; Englmaierova et al., 2014; Rojas et al., 2017). Moreover, the use of exo- genous phytase as a feed additive to poultry diet may partially or completely minimize nutrient variability of feedstuffs by reducing the cost of nutritional inputs, as example, by re- placing inorganic source such as dicalcium phosphate and increase the accuracy of feed formulation (Sousa et al., 2015), as well as leads to reduction of P excretion in the environment (Slominski, 2011). However, although a number of studies have already been carried out to investigate the potentiality of phytase use as feed additive in laying hens diet to extended persistency of lay after end of peak but there were no general resemble till indicated among the research findings about concerning between the dietary AP require- ments and addition of phytase on laying hens, even, there have very sparse information concerning the effect of phytase addition in laying hens diet on the serum biochemistry variables. Thus, the purpose of this study was to investigate the effect of AP levels with or without supplemental phytase on performance, egg quality and serum biochemical para- meters of Hy-line brown laying hens from 40 to 60 weeks of age.
MATERIALS AND METHODS
1. Experimental Design and Diets
The experimental procedure was performed following the guidelines for the use of animals in experimentation, as provided by the Jeonbuk National University, Republic of Korea. A total of 540 Hy-line brown laying hens aged at 38 weeks of age, obtained from a commercial source, were placed in a poultry house in conventional type three-tier cages (two hens per cage). The cage dimensions were 30 cm
× 40 cm, equating to 1,200 cm
2floor space per cage. During the pre-experimental period from 38 to 40 weeks of age, hens were kept in the house for the acclimatization and were fed a common conventional layer mash diet and, the egg pro- duction recorded daily and eggs were weighed two times in a week.
Thereafter, at the age of 40 weeks, the hens (similar mean egg production of hens) were randomly assigned into 1 of 6 dietary treatments, each comprising five replicates and eighteen hens in each replicate in a completely randomized design. A replicate consisted of three adjacent cages in upper and alike in middle and bottom to minimize the cage level effect. The cages were equipped with trough feeder and nipple drinker line. A continuous feed trough was divided as the replicate as if hens were not able to consume feed assigned to the adjoining replicate. Three isoenergetic (2,750 kcal/kg ME) and isonitrogenous (16.0% CP) diets were formulated to contain three levels of 0.20, 0.25 and 0.30%
AP respectively, and with or without phytase (1,000 FTU per kg diet, Ronozyme Hiphos-L, Aspergillus oryzae 6-phytase) was supplemented. A constant level of 4.0% Ca was main- tained in all dietary treatments and other dietary nutrients were fulfilled as the requirement of laying hen by the following specification of NRC (1994). During the experiment, hens under all treatment groups were given free access to mash type feed and water, and were exposed to a 16L: 8D lighting schedule. The mortality was replaced by spare hens kept upon on identical treatments throughout the experimental period. The composition of ingredients and che- mical analysis of the basal diets are presented in Table 1.
2. Performance of Laying Hens
Laying performance of hens was determined at the end of every four weeks by monitoring egg production, egg weight, egg mass, feed intake and feed conversion ratio. Egg pro- duction was recorded daily which was expressed on a hen-day basis (% hen-day) at the end of each four weeks.
Eggs were collected two times in a week and the weight was taken to calculate mean egg weight. Egg mass (g/hen/day) was calculated by multiplying egg weight by egg production.
Feed intake was determined at the end of four weeks as the replicate basis of each treatment by subtracting the remaining feed from the original amount of feed that was provided.
Feed conversion ratio was calculated on the basis of amount of feed intake in gram divided by egg mass in gram.
3. Egg Quality
Thirty eggs from each dietary treatment group were arbi-
trarily selected at 44, 48, 52, 56 and 60 weeks of age to
estimate egg quality parameters. The egg quality parameters in terms of egg shell breaking strength, egg shell thickness, albumen height and Haugh unit were measured. Egg shell breaking strength was measured by egg shell strength tester (QC-SPA shell strength analyzer, TSS, UK) and the maximum force required to crack the shell surface was recorded, and expressed as unit of shell surface area (kg/cm
2). The egg shell thickness was measured from the three different parts of shell
in each egg (air cell, equator and sharp end) after removing the inner shell membrane using a micrometer screw gauge (Digimatic micrometer, series 293- 330, Mitutoyo, Japan) and the mean value was taken as thickness in millimeter. Haugh units were measured automatically by the formula of Haugh (HU = 100 log [(albumen height + 7.57)—(1.7 egg weight
0.37
)])using the multi egg tester (Technical Services and Supplies, TSS, UK) including QCBi digital balance and QCH Table 1. The ingredient and nutrient composition of experimental diets
Items
% of available phosphorus (AP) in the diet
0.20 0.25 0.30
Ingredient (%)
Corn 55.700 55.550 55.400
Wheat HRW 3.820 3.555 3.290
Wheat bran 10.220 10.505 10.790
Soybean meal (48%) 19.370 19.370 19.370
Monocalcium phosphate (Ca 18%, P 21%) 0.630 0.875 1.120
Limestone (Ca 38.5%) 9.660 9.545 9.430
Iodized salt 0.300 0.300 0.300
DL-Methionine (99%) 0.100 0.100 0.100
Vitamin premix 0.100 0.100 0.100
Mineral premix 0.100 0.100 0.100
Total 100 100 100
Calculated nutrient composition
Metabolizable energy (kcal/kg) 2,750 2,750 2,750
Crude protein (%) 16.00 16.00 16.00
Calcium (%) 4.00 4.00 4.00
Total phosphorus (%) 0.59 0.64 0.70
Available phosphorus (%) 0.20 0.25 0.30
Lysine (%) 0.80 0.80 0.80
Methionine (%) 0.36 0.36 0.36
Cysteine (%) 0.29 0.29 0.29
Arginine (%) 0.99 0.99 0.99
1
Vitamin supplement provided per kilogram of diet: vitamin A, 10,000 IU; vitamin D
3, 2,500IU; vitamin E, 20 IU; vitamin B
1, 1.5 mg;
vitamin B
2, 5.0 mg; vitamin B
6, 0.15 mg; vitamin B
1215.0 mg; choline, 300 mg; pantothenate, 12 mg; nicotinic acid, 50 mg; biotin, 0.15 mg; folic acid, 1.5 mg.
2