for Marine Environmental Engineering Vol. 15, No. 1. pp. 38-46, February 2012
38
생물정화기작과 총허용오염부하량을 연계한 마산만의 효율적 해양환경 개선방안
엄기혁1·김귀영1·이원찬2·이대인1,†
1국립수산과학원 해역이용영향평가센터
2국립수산과학원 어장환경과
Effective Costal Environmental Management by Conjugation of Modeling of Bio-Purification and Total Allowable Pollutant
Loads in Masan Bay
Ki-Hyuk Eom1, Gui-Young Kim1, Won-Chan Lee2
and Dae-In Lee
1,†1Marine Environmental Impact Assessment Center, National Fisheries Research & Development Institute, Busan 619-705, Korea
2Marine Environment Research Division, National Fisheries Research & Development Institute, Busan 619-705, Korea
요 약
마산만은 폐쇄성이 강하여 해수유통이 원활하지 못해 소량의 오염물질이 유입되어도 외해로 확산되지 못하고 만내 에 계속 머물게 되어 해역의 오염이 가중되고 있고, 만내에서 증식한 식물플랑크톤과 하천을 통하여 유입된 오염물 질은 해저에 침강되어 분해·무기화를 거쳐 영양염이 다시 수중으로 공급되어 부영양화, 적조, 빈산소 등을 유발하여 생태계 건강도를 악화시키고 있다. 이러한 마산만의 해양환경개선을 위해 해수유동모델(COSMOS)과 생태계모델 (EUTRP2)을 이용하여 환경용량을 산정하고 이매패의 개체군 성장모델을 연계하여 이매패를 포함한 생태계내 물질 순환 구조를 해석하여 이매패의 수질정화 효과를 분석함으로써 비용효과적이고 친환경적인 내만수질개선방안을 도 출하고자 한다. 육상오염원의 효과적인 관리 방안으로 환경용량 산정을 통해 시나리오별 유입부하 삭감에 의한 수 질관리 방안은 유입부하의 50~90%에 해당하는 비현실적인 삭감량이 제시된다. 마산만의 자생 COD를 평가한 결과 총 COD의 30.7%가 외부유입에 의한 COD이고 69.3%가 자생 COD에 의한 것으로 계산되었다. 이는 마산만의 수 질관리에 있어 유기물의 공급원에 대한 제어뿐만 아니라, 자생 COD를 증가시키는 영양염의 유입원에 대한 제어가 필수적이라는 것을 의미한다. 마산만의 자생 COD를 유발하는 영양염류를 제거하기 위해 현재 상황에서 적용가능 한 고도처리 증설의 비용을 산정하여 이매패류에 의한 생물정화 효과와의 경제성을 비교분석해 본 결과 20년 동안 의 총 비용에 있어 질소를 제거하기 위한 질산화탈질법 906억원, 인을 제거하기 위한 화학침전법은 559억, 이매패 류 양식은 461억원으로 산정되어 이매패류 양식은 질소와 인을 같이 제거하는 고도처리 도입에 비해서는 약 1/3의 비용이 소요되는 것으로 나타났다.
Abstract − This study carried out current status, characteristics, and problems of coastal environment man- agement on semi-enclosed Masan Bay in Korea and suggests cost-effective and eco-friendly water quality man- agement policy. The pollutants from terrestrial sources into the Bay have apparently environmental pollution problems, such as eutrophication, red tide, and hypoxia. The carrying capacity of the Bay is estimated by hydro- dynamic model and ecosystem model, material circulation including bivalve in ecosystem is analyzed by the growth model of bivalve. The resulting reduction in the input load was found to be 50~90%, which is unre- alistic. When the efficiency of water quality improvement through bivalve farming was assessed based on the autochthonous COD, 30.7% of the total COD was allochthonous COD and 69.3% was autochthonous COD.
The overall autochthonous COD reduction rate by bivalve aquaculture farm was found to be about 6.7%. This
†Corresponding author: [email protected]
study indicate that bivalve farming is about 31% less expensive than advanced treatment facilities that remove both nitrogen and phosphorous.
Keywords: Water quality management(수질관리) Ecosystem model(생태계모델), Growth model of bivalve(이매패 성장모델), Autochthonous COD(자생COD)
1. INTRODUCTION
The coastal waters of Korea have high bio productivity and are suitable for aquatic farming; therefore, shellfish and sea- weed farming has been prosperous in numerous areas. How- ever, due to rapid urbanization and industrialization since the 1960s, the pollution load of domestic and industrial wastewa- ters into coastal areas has increased (KEI [2002]). In particu- lar, Masan Bay (Fig. 1) is a semi-enclosed bay with a slow current that cannot easily recover from contamination with small quantities of pollutants. The organic and inorganic com- pounds that enter larger systems from rivers and polluted sed- iment are highly concentrated, and the bottom water formed by decomposition/mineralization of organic materials supplies nutrients to the upper layers of water, leading to frequent eutrophication, red tide, and oxygen deficient water mass.
Masan Bay has been designated as a special management
area to effectively manage pollutants from land and a total pol- lutant management system has been activated to achieve grade II seawater quality(chemical oxygen demand(COD) 2 mg/L or less) by 2012. In addition, wastewater treatment plants have been added/expanded, more advanced treatment facilities have been established, and coastal sediments have been dredged for purification to improve water quality. However, constant pop- ulation growth in the region leading to increased pollutants, reclamation projects and other development projects have caused the COD to exceed the standards of grade III(COD 4 mg/L or less). Because many of the measures that have been executed to date are not effective, there should be an effective measure introduced to improve water quality (MOMAF [2000, 2002]).
To improve the coastal environment of Masan Bay, Choi [1993] suggested that it is necessary to reduce pollution loads from land and polluted sediment by more than 60% to solve the oxygen deficient water mass, while Kim et al. [1994] sug- gested the necessity to construct more advanced treatment facili- ties to remove nitrogen and phosphorous from pollution sources from land by more than 95% to control eutrophica- tion(red tide). Nakata et al. [2000] emphasized that it is essen- tial to consider autochthonous COD when managing eutrophication of coastal bays. Most of these assessments were implemented by predicting the effects of reducing pollutants in terms of water quality improvement using eutrophication or ecosystem models that correlate the circulation of seawater and various ecological factors. However, to achieve the predicted effects it is necessary to establish or expand advanced treat- ment facilities(nitrogen and phosphorous removal) that have been initiated by the Korean government under mid-/long-term plans and to install sewerage. This leads to the problem of cost and attainability. A more effective method of water quality improvement would be achieved by considering both policies to reduce the amount of load flowing in from outside and mea- sures to elevate the bay’s capacity for natural purification.
To improve the bay’s purification capacity, it is possible to take a physico-engineering approach to better circulate the sea- water and an eco-engineering approach to use wetlands and biological organisms to remove pollutants. Recently, studies Fig. 1. The location of bivalve culturing ground in the Masan Bay
of Korea in 2005.
have been conducted to evaluate the use of marine organisms such as seaweeds and bivalves for the removal of pollutants, but no studies have been conducted to evaluate the use of marine organisms for water quality improvement in Korea, even though basic studies of the physiological functions of organ- isms for heavy metal and nutrient absorption have been con- ducted (Choi and Kim [2002], Choi and Chae [1998]).
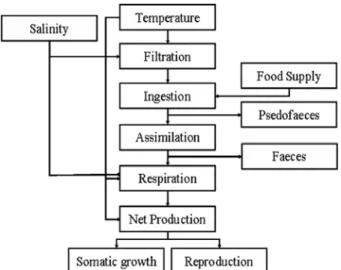
Therefore, this study employed an ecosystem model (Fig. 2) to calculate the total allowable pollutant load (environmental capacity) that can flow into the bay while still satisfying the target water quality. In addition, a physiological and population growth model of bivalves (mussels) was correlated with an ecosystem model to interpret the material circulation structure in the marine ecosystem and analyze the effects of water purification in response to the farming activity of bivalves. Finally a cost-efficient and eco-engineering water quality improvement measure was sug- gested for the bay.
2. MATERIALS AND METHODS
2.1 Estimation of Total Allowable Pollutant Load The total allowable pollutant load describes the limit of the receiving pollutant load for a bay to achieve its target water quality standard. The total allowable pollutant load is an essen- tial indicator of water quality management. This indicator can be found by measuring the current total pollutant load and using a numerical model to predict the water quality that is achieved when the pollutant load is gradually reduced. The eco-hydro- dynamic model used in this study consists of a multi-level model (COSMOS) for hydrodynamic simulation and an eco- system model (EUTRP2) for water quality simulation. The hydro- dynamic model used in this study was a multi-level model developed and the ecosystem model applied the grid model described by Nakata and Taguchi [1982] based on the govern- ing equations of the model developed and applied by Kremer and Nixon [1978]. Anrerior studies explained the characteris- tics and applications of these models in details.
2.2 Conjugation of the Bivalve Growth Model and Ecosys- tem Model
To improve the water quality of the bay, we not only con- trolled the pollutant load, but also assessed the effects of water quality improvement using bivalve. Bivalves have been widely used to monitor and assess contamination of marine environ- ments and are known to have strong resistance to pollution (Smolders et al. [2004]). Kohata et al. [2003] argued that it is necessary to farm bivalves or seaweed to reduce the concentra- tion of nutrients and alleviate oxygen deficiency and red tide, and reported the use of bivalves for removing organic materi- als (phytoplankton). In addition, the relationship between eutroph- ication and bivalves (Scrobiculariaplana) was reported by forming seagrass in the Mondego Estuary in Portugal (Verdel- hos et al. [2005]).
Bivalves filter-feed on phytoplankton in seawater, and the biodeposits they release through biological metabolism settle into the sediments or supply remineralized nutrients to seawa- ter, thereby influencing the nutrient and energy cycles in the ecosystem (Boyton et al. [1980]). Accordingly, bivalves play a very important role in the maritime ecosystem of coastal areas (Dame [1996]).
Because the structure and function of coastal ecosystem are closely related to farming organisms, it is necessary to develop a model that can assess the growth of farming organisms accord- ing to environmental variables (water temperature, concentra- Fig. 2. The schematic diagram of an ecosystem model for biological
coastal water purification.
tion of feed, food supply, etc.), the influence of farming organisms on marine ecosystem, and the changes in marine environment in response to the metabolic activities of the farming organ- isms (Heral [1993]). To understand the correlation between the growth of bivalves and their environment to enable their use to improve water quality, it is necessary to correlate the growth model of bivalves (Fig. 3) with the ecosystem model. The growth model of bivalves established by converting the physi- ological process of bivalves into a numerical formula was cor- related with the ecosystem model to suggest the material’s
cycle in the marine ecosystem (Fig. 4), and these findings were then used to predict and assess the standing stocks of each component.
3. RESULTS AND DISCUSSION
3.1 Applicability of Ecosystem Model
To verify the results of the hydrodynamic model, the tidal ellipse currents were reproduced for summer and then compared to the observed values (NFRDI [2006]). The results revealed that the velocity and direction of the currents were relatively similar. In addition, the relative errors between the simulated and observed values of the water quality factors were 7% for COD, 11% for dissolved inorganic nitrogen (DIN), and 7% for dissolved inorganic phosphorous (DIP), indicating that the model adequately reproduced Masan Bay’s water quality during sum- mer (Fig. 5).
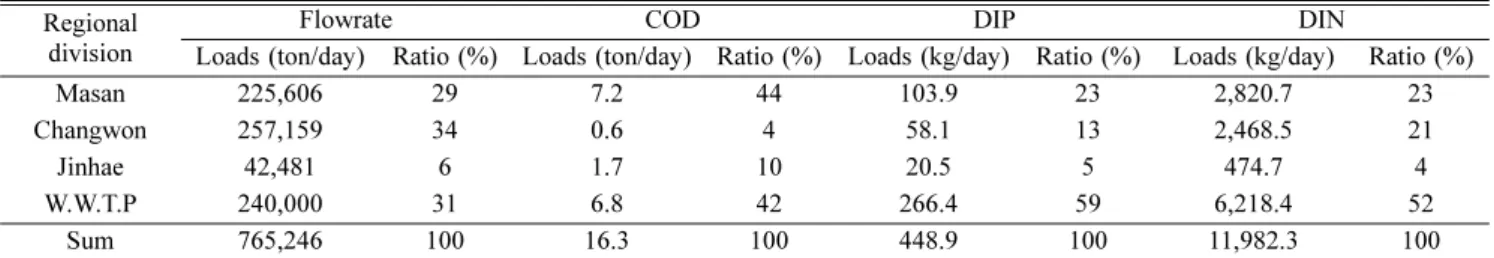
3.2 Seawater Quality and Pollutant Loads in Masan Bay To evaluate the pollutant loads from land, the discharge and pollutant concentrations from 16 rivers that flow into Masan Fig. 3. The schematic diagram of the bivalve physiology model.
Fig. 4. The schematic diagram for the cycle of nutrients (C, N and P) in the bivalve culture ecosystem.
Fig. 5. Comparison of tidal current ellipses and water quality between observed and computed result.
Bay and the discharge from the Deok-dong Wastewater Treat- ment Plant were calculated (Table 1). The concentration of dis- solved oxygen (DO), COD, total nitrogen (TN), and total phosphorous (TP) were relatively higher than those of other coastal regions by National Marine Environment Monitoring System (NFRDI [2006]). Specifically, the COD indicated that the water quality was below grade III. In addition, more than 88% of the overall datas exceeded grade III, indicating that the water quality in Masan Bay was degenerated (Fig. 6).
The water quality of Masan Bay worsens in summer and recovers in winter. In addition, the water quality is significantly influenced by land, being closer to the inner bay. Oxygen defi- cient water mass generally occurs during summer in coastal areas subject to eutrophication in areas in which water flow is stag- nant and the thermocline increases.
3.3 Estimation of Total Allowable Pollutant Load (Environ- mental Capacity)
The water quality of Masan Bay is influenced by various fac- tors, including pollutant load from land, discharge from wastewater treatment plants, pollutant load of sediments, and non-point source pollutants; therefore, water quality cannot be improved
by reducing a specific source. Among the nutrients, phospho- rous is closely related to changes in organic materials that affect phytoplankton growth or COD. Therefore, in the case of Masan Bay, treatment to remove phosphorous would be a more efficient method of improving water quality.
As shown in Table 2, the pollutant load reduction scenario for each pollution source in Masan Bay involved numerical experiments based on reduction of loads from rivers, wastewa- ter treatment plants, and nutrients in sediments. Examining the results of water quality prediction according to Scenario I, the COD inside Myodo Island of Masan Bay was greater than 2 mg/L, indicating that it is difficult to achieve grade II water quality.
Based on the water quality obtained according to Scenario II, there was a location inside Masan Bay in which the COD was greater than 2 mg/L. According to Scenario III, the COD was between 1.0 and 1.5 mg/L and was suitable for achieving grade II water quality (Fig. 7).
3.4 Removal of Autochthonous COD by Bivalve Aquatic Farming
It is important to consider the location of the farm and num- ber of biological organisms in the region when deriving design factors to improve the water quality using bio-purification by bivalves. In terms of location selection, it is necessary to con- sider the limitations to determine whether a location is feasible or not when determining the optimum location. For the num- ber of biological organisms, the density of organisms in a unit Table 1. The pollutant loads from land-based pollution sources (three regions and Duckdong wasterwater treatment plant) for water quality modeling in 2005
Regional division
Flowrate COD DIP DIN
Loads (ton/day) Ratio (%) Loads (ton/day) Ratio (%) Loads (kg/day) Ratio (%) Loads (kg/day) Ratio (%)
Masan 225,606 29 7.2 44 103.9 23 2,820.7 23
Changwon 257,159 34 0.6 4 58.1 13 2,468.5 21
Jinhae 42,481 6 1.7 10 20.5 5 474.7 4
W.W.T.P 240,000 31 6.8 42 266.4 59 6,218.4 52
Sum 765,246 100 16.3 100 448.9 100 11,982.3 100
Fig. 6. Relative frequency of COD in 2005 (top: Masan bay, bottom:
The other coasts in Korea).
Table 2. The scenarios of pollutant reduction for water quality improvement Scenario Substances River W.W.T.P Sediment
I
COD DIP DIN
50%
50%
10%
50%
50%
10%
- - -
II
COD DIP DIN
50%
50%
10%
50%
50%
10%
- 30%
10%
III
COD DIP DIN
90%
80%
30%
60%
60%
30%
- 60%
20%
of volume (m3) should be considered first, after which the area, which is a critical factor influencing the cost of building a farm, should be considered.
When selecting a location for seawater purification using bivalves, the point at which large amounts of organic materials flow in from the land must be considered. This is because puri- fication is more effective when it is conducted closer to the point at which rivers flow into the sea and wastewater or sew- age is discharged. Moreover, the inside of a bay in which phy- toplankton frequently bloom or where hydrodynamic conditions are stable are preferable. Limitations would include sailing routes and areas restricted for military purposes.
Assessment of how materials were clustered or dispersed through physical influences, such as advection or diffusion, based on the ratio of physical processes affecting the standing stock of phytoplankton revealed the optimal location to insert bivalves (Fig. 8). In addition, the optimum density, considering the stan- dard design guide for bivalve hanging aquaculture facilities (NFRDI [1996]) was found to be 35 ind./m3. The optimal area was about 500 ha. Based on these results, improvements in the water quality in Masan Bay in response to treatment with bivalves were estimated.
The COD value measured in a given coastal area can be expressed by the sum of allochthonous COD (physical diffusion part) from the land and autochthonous COD produced internally (Straskrabova [1993]). Phytoplankton formed by internal pro- duction not only become organic materials that consume oxy- gen, but also increase the zooplankton and dissolved organic
materials through extracellular excretion of organic materials (poly saccharide), which increases the COD concentration.
Therefore, when determining the COD concentration, which expresses the degree of organic pollution caused by sewage and wastewater, it is necessary to quantitatively assess the con- tribution of autochthonous COD and allochthonous COD to total COD to establish water quality management plans accord- ingly (Morioka [1980]).
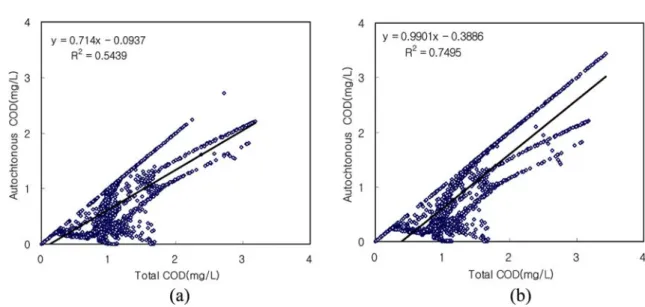
The relationship between total COD and autochthonous COD based on modeling is shown in Fig. 9. When autochtho- nous COD is defined as total COD minus allochthonous COD Fig. 7. Horizontal distributions of COD (top) and Chl. a(bottom)in the Masan bay from scenarios.
Fig. 8. The optimal culture site in Masan Bay.
without any biochemical process, a linear regression formula is expressed:
Autochthonous COD = -0.39 + 0.99 × Total COD (1)
In addition, the linear zones in (a) and (b) indicate that autochth- onous COD accounts for most of the total COD. According to the calculations, 30.7% of the total COD was physically dif- fused and 69.3% was autochthonous COD. These findings indicate that, in order to reduce the total COD for managing the water quality of Masan Bay, it is essential to control the sources of organic materials as well as the sources of nutrients that increase the autochthonous COD.
The spatial distribution of autochthonous COD and total COD is shown in Fig. 10. For the reproduced value of total COD (a), the values of allochthonous COD were assorted into the value without the bivalve farm (b) and with the bivalve farm (c). The spatial distribution of autochthonous COD was also classified into without the bivalve farm (d) and with the bivalve farm (e).
The inside of Masan Bay, which is adjacent to the source of the external load, has the smallest advection/diffusion COD, and autochthonous COD by algal growth accounts for most of the COD value. The spatial distribution (e) of autoch- thonous COD after introducing bivalves clearly shows that autochthonous COD value inside Masan Bay decreased sig- nificantly when compared to without the bivalve farm. The overall autochthonous COD reduction rate was found to be about 6.7%.
Fig. 9. Correlation of Total COD and Autochthonous COD (a: in 0 Bivalve case, b: optimal case).
Fig. 10. Total COD(a), Allochthonous COD (b: in 0 Bivalve case, c: optimal case) and Autochthonous COD (d: in 0 Bivalve case, e:
optimal case).
3.5 Comparative Analysis of the Cost of the Bivalve Farm and Advanced Treatment Plant Expansion for Autochth- onous COD Removal
Wastewater treatment plants in Korea primarily adopt the active sludge method to remove organic materials. As a result, closed bays that receive treated waters can become eutrophic because nitrogen and phosphorous are not removed. Accord- ingly, Korea added nitrogen and phosphorous to the allowable discharge standards and water quality standards in 1998 to reg- ulate nutrients. As a result, many wastewater treatment plants are attempting to introduce advanced treatment facilities that treat nitrogen and phosphorous; however, economic limita- tions have been an issue.
In this study, adding advanced treatment facilities to Deok- dong Wastewater Treatment Plant to eliminate nitrogen and phosphorous and using bio-purification with bivalves were compared in terms of cost for the purpose of removing nutri- ents that cause autochthonous COD in Masan Bay. Because bivalve farming is independently established and operated by fishery farmers, there is almost no specific data on cost. There- fore, the 2001~2002 Jinju Mussel Preservation Demonstrative Project (MOMAF [2003]) was used and the cost of equipment such as hanging lines, floaters, piles, rafts, anchors (ropes), and seeds, as well as the cost of labor, gas, ships, maintenance, operations, and management were calculated. When KRW 8,000,000/ha was applied as the cost of equipment to establish and operate a farm spanning the optimal area of 500 ha, the total cost of equipment is KRW 4 billion. However, naturally damaged equipment must be replaced every three years as required by domestic law to ensure stable production and envi- ronmental preservation. The cost of removal is increased when replacing this equipment. To calculate the cost of removal based on the consumer market value of 2009, the cost of removal was KRW 4,750,000/ha. For a farm spanning 500 ha, the cost was KRW 2.3 billion, but because replacement is conducted every 3 years, the cost of operation and maintenance per year was about KRW 0.1 billion.
The cost analysis presented in Table 3 shows the cost of bivalve farming for 20 years and the cost of nitrogen removal and phosphorous removal. The cost of nitrification/denitrifica- tion for removing nitrogen through the advanced treatment pro- cess employed by Deok-dong Wastewater Treatment Plant was KRW 90.6 billion and the cost of chemical sedimentation for removing phosphorous was KRW 55.9 billion. The total cost was KRW 46.1 billion, including the cost of installing (4 bil- lion × 7 times = KRW 28 billion) and maintenance (0.1 billion/
year × 20 years = KRW 2 billion) the bivalve farm and the cost of demolition (2.3 billion × 7 times = KRW 16.1 billion). There- fore, these findings indicate that the cost of bivalve farming was about 1/3 of the cost of advanced treatment for the removal of both nitrogen and phosphorous.
To calculate the cost of water quality improvement in Masan Bay, it is necessary to include the cost of collecting the loads from all sources, including non-point sources, and installing and maintaining sewerage to transport all loads for treatment.
However, this process is still being planned by the govern- ment; therefore, it is difficult to tabulate the cost. The current study calculated the cost of expanding advanced treatment facilities that are currently applicable to analyze their eco- nomic value in comparison to the effects of bio-purification by bivalves. If bio-purification using seaweeds or bivalves is applied along with point pollution source management through the instal- lation of sewerage and wastewater treatment and total quantity management along the coast for non-point pollution source management, it will be possible to establish an eco-friendly and sustainable water quality improvement for Masan Bay.
4. CONCLUSIONS
The water quality of Masan Bay is affected by various fac- tors, including pollutant load from land and polluted sediment, discharge from wastewater treatment plants, and non-point source pollutants; therefore, water quality cannot be improved only by reducing a specific pollution source. When the total allowable pollutant loads (environmental capacity) were calcu- lated to reduce input loads for each scenario of water quality improvement, the resulting reduction in the input load was found to be 50~90%, which is unrealistic.
When the efficiency of water quality improvement through bivalve farming was assessed based on the autochthonous COD, 30.7% of the total COD was allochthonous COD and 69.3% was autochthonous COD when all conditions of growth were met. These findings indicate that it is essential to control Table 3. Cost analysis results over a 20-year for water quality improvement
Alternative
Construc- tion Cost (Billion
Won)
Operation& maintenance Cost (Billion
Won)
Total Cost (Billion
Won) Denitrification and nitrification 50.7 39.9 90.6 Chemical precipitation 6.1 49.8 55.9
Bivalve farm 28.0 2.0 30.0
Withdrawal 16.1
the sources of organic materials as well as the sources of nutri- ents that increase autochthonous COD to manage the water quality of Masan Bay. The overall autochthonous COD reduc- tion rate by bivalves farming was found to be about 6.7%.
Estimating the cost of expanding advanced treatment facili- ties that are currently available to remove nutrients that cause autochthonous COD and comparing these costs to the effects of bio-purification by bivalves revealed that the cost of nitrifica- tion/denitrification for 20 years was KRW 90.6 billion, the cost of chemical sedimentation for removing phosphorous was KRW 55.9 billion, and the cost of bivalve farming was only KRW 46.1 billion. Overall, this study indicate that bivalve farming is about 31% less expensive than advanced treatment facilities that remove both nitrogen and phosphorous.
ACKNOWLEDGMENT
This work is funded by a grant from the National Fisheries Research and Development Institute (RP-2012-ME-03).
REFERENCES
[1] Boyton, W.R., Kemp, W.M. and Osbourne, C.G., 1980, Nutrient fluxes across the sediment-water interface in the turbid zone of a coastal plain estuary, In : V. S. kennedy (Ed.), Estuarine Per- spectives, Academic Press, New York, 93-109.
[2] Choi, H.Y. and Chae, J.W., 1998, Analysis on the characteristics of the pollutant load in Chinhae-Masan Bay, 10, 132-140.
[3] Choi, T.S. and Kim, K.Y., 2002, Time-dependent Variation of Growth and Nutrient Uptake of Ulva pertusa Kjellman (Chlo- rophyta) from Intertidal Eelgrass Beds, Journal of Korean Soci- ety of Coastal and Ocean Engineers, 17, 249-257.
[4] Choi, W.J., 1993, Numerical simulation of oxygen deficient water mass in Jinhae Bay, A thesis for a doctorate of national fisheries university in Busan.
[5] Dame, R.F., 1996, Ecology of marine bivalves, an Ecosystem Approach, CRC press, Boca Raton, FL, USA, 254.
[6] Heral, M., 1993, Why carring capacity models are useful tools for management of bivalve molluscs culture, Bivalve filter feeders in estuarine and coastal ecosstem processes, NATO ASI series, 33, 455-478.
[7] KEI (Korea Environment Policy Institute), 2002, Study on the improvement of ingetrative environment management system.
[8] Kim, J.G., Park, C.G. and Kim, G.S., 1994, The application of
ecosystem model for the eutrophication control in Masan Bay in summer, Journal of Environmental Sciences, 9, 185-195.
[9] Kohata, K., Hiwatari, T. and Hagiwara, T., 2003, Natural water purification system observed in a shallow coastal lagoon: Mat- sukawa-ura, Japan. Journal of Marine Pollution Bulletin, 47, 148-154.
[10] Kremer, J. and Nixon, S.W., 1978, A coastal marine ecosystem.
Simulation and analysis, springer-verlag, 16.
[11] MOMAF (Ministry of Maritime Affairs & Fisheries), 2000, Dredg- ing status of Pollution area in Korea, and policy.
[12] MOMAF (Ministry of Maritime Affairs & Fisheries), 2002, Study on the environment improvement of special management area.
[13] MOMAF (Ministry of Maritime Affairs & Fisheries), 2003, Jinju Mussel Preservation Demonstrative Project Report.
[14] Morioka, T., 1980, Application of ecoogical dynamics for eutroph- ication control in Kobe Harbour area, Water Technology, 12, 445-458.
[15] Nakata, K. and Taguchi, K., 1982, Numerical simulation of eutroph- ication process in coastal bay by eco-hydrodynamic model, (2) Ecological modeling. Bulletin of the National Research Institute for Pollution and Resources, 12, 17-36.
[16] Nakata, K., Horiguchi, A. and Yamamuro, M., 2000, Model study of lakes Shinji and Nakaumi - a coupled coastal lagoon sys- tem, Journal of Marine System, 26, 145-169.
[17] NFRDI (National Fisheries & Research Development Instutute), 1996, Standard design guide for bivalve hanging aquaculture facilities, 27.
[18] NFRDI (National Fisheries & Research Development Instutute), 2006, Report of National Marine Environment Monitoring Sys- tem(‘01-’05).
[19] Smolders, R., Bervoet, L. and Blust, R., 2004, In situ and lab- oratory bioassays to evaluate the impact of effluent discharges on receiving aquatic ecosystems. Journal of Environmental Pol- lution, 132, 231-243.
[20] Straskrabova, V., Komarkova, J. and Vyhnalek, V., 1993, Deg- radation of organic substances in reservoirs, Water Science Tech- nogoly, 28, 95-104.
[21] Verdelhos, T., Neto, J.M., Marques, J.C. and Pardal, M.A., 2005, The effect of eutrophication abatement on the bivalve Scrobicularia plana, Journal of Estuarine, Coastal and Shelf Sci- ence, 63, 261-68.
2012년 1월 2일 원고접수 2012년 1월 13일 심사수정일자 2012년 1월 17일 게재확정일자