- 2101 -
P-V Characteristics of Photovoltaic According to the Irradiation
Ying Lee1, Yong-Sung Choi1, You-Sai Zhang2
, Jong-Sun Hwang 3
, and Kyung-Sup Lee 1 Department of Electrical Engineering, Dongshin University1
Institution of Electronic and Information, Jiangsu University of Science and Technology 2 Jeonnam Provincial college
3
Abstract - Solar energy has inestimable development potential.
However, it is an extreme intermittent and inconstant energy source.
The radiative energy output from the sun derives from a nuclear fusion reaction. So it is necessary to study the photovoltaic P-V characteristics according to the irradiation. The results show that the DC power of the photovoltaic system is increased along with the increasing values of irradiation and module.
1. Introduction
Photovoltaic has very vital significance to construct the resource conservation and the environment-friendly society, and to realize the sustainable development of economic society. However, because solar energy is an extreme intermittent and inconstant energy source, the electric power generated by the PV panel varies with the solar radiation. In order to improve the photovoltaic system efficiency and utilize the solar energy more fully, it is necessary to study the photovoltaic P-V characteristics according to irradiation[1~3].
2. Experiment
The experimental solar array consists of 8EA modules which are made in single crystal silicon. The efficiency of the module is 16[%].
The specifications of the experimental device are as follows. The device rated power is 800[W], the maximum power PMPP is 100+
Wp±5[%], the voltage at MPP (maximum power point) is 34.5[V], the current at MPP is 2.90[A], the open-circuit voltage is 42.5[V], the short-circuit current Isc is 3.20[A]. The measured data of this paper include DC current[A], module temperature.
3. Result and Discussion
Fig. 1 presents the P-V characteristics according to the irradiation which is from 100[W/m2] to 800[W/m2]. Fig. 1 (a) shows the P-V characteristics according to the irradiation of 100[W/m2]. In this case, along with the increase of DC voltage from 225[V] to 267[V], the value of module temperature declines from 32[℃] to 19[℃].
Fig. 1 (b) shows the P-V characteristics according to the irradiation of 200[W/m2]. In this case, along with the increase of DC voltage from 247[V] to 279[V], the value of module temperature declines from 38[℃] to 21[℃].
Fig. 1 (c) shows the P-V characteristics according to the irradiation of 300[W/m2]. In this case, along with the increase of DC voltage from 264[V] to 291[V], the value of module temperature declines from 32[℃] to 14[℃].
Fig. 1 (d) shows the P-V characteristics according to the irradiation of 400[W/m2]. In this case, along with the increase of DC voltage from 263[V] to 296[V], the value of module temperature declines from 38[℃] to 12[℃].
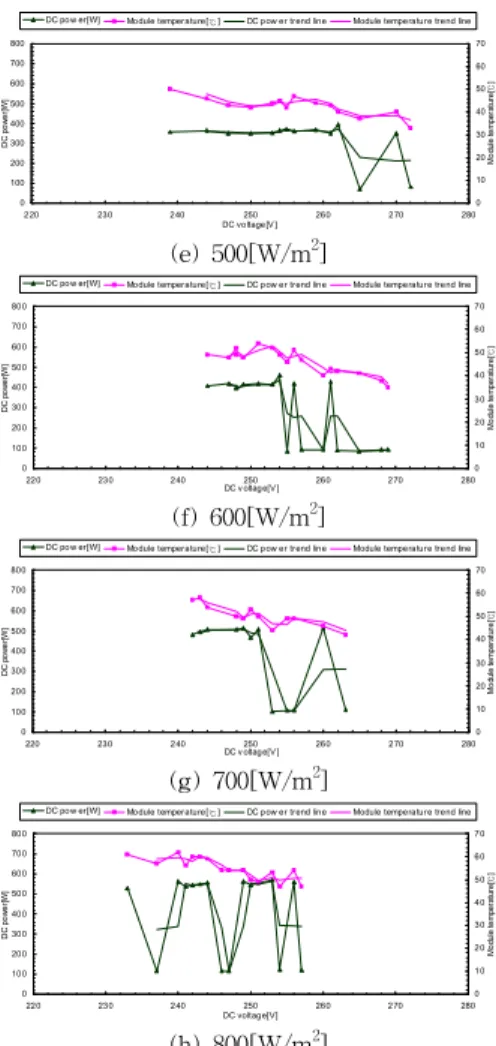
Fig. 1 (e) shows the P-V characteristics according to the irradiation of 500[W/m2]. In this case, along with the increase of DC voltage from 257[V] to 292[V], the value of module temperature declines from 43[℃] to 12[℃].
Fig. 1 (f) shows the P-V characteristics according to the irradiation
of 600[W/m2]. In this case, along with the increase of DC voltage from 252[V] to 291[V], the value of module temperature declines from 43[℃] to 17[℃].
Fig. 1 (g) shows the P-V characteristics according to the irradiation of 700[W/m2]. In this case, along with the increase of DC voltage from 250[V] to 284[V], the value of module temperature declines from 53[℃] to 20[℃].
Fig. 1 (h) shows the P-V characteristics according to the irradiation of 800[W/m2]. In this case, along with the increase of DC voltage from 242[V] to 277[V], the value of module temperature declines from 47[℃] to 27[℃].
Fig. 1 shows that when the irradiation increases, the DC power increases. That is, there is positive correlation between the PV DC power and the irradiation.
0 100 200 300 400 500 600 700 800
220 230 240 250 260 270 280
DC v oltage[V ]
DC power[W]
0 10 20 30 40 50 60 70
Module temperature[℃]
DC pow er[W] Module temperature[℃ ] DC pow er trend line Module temperature trend line
(a) 100[W/m2]
0 100 200 300 400 500 600 700 800
220 230 240 250 260 270 280
DC v oltage[V ]
DC power[W]
0 10 20 30 40 50 60 70
Module temperature[℃]
DC pow er[W] Module temperature[℃ ] DC pow er trend line Module temperature trend line
(b) 200[W/m2]
0 100 200 300 400 500 600 700 800
220 230 240 250 260 270 280
DC voltage[V]
DC power[W]
0 10 20 30 40 50 60 70
Module temperature[℃]
DC pow er[W] Module temperature[℃ ] DC pow er trend line Module temperature trend line
(c) 300[W/m2]
0 100 200 300 400 500 600 700 800
220 230 240 250 260 270 280
DC v oltage[V ]
DC power[W]
0 10 20 30 40 50 60 70
Module temperature[℃]
DC pow er[W] Module temperature[℃ ] DC pow er trend line Module temperature trend line
(d) 400[W/m2]
2009년도 대한전기학회 하계학술대회 논문집 2009. 7. 14 - 17
- 2102 -
0 100 200 300 400 500 600 700 800
220 230 240 250 260 270 280
DC voltage[V ]
DC power[W]
0 10 20 30 40 50 60 70
Module temperature[℃]
DC pow er[W] Module temperature[℃ ] DC pow er trend line Module temperature trend line
(e) 500[W/m2]
0 100 200 300 400 500 600 700 800
220 230 240 250 260 270 280
DC v oltage[V ]
DC power[W]
0 10 20 30 40 50 60 70
Module temperature[℃]
DC pow er[W] Module temperature[℃ ] DC pow er trend line Module temperature trend line
(f) 600[W/m2]
0 100 200 300 400 500 600 700 800
220 230 240 250 260 270 280
DC v oltage[V ]
DC power[W]
0 10 20 30 40 50 60 70
Module temperature[℃]
DC pow er[W] Module temperature[℃ ] DC pow er trend line Module temperature trend line
(g) 700[W/m2]
0 100 200 300 400 500 600 700 800
220 230 240 250 260 270 280
DC voltage[V]
DC power[W]
0 10 20 30 40 50 60 70
Module temperature[℃]
DC pow er[W] Module temperature[℃ ] DC pow er trend line Module temperature trend line
(h) 800[W/m2]
Fig. 1 P-V characteristics according to irradiation
4. Conclusion
The objective of this paper is to analyze the photovoltaic P-V characteristics according to irradiation which is from 100[W/m2] to 800[W/m2]. It indicates that when the irradiation increases, DC power increased. So it can be obtained that increasing the irradiation is available method to increase the PV output power, furthermore, increase the efficiency of PV system.
[References]
[1] Gi-Hyeok Gang, Yun-Seong Kim, Nguyen Khanh Loc, Dong-Jun Won, “Operation of Photovoltaic Generation System with Battery and Electrolyzer,” Trans. KIEE. Vol.57, No.11, NOV, pp.1994-2000 (2008).
[2] John Wiley, “Physics of Semiconductor Devices,” pp.791 (1981).
[3] Jin-Seok Oh, Mark Spatt, Yun-Hae Kim, Sang-Tae Lee, Seung-Hwan Jun, Byeong-Deok Yea, Yoon-Sik Kim and Ji-Young Lee, “Operating Performances of PV Energy Generation System with MPPT,” Journal of the Korean Society of Marine Engineers, Vol.27, pp.479-486 (2003).