Journal of Internet Computing and Services(JICS) 2016. Oct.: 17(5): 131-139 131
Predicting the popularity of TV-show through text mining of tweets: A Drama Case in South
Korea ☆
Do Yeon Kim
1Yoosin Kim
2Sang Hyun Choi
2**ABSTRACT
This paper presents a workflow validation method for data-intensive graphical workflow models using real-time workflow tracing mode on data-intensiveworkflow designer. In order to model and validate workflows, we try to divide as modes have editable mode and tracingmode on data-intensiveworkflow designer. We could design data-intensive workflow using drag and drop in editable-mode, otherwise we could not design but view and trace workflow model in tracing mode. We would like to focus on tracing-mode for workflow validation, and describe how to use workflow tracing on data-intensive workflow model designer. Especially, it is support data centered operation about control logics and exchange variables on workflow runtime for workflow tracing.
☞
keyword : Data-Intensive Workflow Validation, Workflow, BPM1. Introduction
Many changes took place in the interaction surrounding the TV due to the recent emergence and spread of the Internet and SNS, Social Network Service. In the past family members communicated with one another while watching a TV program and nowadays families are used to share their feelings in the Internet space and SNS [1]. SNS has recently emerged as a new means to community members to communicate freely. SNS has an important role in the formation of the discourse to a TV program. Therefore paying attention to communicating data such as SNS is used to discover new values. Most of the current data is increasing exponentially, which is usually unstructured text. Media users created through social media such as Twitter and Facebook. Characterized by a high proximity and simplicity, Twitter has the retweet function of transmitting a tweet bounded to 140 characters of the message. It is possible to diffuse the information via a one-way relationship, and has
1
Department of Information Security Management, Chungbuk National University, Korea
2
Department of Management Information System, BK21+ BSO, Chungbuk National University, Korea
*
Corresponding author ([email protected])
[Received 9 May 2016, Reviewed 26 May 2016, Accepted 31 July 2016]
☆ A preliminary version of this paper was presented at ICONI 2015 and was selected as an outstanding paper.
the advantage of being able to recognize events that are happening in the real world in real time.
Likewise, local media industry needs to make use of big data. Mostly, TV drama series are produced not in advance (i.e. entire production is completed before a show is aired) but in tandem with the organized timeline for each episode. AMR (average minute rating) as a viewer rating data is a quantitative measure with which investors can evaluate the effectiveness of TV programs they invest their capital in. Korean wave called Hanryu, including K-pop and TV soap operas have been spreading globally. At the same time, devices and platforms used for enjoying media contents have been evolving. In this context, an analysis system to evaluate strategies for reducing investors’ risks and maximizing marketing effects would need to be introduced to facilitate the production of qualified cultural contents. This study aims to predict the effects of independent variables through a multiple regression analysis of the quantity of Twitter message data, or the number of mentioned keywords.
Target variables are AMR and SHR representing viewer ratings in the media industry. We identify correlation between data quantities and viewing rates by matching the quantity of Twitter message data about the episode aired on a given day relative to the AMR and SHR of the next episode. The relation information would be significantly helpful for broadcasters to make or change marketing strategies responsively.
ISSN 2287-1136 (Online)
http://www.jksii.or.kr
2. THEORETICAL BACKGROUND
2.1 TWITTER CONCEPTS AND FEATURES Twitter is a micro-blog and mini-blog that was developed in the United States of Jack Dorsey, Evan Williams, BizStone such as jointly in 2006. San Francisco venture company Obvious was first opened. The Twitter is an online open space which messages can be delivered in the light speed. The number of characters that can be written at one time is limited to a maximum of 140 characters. In the disaster or crisis situation, it has played the role of rapid media and can be used as a tool of personal publicity or public relations company due to the huge disseminative property [2].
When they have smartphones, mobile users can freely communicate without being bound by location. As you can send and receive information in real time, there is a large spreading power. Comparing the characteristics of the Twitter with existing social network is shown at <Table 1>.
(Table 1) Twitter and existing social networking services [3]
Item Twitter Facebook/
My Space Portal site Information
type Text Picture,
Text Picture, Text Information
Characteristics
Simple, Personal
Complexity, Personal
Complexity, some professional
Device range
Web Mobile Instant Message
Web Some Mobile Extensions
Web
Way relationship
Following One-way
Invitation
-Allowed Sign-Approval
Information
spreading rate Very fast Fast
Primarily spread inside
the Community
Business Model
No business
model
Banner advertising
revenue and paid applications
Banner advertising
revenue
2.2 LITERATURE REVIEWS ON SOCIAL MEDIA AND TV WATCHING
Social media refer to platforms where users of SNS (social networking services) such as Twitter and Facebook share information and comments, broadening their relational networks (Communication Books, Feb. 05, 2013). According to a study on variables affecting the AMR or SHR of a local TV drama series based on data collected from social media including Twitter, Me2day and Daum Yozm [4], local SNS better indicated the AMR of the local TV drama series. Lee (2013) explored the word-of-mouth (WOM) effects on TV soap operas, analyzing the word-of-mouth activities arising in the course of Twitter communication [5]. In short, messages on such key components as plots, themes and materials were found to spread most actively, suggesting consumers’ WOM information served as a determinant in their choice of a TV drama series. Also, no significant difference was found in the word of mouth on Twitter over time, whereas differences were found in word-of-mouth acts and diffusion activities between on the day a show was aired and on the days following.
Investigating the relationship between TV programs’ AMR and Twitter buzz, Lee (2014) found Twitter buzz and AMR were temporally accompanying variables, and their relationships varied with program genres [6]. Bai & Choi (2013) reported that active SNS interactions about TV programs occur before, during and after the programs being aired [7]. Interactions happening before TV programs being aired were mainly about sharing information about and watching such programs.
Interactions on SNS while TV programs being aired resulted from a desire to watch TV with others and maximize the pleasure. Interactions occurring after TV programs were aired included opinions, ratings and reviews, and formed diverse discourses on given programs. Lee & Jung (2014) extracted topic key words representing Tweet context to reveal which filmic properties reflect the interest of the audience. By analyzing the reaction of those properties by the audience, they suggested factors that influenced box-office hits of movies [8].
Kim et al (2012) used Core-Topic-based Clustering to analyze tweets of particular dramas and extracted significant topics [9].
(Ni et al, 2011) extracted core words from Twitter to suggest
movie contexts frequently referred by users and clustered similar
tweets following topics [10].
(Figure 1) Analysis process 2.3 LITERATURE REVIEWS ON ONLINE
WORD OF MOUTH AND SOCIAL IMPACT Online word of mouth refers to the word which is spreading via online users’ postings (Nilsen KoreanClick). With the advent of social media, WOM (word-of-mouth) marketing has become highly sought out. As a means of communication where consumers informally share positive or negative information about certain matters based on direct or indirect personal experiences [11], WOM communication often takes place between family members or close friends with strong ties. Over recent years, the rising influence of SNS has highlighted the importance of and attention to the word of mouth [12]. In light of the conformity phenomenon most frequently cited in socio- psychology referring to social influence, the more a WOM message, the stronger the tendency to conform to the message [13].
Meanwhile, as a determinant of a film’s box-office hit, the effects of total online WOM have drawn much attention [14].
The frequency of online WOM of a film was found to have significant effects on its box-office performance. Particularly, online WOM exerted substantial effects in the first to second weeks of a film’s release. Verifying the effects of online WOM on box-office performance of 68 local films released in 2010,
Park & Song (2012) compared the influence of online WOM with that of the previously verified traditional factors including production cost, genre, star power, rating, distributor power, number of screens and critics’ opinions, and found the effects of online WOM, or frequency of netizens’ reviews and comments came second after the number of screens [15].
Differently put, buyers tend to rely on the information of others’
experiences in order to lessen the perceived risks and uncertainties in making decisions on buying things in the absence of their direct experiences.
3. RESEARCH METHOD
3.1 ANALYSIS PROCESS
The present study tests hypotheses by comparatively analyzing the Nielsen Korean Click’s data concerning content-related Twitter and the AMR
and SHR data from AGB Nielsen Media Research, the
world’s best AMR research firm operating in 46 countries, or
76% of global market. The detail analysis process is shown
at Figure 1.
3.2 EXPERIMENTAL DATA (CONTENT & DATA)
3.2.1 Content
As shown at Table 2, “My Love from the Star” is a TV drama series consisting of 21 episodes aired on SBS from December 18, 2013 to February 27, 2014. It is an SF romance soap opera based on a story of an unidentified flying object witnessed in Gangwondo on September 22, 1609 as recorded in king Gwanghaigun’s diary documented in the Annals of the Chosun Dynasty (Newsjelly, Feb. 09, 2014).
(Table 2) Analyzed Content
Item Details
Content My Love from the Star (21 episodes) Channel SBS
Timeline Wednesday and Thursday nights (10 p.m.) Period Dec. 18, 2013 ~ Feb. 27, 2014
Writer Park Ji-eun
Cast Jeon Ji-hyoen, Ki Soo-hyeon, Park Hai-jin, Shin Seong-lok, Yu In-na, etc.
3.2.2 AMR and SHR data
The AMR (Average Minute Rating) and SHR (Share Rating) data from AGB Nielson Research were used as shown at Table 3. The trends of AMR and SHR for each episode of “My Love from the Star” are as in Figure 2.
(Table 3) Scope of Data Yielded
Item Details
Content AMR (Average Minute Rating) and SHR (Share Rating)
Target Households nationwide Period 18/12/2013 ~ 27/02/2014
AMR Households watching a certain channel out of all households having TV sets SHR Households watching a certain channel
out of all households watching TV
For the duration of analyzing “My Love from the Star”, its AMR and SHR were 26.1% and 39% on average, respectively.
Excluding the AMR and SHR on January 8, 2014 (Ep.7) slightly
lower by 1% and 1.5%, respectively, than those for episodes 1 to 6, overall AMR and SHR data showed upward trends.
The last episode recorded the highest AMR (27%) and SHR (40.1%). Due to the cancellation on January 30, 2014 (Ep.14), the AMR and SHR for Thursdays were excluded.
(Figure 2) AMR and SHR data trend circled by a week
3.2.3 Twitter message data
For the purpose of this study, online buzzword data were collected by Nilsen Korean Click, 21 episodes of the TV soap opera “My Love from the Star” were selected as the content for analysis. Twitter data generated for 91 days (December 2, 2013 ~ March 2, 2014) were investigated. Postings mentioning the title were extracted, whereas those not mentioning the title were excluded. Tweets at Table 4 were collected a total of 250,435 tweet. Duplicate content and retweets are removed and analyzed for 117,012 tweet.
(Table 4) Scope of Data Yielded
Item Detail
Target Twitter
Condition
My Love from the Star, You Who Came from the Stars, MLS (My Love from the Star),
#My Love from the Star, #MLS
→ The title must be mentioned.
Amount 250,435
Period 00:00:00 02/12/2013 ~ 23:59:59 02/03/2014 (91 days)
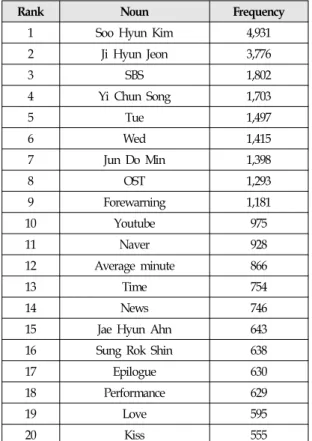
3.3 Noun extraction & Categorization R package was used to calculate the frequency of the tweeter word. The following Table 5 is intended to indicate the nouns corresponding to the most frequent 1 Ranked to the 20 Ranked.
Words that showed the highest frequency corresponds to the main
Twitter Variable Variable
Name Measurement Time Internal External
Episode AMR SHR
In ternal
X1 Star X
1, …, X
7X
8, X
9Y
1Y
2X2 Cameo Thu (23:10) ~ Fri (24:00) X
11, …, X
71X
81, X
91X3 Writer …
X4 BGM Wed (00:00 ~ 22:00) X
12, …, X
72X
82, X
92X5 PPL Wed (22:00 ~ 23:10) … e
1Y
1e1Y
2e1X6 Site Wed (23:10) ~ Thu (22:00) X
13, …, X
73X
83, X
93X7 Dialogue Thu (22:00 ~ 23:10) … e
2Y
1e2Y
2e2Ex ternal
X8 Rival
X9 Structure …
(Table 6) AMR/SHR and Twitter attribute matching table character of the drama is a “Soo Hyun Kim, Ji Hyun Jeon ". In addition was a lot of talk about characters. The viewer can know that it is showing a high interest to the actor in the drama.
(Table 5) Base frequency of Noun Extraction
Rank Noun Frequency
1 Soo Hyun Kim 4,931
2 Ji Hyun Jeon 3,776
3 SBS 1,802
4 Yi Chun Song 1,703
5 Tue 1,497
6 Wed 1,415
7 Jun Do Min 1,398
8 OST 1,293
9 Forewarning 1,181
10 Youtube 975
11 Naver 928
12 Average minute 866
13 Time 754
14 News 746
15 Jae Hyun Ahn 643
16 Sung Rok Shin 638
17 Epilogue 630
18 Performance 629
19 Love 595
20 Kiss 555
Category classification table, according to the previous studies about the properties of the message, were divided into internal and external attributes [16][17][5].
Table 6 shows 9 variables which represent the number of twitter comments about each variable. For example, X1 means the number of comments in twitter about stars shown at the drama. Types of opinion are divided into cognitive interaction, emotional interaction, and act interaction based on the attributes of the message. There are 3 kinds of articles in accordance with the content and theme of the articles. First types are directly related to the specific program. Second ones are no direct relevance and writings about the program. Lastly a variety of tearing is on viewing function and so on [18]. However, variables used in this study are largely divided into internal properties (The main character, Cameo, Writer, BGM, PPL, Filming Site, Dialogues) and external properties (The same time drama, Broadcasting Structure) to reflect the characteristics of the Twitter and drama. Character was composed main character, cameo (Special appearance, Appearances friendship) and writer.
3.4 MATCHING ANALYSIS OF AMR/ SHR WITH BUZZ
Based on the “My Love from the Star” category dictionary, we
placed the average minute rating(AMR) and share rating(SHR)
at the dependent variable Y1 and Y2. The nine independent
variables including the structure of the main character,
broadcasting structure, and so on were denoted as X1~X9.
AMR and SHR of Wednesday matched through Friday after data on Thursday broadcast and Wednesday broadcast before the data (1). AMR and SHR Thursday matched through after data on Wednesday broadcast and Thursday broadcast before the data (2).
4. PREDICTION OF AMR/SHR
4.1 RELIABILITY ANALYSIS OF MEASURING ITEMS ANALYSIS
To analyze the reliability of testing, SPSS 18 was used. To measure the reliability, Cronbach’s alpha was used. An alpha above 0.6, or more strictly above 0.7, is considered to indicate a high reliability. For nine properties of Twitter messages and AMR, SHR Alpha value of 0.710 at Table 7, since satisfy the reliability, it was performed multiple regression analysis.
(Table 7) Reliability Analysis of Measuring Items Variable Cronbach Alpha Number of items Twitter and AMR/SHR 0.710 10
4.2 INDEPENDENT VARIABLES CORRELATION ANALYSIS
In this study, by using the SPSS18 to figure out correlation between independent variables were performed correlation analyzes. The results are Table 8, the closer to 1.00 indicates that the correlation is very high. Correlation between the two variables are highly The Star (main character), the correlation value of the BGM and the Broadcast Structure variable is the highest as 0.780.
4.3 MULTIPLE REGRESSION MODEL FOR PREDICTING AMR AND SHR
For the multiple regression analysis of Twitter data satisfying the TV program’s AMR and SHR as well as reliability, WEKA 3.4.1 was used as a mining tool. Table 9 show the findings
from the multiple regression model analyzing the relationship between the Twitter data variables and the AMR and SHR by dividing the entire data set Cross-validation Folds 6.
(Table 8) Independent variables correlation analysis
X 1 2 3 4 5 6 7 8 9
1 1
2 .476* 1 3 .035 .325 1 4 .666** .235 -.137 1 5 .586** .161 -.106 .307 1 6 .312 .332 -.155 .314 .215 1 7 .249 .053 -.369 .264 .218 .214 1 8 .360 .076 .544* .348 .027 -.042 -.023 1 9 .619** .271 -.113 .780** .201 .173 .362 .176 1
** p < 0.01, * p < 0.05