• 검색 결과가 없습니다.

Modelling of a Base Big Data Analysis Using R Method for Selection of Suitable Vertical Farm Sites: Focusing on the Analysis of Pollutants

N/A
N/A
Protected

Academic year: 2021

Share "Modelling of a Base Big Data Analysis Using R Method for Selection of Suitable Vertical Farm Sites: Focusing on the Analysis of Pollutants"

Copied!
11
0
0

로드 중.... (전체 텍스트 보기)

전체 글

(1)

1. INTRODUCTION

Despite of international efforts to solve the problem of overpopulation, the population in the developing countries who are experiencing a seri- ous food shortage is increasing faster. What makes worse is that they do not have adequate skills or lands to maintain enough food for their people.

Aside from these problems, consuming inedible or contaminated foodstuffs is causing a grave prob- lem for them as well. The Vertical Farm was pro- posed in 1999 as an alternative efficient food pro- duction system which can solve such problems and increase the production volume. Since then many

researches have been carried out and recently, the government of Republic of Korea (ROK) is sup- porting the construction of pilot vertical farms in the country. The Ministry of Maritime Affairs and Fisheries is leading the project along with some private corporations with the hope of building ac- tual vertical farms in near future. Basically, the in- door crop-growing vertical farms commonly re- quire water-recycling equipments, application- specific LED lights and nutrient solutions. But re- cent rapid increase in the number of health-con- scious consumers demands the farm produce to be contaminant-free and healthy. The demand is high as Koreans are living next to the mainland China

Modelling of a Base Big Data Analysis Using R Method for Selection of Suitable Vertical Farm

Sites: Focusing on the Analysis of Pollutants

Jun-Ho Huh

, Kyungryong Seo

††

ABSTRACT

The problem of food deficiency is a major discouragement to many low-income developing countries.

Most of these countries experience constant danger of hunger, malnutrition and diseases as they are unable to maintain their food supplies mainly due to lack of arable lands and modern crop, livestock and fishery production technologies. In addition, the pollutants resulting from the secondary industries are becoming another serious issue in their food problems. The pollutants mixed in the sands blowing from the mainland China and the toxic waters flowing in the farm land form the industrialized zones are some of the examples. The Vertical Farm, or Plant Factory, proposed in this study could be the best alternative food production system for them. Vertical farm is an efficient food production system that yields relatively a large volume of food materials without environmental risks. The system does not require a large open space and manpower and can minimize the possibility of infiltration of pollutants.

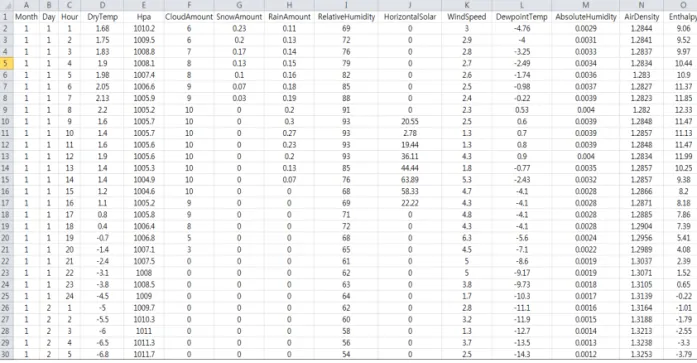
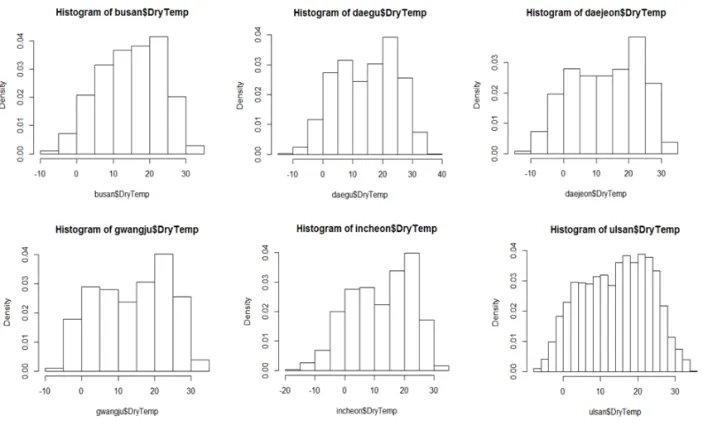
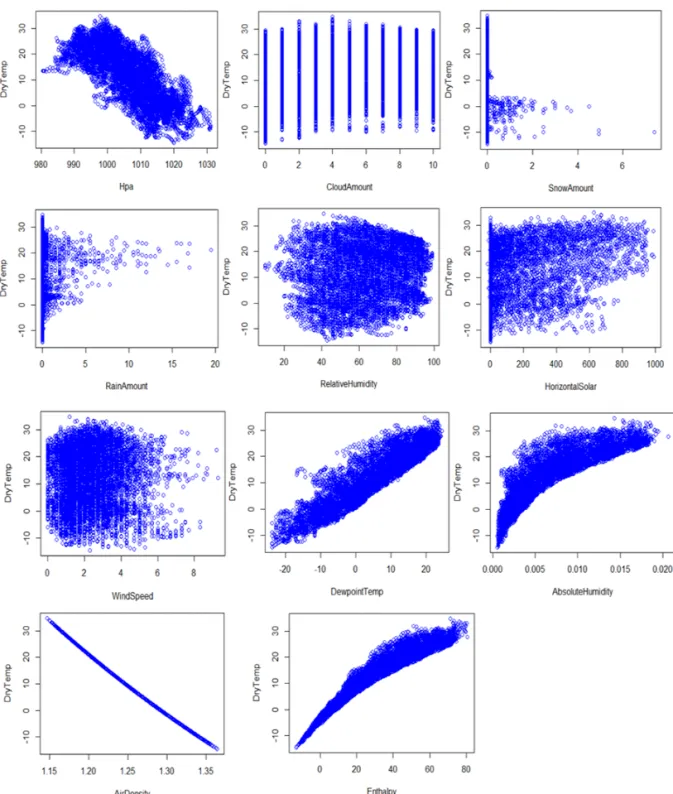
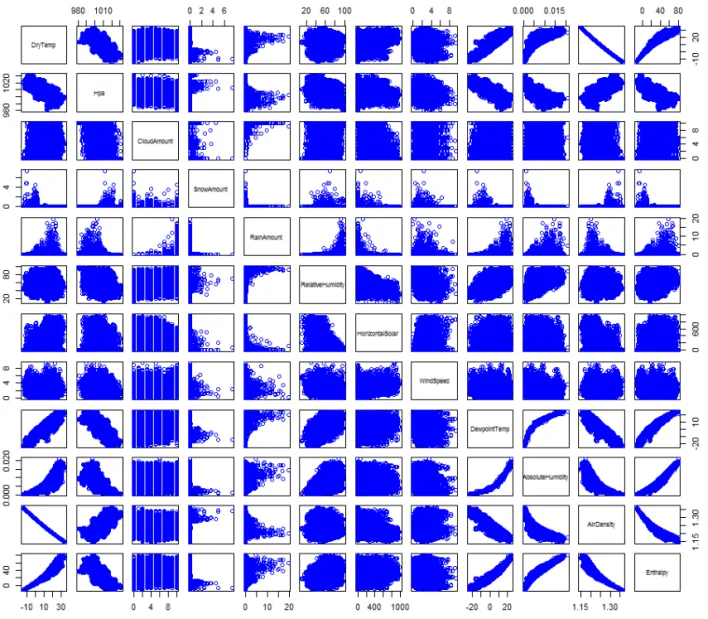
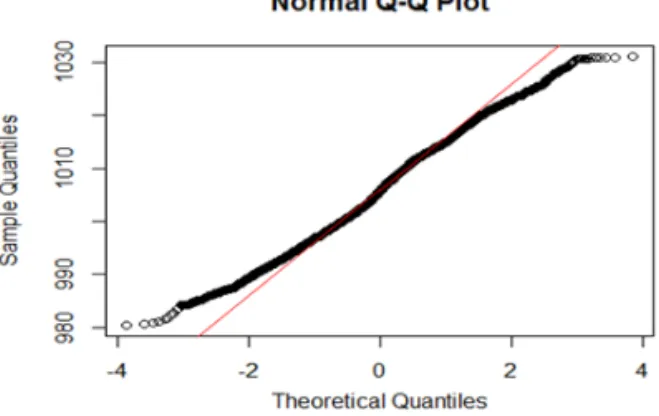
This research describes a basic model of the system focusing on determining the optimal sites for it based on the meteorological data concentrating on the atmospheric pollutants. The types and volume of pollutants are analyzed and identified through the big data obtained, followed by visualization of analysis results and their comparisons for better understanding.

Key words: Modelling, R, Big Data, Vertical Farm, Vertical Farm Sites.

※ Corresponding Author : Kyungryong Seo, Address:

(48513) DSLab, Pukyong National University at Daeyeon, 45, Yongso-ro, Nam-gu, Busan, Republic of Korea, TEL : +82-51-629-6254, E-mail : [email protected]

Receipt date : Oct. 10, 2016, Revision date : Oct. 18, 2016

Approval date : Nov. 30, 2016

††

Department of Software, Catholic University of Pusan, E-mail : [email protected]

††

Department of Computer Engineering, Pukyong National

University at Daeyeon

(2)

from where most of pollutants are flowing in from through both air and sea and result in bio- accumulation, especially heavy-metals. This is common in every other country where industries are growing fast and the pollution prevention measures cannot catch up with the speed of their growth. Although it may be possible to reduce in- flow of contaminants by constructing a closed ver- tical farm, it will not be able to keep pollutants or contaminants out completely so that selection of an optimal site for a vertical farm is essential in low- ering the possibility of contaminations. On that ac- count, a basic analysis model was designed by per- forming a big data analysis against major con- taminants found in the Korean meteorological data.

R-language was used for the construction of the model.

The results obtained from the univariate, simple regression, and multi regression analyses have been visualized for easier viewing and a model was established using the log transformation and other means. A base research was performed for the se- lection of suitable sites for the vertical farms by modelling the involved characteristics based on the categorized explanatory variables.

2. RELATED STUDIES

2.1. Vertical Farm

The Professor of Columbia university, Dick Despommier conceived an idea of Vertical Farm system in 1999 [3] while he was trying to find the ways to solve the problem of food shortages mainly due to lack of arable lands. Also being called as the Plant Farm, this system produces relatively a larger volume of crops and plants in a limited space by controlling temperature, humidity, water level and lights. The weather conditions do no influence its output much. Commercialization of the system has progressed much after going through various test bed experiments in US, EU, Japan and other developing countries [1-5]. Even the livestock in- dustry is studying the system in cooperation with some pharmaceutical companies [6-9]. An example of vertical farm is shown in Fig. 1 such a system is expected to harvest crops around thirty times a year and depending on the system configuration.

Since its efficiencies have been proven by the test beds, this study focuses on the methodology of se- lecting an optimal site(s) for the vertical fish farms.

This "Future Farming" in the time of abnormal climate changes uses LED lights instead of sun-

Fig. 1. Example of Vertical Fish Farm.

(3)

light and sprinkles nutrient-mixed sprays on the roots instead of soaking them in the water.

According to the simulations, it is possible to grow foodstuffs that are enough to feed fifty thousand people with the thirty-story farm.

This system allows farmers to grow their prod- ucts regardless of weather conditions by control- ling lights, water, temperature and humidity. It's often referred to as a "Plant Farm". For the agri- cultural sector, the test bed experiments were completed in Japan, US and Europe, where some of their organizations have entered the business stages whereas the livestock sector is actively studying the system with some pharmaceutical companies. Fig. 2 shows sample of Vertical Farm.

The vertical farm, which has been proposed by Professor Dickson Despommir, refers to a method of growing plants, crops or fishes in a building structure (Vertical Farm) [3-7]. This method is being studied as a national project and currently experimented in some test beds in the Republic of Korea (ROK). This research is focusing on a se- lection method of optimal farm sites for these farms, especially for the aquafarms.

2.2. Reference of Big Data

The reference data used in the study contained the atmospheric data collected throughout a year on an hourly basis. The measured elements were dry-bulb temperatures, atmospheric pressures, cloudiness, snowfalls, rainfalls, wind directions, relative humidity, horizontal solar irradiation, wind speeds, dew-point temperatures, absolute humid- ity, air densities, and enthalpy.

Using the R-studio, the analysis for atmospheric data of Seoul in 1981 was carried out first, followed by the same processes for other cities. Fig. 3 shows Variables of Seoul's atmospheric environment data measured by the hour. Selected variables for anal- yses includes dry- bulb temperature(℃), atmos- pheric pressure (hPa), cloudiness (1-10), snowfall (cm), rainfall (cm), relative humidity (%), horizon- tal solar irradiation (W/m²), wind speed (m/s), dew-point temperature (℃), absolute humidity (Kg/Kg), air density (Kg/㎥), and enthalpy (KJ/Kg) and these were designated as DryTemp, hPa, CloudAmount, Snow Amount, RainAmount, RelativeHumidity, Horizontal Solar, WindSpeed, DewpointTemp, Absolute Humidity, AirDensity, Enthalpy, respectively. The data was extracted from the 30-year-long (1981-2010) atmospheric environment data of Seoul, Daejeon, Daegu, Busan, Gwangju, Incheon and Ulsan, the cities of the ROK.

3. BASIC BIG DATA ANALYSIS METHOD FOR SELECTION OF SUITABLE VERTICAL FARM SITES

Although the waters of Jeju Island are known

as clean areas, the level of heavy-metal con-

tamination is becoming rather serious as they are

close to the mainland China. However, it is difficult

for the researchers or farmers to exactly point out

the causes of contamination as it's being argued

that the pollutants are usually accumulated through

the mechanism that has several parameters, or in-

flow of heavy-metal-mixed dusts. Thus, we are

Fig. 2. Sample of Vertical Farm.

(4)

not dealing with the heavy-metal accumulation in this study. Unless future vertical farms are not equipped with adequate atmospheric filters, it would be logical to make the best selections for the farm sites by using an atmospheric analysis model to avoid contaminated areas.

3.1. Analysis Using R

Daily variable values can be checked with the R-studio and the average, variance and the aver- age, variance and standard deviation of each varia- ble can be calculated using the mean, var and sd functions. Fig. 4 shows means, variances, and standard deviations of variables of Seoul measured using the R-studio. Observing the histogram of DryTemp, it has a leftward long tail and most of the data is highly concentrated in the temperatures between 20℃ and 30℃. For hPa, the data is evenly distributed having a large peak in the middle, where the data is concentrated between 1000hPa and 1010hPa. The data in the histogram of the CloudAmount is weighted towards both ends. For SnowAmount and RainAmount, the distribution in respective histograms are highly unbalanced and

dta is mostly concentrated between 0cm and 1cm.

RelativeHumidity a slightly long tail extended to- ward the left but on the whole, the data is evenly distributed. The histograms of HorizontalSolar,

Fig. 4. Means, Variances, and Standard Deviations of Variables of Seoul Measured Using the R-studio.

Fig. 3. Reference of Big Data.

(5)

WindSpeed, AbsoluteHumidity and AirDensity have a similar form in which the long tail is ex- tended toward the right. Their data is mostly dis- tributed between low values. For DewpointTemp, it has a slightly long tail to the left and the data is weighted towards the sections where the tem- peratures are higher. Finally, the Enthalpy, its form does not assume the form of bell curve but is sym- metric as a whole. The same data analysis was performed for other cities as well.

Fig. 5 shows DryTemp of analysis. All the data analysis results for other cities were similar to that of Seoul. There was a little difference depending on the value sizes but they had a histogram form where their long tails were mostly extended to the left. In case of the Ulsan city, the data was dis- tributed more evenly than the others.In general, the data of atmospheric pressures was evenly dis- tributed and most of the cities had a symmetric form. Also, the data was mainly concentrated be- tween 1,000hPa and 1,010hPa. Incheon and Ulsan showed rather higher values compared to the

others. Fig. 6 shows hPa of analysis. and Fig. 7 shows AirDensity of analysis.The histograms showed a form that has a long tail extended to the right and the data was mainly concentrated at the sections with low values. There were some differ- ences between the cities. Busan exhibited a bell- type histogram with a large peak. The data of Daegu and Gwangju was concentrated at the sec- tions with low values while Ulsan's data was most evenly distributed, showing a bell-type histogram.

Tounderstand the effects of other variables (i.e., cloudiness, snowfall, rainfall, relative humidity and wind speed, etc.), the graphic representations have been created. The graphs allows easier and con- venient assessment of relationships between DryTemp and the other variable.

Fig. 8 shows correlations between Seoul's Dry Temp and the other variables determined with R-studio plotting. It was conveniently understood that the variables that have the significant values to explain the DryTemp were the atmospheric pressure, DewpointTemp, AbsoluteHumidity, Air-

Fig. 5. DryTemp of Analysis.

(6)

density and Enthalphy. Especially, the graph in- dicated that the AirDensity was inversely propor- tional to the DryTemp quite exactly.

3.2. Multiple Regression Analysis

The multiple regression analysis is to analyze the data to understand the correlations between each variable. Therefore, only the One:One linear Fig. 6. hPa of Analysis.

Fig. 7, AirDensity of Analysis.

(7)

relationship can be determined. However, since the meteorological information contains many varia- bles, the multiple regression analysis is needed to determine the correlations. For the analysis, the prediction equation that has various variables will be used.

Fig. 9 shows all the variable pairs of Seoul rep-

resented by the paris() function of R-studio. The

multiple regression analyses were performed on

the dependent variable (temperature) using the lm

function. As a result, the model was suitable and

the regression coefficient was statistically sig-

Fig. 8. Correlations between Seoul's DryTemp and the other Variables Determined with R-studio Plotting.

(8)

nificant. The value of F was 1.951e+07 and the de- termination coefficient R² was 1. The value of R² was higher than the one obtained from the simple regression analysis, which means that the ex- planatory power against the model is higher. That is, the temperature can be also determined (ex- plained) with other variables.

3.3. Residual

The residual graph that shows the difference between the value of dependent variable estimated by the model and the value obtained from an actual observation has been created. The residuals are the differences in these two dependent variables. With

the residual (error), one can understand the un- certainty of information that cannot be explained with the statistical models.

Fig. 10 shows the Q-Q normality plotting im-

plemented with the R-studio. Moreover, such dif-

ference can also be interpreted as an error or an

uncertainty information that cannot be adequately

explained with the statistical models. Since the re-

siduals are the random variables having the ran-

dom effects, they are useful in testing the appropri-

ateness of distribution assumed by the statistical

model. Observing that this residual plot is evenly

shaped, one can determined that there are no prob-

lems in error terms as well. We were able to con-

Fig. 9. All the Variable Pairs of Seoul Represented by the Paris() Function of R-studio.

(9)

clude that the dependent variable (temperature) can be determined (explained) through the multiple regression analyses of other variables.

4. CONCLUSION AND FUTURE WORKS

The meteorological data has been collected for a period of a year for analysis purpose. The results from the analyses were used to establish an R-lan- guage -based analytical model to locate the most suitable site for the vertical farm, possible in or near the cities. Such analysis results naturally showed some differences depending on the geo- graphical factors of individual candidate cities. The data obtained through simple/multiple regression and univariate analyses was visualized for easier understanding and comparison of the results by the researchers. This was quite effective in determin- ing some of the data characteristics which would have been unnoticeable. Log-transformation was used also to construct the analytical model, along with a basic research involving categorization of the explanatory variables while modelling the typi- cal characteristics of the data.

This study will be the basis of future extended study which will include the big data collected through a period of more than 30 years. We expect that the analytical model created based on such a data will be quite accurate when finding the most suitable locations for the vertical farms, as well as

for the conventional indoor aquafarms.

APPENDIX

Since Pukyong National University is continu- ing the researches on raising high-value fishes, we've proceeded with the research on a method of finding the optimal farming sites for the farmers.

In aquaculture, selecting the optimal locations means finding the farm sites that have the most suitable environment, economic feasibility, and the least harmful elements. As mentioned earlier, the ROK government has much interest in the vertical farm system and constructing the test beds for the research purpose. It is our hope that our proposal will contribute to such projects to provide healthier foods to the public.

The first draft of this paper [1] was presented Oral Session in Spring Conference of Korea Multimedia Society, May 27-28 (2016). I am grate- ful to 2 anonymous commentators who have con- tributed to the enhancement of the paper's com- pleteness with their valuable suggestions at the Conference. I've had a great opportunity to study some introductory courses such as Aquaculture Facility and Environment, and aquaculture tech- nology under an honorary professor of Aquaculture Technology at Jeju University and a former head of the Korea Aquaculture Society, Prof. S. Roh my motive in writing this paper concerning the se- lection of the optimal farm sites came from the ex- perience of a field trip to Jongdalri, which had taught me that the fishes cannot be and should not be raised with the waters or in the airs that we cannot drink or breathe ourselves.

REFERENCE

[ 1 ] J.H. Huh et al., “Modelling of a Basic Big Data Analysis Method for Selection of Suitable Vertical Farm Sites: Focusing on the Analysis of Pollutants,” Proceedings of Spring Confer- ence of the Korea Multimedia Society, Vol.

Fig. 10. The Q-Q normality plotting implemented with

the R-studio.

(10)

19, No. 1, 2016.

[ 2 ] J.H. Huh, H.B. Kim, and K. Seo, “A Prelimi- nary Analysis Model of Big Data for Preven- tion of Bioaccumulation of Heavy Metal-Based Pollutants: Focusing on the Atmospheric Data Analyses,” Advanced Science and Technology Letters, Mechanical Engineering, SERSC, Vol. 129, pp. 159-164, 2016.

[ 3 ] D. Despommier, Reducing the Impact of Agriculture on Ecosystem Functions and Services, Department of Environmental Health Sciences, Mailman School of Public Health, Columbia University, USA, 1999.

[ 4 ] D. Despommier, “The Rise of Vertical Farms, Scientific American,” Nature, Vol. 301 pp. 80- 87, 2009.

[ 5 ] D. Despommier, “Farming Up the City: The Rise of Urban Vertical Farms, Trends in Biotechnology,” Cell, Vol. 31, No. 7, pp. 388- 389, 2013.

[ 6 ] D. Despommier, “The Vertical Farm: Control- led Environment Agriculture Carried Out in Tall Buildings Would Create Greater Food Safety and Security for Large Urban Popula- tions,” J ournal of Consumer Protection and Food Safety, Springer, Basel, Vol. 6, No. 2, pp. 233-236, 2010.

[ 7 ] D. Despommier, “Vertical Farms in Horticul- ture,” Encyclopedia of Food and Agricultural Ethics, Springer, Netherlands, pp. 1791-1799, 2014.

[ 8 ] C. Boden, M. Karnstedt, M. Fernandez, V.

Markl, “Large-scale Social Media Analytics on Stratosphere,” In: WWW, ACM, 2013.

[ 9 ] V. Borkar, M. Carey, R. Grover, N. Onose, R.

Vernica, “Hyracks: a Flexible and Extensible Foundation for Data-intensive Computing,”

In: ICDE, IEEE, pp. 1151-1162, 2011.

[10] D. Battré, M. Hovestadt, B. Lohrmann, A.

Stanik, D. Warneke, “Detecting bottlenecks in parallel dag-based data flow programs,” In:

MTAGS, IEEE, 2010.

[11] A. Behm, V.R. Borkar, M.J. Carey, R. Grover,

C. Li, N. Onose, R. Vernica, A. Deutsch, Y.

Papakonstantinou, V.J. Tsotras, “Asterix:

Towards a Scalable, Semistructured Data Platform for Evolving-world Models,” Dis- tributed Parallel Databases, Springer, Vol. 29, No. 3, pp. 185-216, 2011.

[12] K.S. Beyer, V. Ercegovac, R. Gemulla, A.

Balmin, M. Eltabakh, C.C. Kanne, F. Ozcan, E.J. Shekita, “Jaql: A Scripting Language for Large Scale Semistructured Data Analysis,”

P VLDB, Vol. 4, No. 12, pp. 1272-1283, 2011.

[13] J.H. Huh, S. Otgonchimeg, and K. Seo,

“Advanced Metering Infrastructure Design and Test Bed Experiment Using Intelligent Agents: Focusing on the PLC Network Base Technology for Smart Grid System,” The J ournal of Supercomputing, Springer, Vol.

72, No. 5, pp. 1862-1877, 2016.

[14] J.H. Huh, T. Koh, and K. Seo, “Design of a Shipboard Outside Communication Network and the Test Bed Using PLC: for the Work- ers' Safety Management During Ship-Build- ing process,” Proceedings of the 10th Inter- national Conference on Ubiquitous Information Management and Communication, ACM IMCOM 2016, No. 43, pp. 1-6, 2016.

[15] J.H. Huh, T. Koh, N.J. Kim, and K. Seo,

"Design and Test Bed Experiments of Smart Grid- based PLC Slient node problem Using OPNET," Proceedings of the 11th Internatio- nal Conference on Multimedia Information Technology and Applications, Tashkent, Uzbekistan, IEEE Region 10, Changwon Section, pp. 317-322, 2015.

[16] Q. Gao, J.Y. Yu, P.H.J. Chong, P.L. So, and E. Gunawan, "Solutions for the “Silent Node”

Problem in an Automatic Meter Reading Sys- tem Using Power-Line Communications,"

IEEE Transactions on Power Delivery, Vol.

23, No. 1, pp. 150-156, 2008.

[17] J.H. Huh and K. Seo, "Design and Implemen-

tation of the Basic Technology for Solitary

Senior Citizen's Lonely Death Monitoring

(11)

System using PLC," Journal of Korea Multi- media Society, Vol. 18, No. 6, pp. 742-752, 2015.

[18] J.H. Huh, N. Kim, and K. Seo, "A Study of Power Line Communication-based Smart Outlet System Expandable at Home" J ournal of Korea Multimedia Society, Vol. 19, No. 5, pp. 901-909, 2016.

Jun-Ho Huh

finished the Cooperative Marine Science and Engineering Pro- gram, Texas A&M University at Galveston, United States of America in Aug. 2006.

Received B.S. in Science Degree from Department of Major of Applied Marine Sciences (Currently Faculty of Marine Biomedical Sciences), B.S. in Engineering Degree (Double Major) from Department of Major of Computer Engineering from Jeju National University at Ara, Jeju, Republic of Korea in Aug. 2007. And com- pletion of the Secondary School (Middle and High schools) Teacher Training Curriculum in accordance with Republic of Korea Secondary Education Act.

M.A. in Education Degree from Department of Major of Computer Science Education, Graduate School of Education, Pukyoug National University at Daeyeon, Busan, Republic of Korea in Aug. 2012. And completion of the Secondary School (Middle and High schools) Teacher Training Curriculum in accordance with Republic of Korea Secondary Education Act.

Received the Ph.D. in Engineering Degree from Department of Major of Computer Engineering, Grad- uate School, Pukyoug National University at Daeyeon, Busan, Republic of Korea in Feb. 2016.

He received the Best Paper Award from Korea Multimedia Society five times (Nov. 2014, May. 2015, Nov. 2015, May, 2016. Oct). And he received Best Paper Award The 10th 2016 International Interdiscipli- nary Workshop Series from HSST (Aug. 2016). Also he received Best Paper Award The 16th International Conference on Control, Automation and Systems (Oct.

2016), ICROS with IEEE Xplore.

Research Professor of Dankook University at Jukjeon, Yongin, Republic of Korea (July. 2016- Sep.

2016). Currently he is Assistant Professor of Depart- ment of Software, Catholic University of Pusan, Busan, Republic of Korea (Dec. 2016-).

His research interests are Green IT, Smart Grid, Network Security, IoT, Curriculum of Computer.

Kyungryong Seo received B.S. in Engineering Degree from Department of Major of Electrical Machinery Engineering from Pusan Natio- nal University, Busan, Republic of Korea in Feb. 1983.

M.S. in Engineering Degree in Electrical Engineering from Korea Advanced Institute of Science and Technology (KAIST), Daejeon, Repu- blic of Korea in Feb. 1990.

Received the Ph.D. Engineering Degree in Electrical Engineering from Korea Advanced Institute of Science and Technology (KAIST), Daejeon, Republic of Korea in Aug. 1995.

He received the Best Paper Award from Korea Multi- media Society six times (Nov. 2007, Nov. 2014, May.

2015, Nov. 2015, May 2016). And he received Best Paper Award The 10th 2016 International Interdiscipli- nary Workshop Series from HSST (Aug. 2016).

Currently he is a Full (Tenure) Professor of Computer Engineering Departments, Pukyong National University at Daeyeon, Busan, Republic of Korea.

His research interests are High Speed Computer

Network, Network Security, High Availability Com-

putting.

수치

Fig. 1. Example of Vertical Fish Farm.
Fig. 4. Means, Variances, and Standard Deviations of  Variables of Seoul Measured Using the R-studio.
Fig. 5 shows DryTemp of analysis. All the data analysis results for other cities were similar to that of Seoul
Fig. 9 shows all the variable pairs of Seoul rep- rep-resented by the paris() function of R-studio
+3

참조

관련 문서

The experimental data were adopted for this analysis on the base of cold storage technology of modified atmosphere package(MAP) for seven months from March

A A A A Study Study Study Study Analysis Analysis Analysis Analysis of of of of the the the the J. Bach, a representative composer in Baroque period. Composed

period was prolonged unavoidably, (3) by explaining the risk factors associated with the failure to patients honestly, and subsequently performing

(구체적으로 어느 집단의 평균이 다른 것인지 판단하기 위한 것이 다음에 설명할 사후 검정이다.) 두 통계량의 p-값에 차이가 있다면, Welch 검정법이 더 강력하다고

 Thus, boiling occurs at a given pressure acting on the fluid by raising the temperature, or at a given fluid temperature by lowering the pressure.. Cavitation phenomena in

It considers the energy use of the different components that are involved in the distribution and viewing of video content: data centres and content delivery networks

After first field tests, we expect electric passenger drones or eVTOL aircraft (short for electric vertical take-off and landing) to start providing commercial mobility

1 John Owen, Justification by Faith Alone, in The Works of John Owen, ed. John Bolt, trans. Scott Clark, "Do This and Live: Christ's Active Obedience as the