673
F
ORESTS
OCIETYEstimation of Carbon Storage Using Mean Biomass Density in Korean Forests
Xiaodong Li1, Myong Jong Yi1*, Mi Jeong Jeong1, Yowhan Son2, Guangze Jin3 and Sang Sub Han1
1
College of Forest and Environmental Sciences, Kangwon National University, Chuncheon 200-701, Korea
2
Division of Environmental Science and Ecological Engineering, Korea University, Seoul 136-701, Korea
3
School of Forestry Northeast Forestry University, Harbin 150040, China
Abstract :
This study examined the biomass data estimated from different allometric models and calculated the mean aboveground biomass, mean belowground biomass and root/shoot ratio values according to the forest types and age classes. These mean values and the forest inventories in 2009 were used to estimate the aboveground and total biomass carbon storage in different forest types (coniferous, deciduous and mixed forests). The aboveground and total biomass carbon storage for all forest types in Korea were 350.201 Tg C and 436.724 Tg C. Over the past 36 years, plantations by reforestation programs have accounted for more than 70% of the observed carbon storage. The carbon storage in Korean forest biomass was 436.724 Tg C, of which 175.154 Tg C for coniferous forests, 126.772 Tg C for deciduous forests and 134.518 Tg C for mixed forests, comprising approximately 1/20 of the total carbon storage of the East Asian countries. The total carbon storage for the whole forest sector in Korea was 1213.122 Tg C, of which 436.724 Tg C is stored in forest biomass if using the ratio of carbon storage in different pools examined from the United States. Such large carbon storage in Korean forests is due mainly to active plantations growth and management practices.
Key words :
Korean forest biomass, carbon storage, carbon density, allometric model, plantation
Introduction
Recent studies have shown that the mid- and high-lat- itude forests in the Northern Hemisphere are significant sinks for sequestrating atmospheric CO
2(e.g. Choi et al ., 2002; Janssens et al ., 2003; Nabuurs et al ., 2003; Fang et al ., 2001, 2005). However, the regional magnitude, spatial pattern and causes of carbon sources and sinks remain uncertain (Goodale et al ., 2002; Liski et al ., 2003;
Houghton 2005; Fang et al ., 2006). With the increasing scientific and political interest in regional aspects of the global carbon cycle, there is a strong impetus to better understand carbon storage in Korean forests. This is not only because the Republic of Korea (henceforth referred to as Korea) as a member is seeking to implement its commitments under the United Nations Framework Con- vention on Climate Change (UNFCCC) through nationwide reforestation to increase the level of carbon storage in its forest ecosystems, but also because it has experienced intensive land change histories during the first half of
last century.
Korea is comprised of 16 regions, 7 metropolitan cities (Soeul, Busan, Daegu, Incheon, Gwanju, Daejeon and Ulsan) and 9 provinces (Gyeonggi-do, Gangwon-do, Chungcheong- buk-do, Chungcheongnam-do, Jeollabuk-do, Jeollanam- do, Gyeongsangbuk-do, Gyeongsangnam-do and Jejudo), and has a unique climate that can allow more than three fifths of its land area to be covered with forest (Shin, 2002). Approximately 42% of forestland is coniferous forest, 26% is deciduous forest, 29.1% is mixed forest, and the remaining 2.9% are bamboo forest and non-wooded land (Statistical Yearbook of Forestry, 2009). Although sporadic government efforts at reforestation had begun in the 1960s, the Korean government initiated three ten-year national reforestation programs in 1973 to protect water, soil and biological resources and rehabilitate Korea’s denuded landscape (Choi et al ., 2002; Tak et al ., 2007).
In the meantime, forest ecologists developed series of allometric models to estimate the biomass and productivity in many forest types of Korea, with a large accumulation of field survey data. These field surveys and the latest forest inventories are complementary data sources for estimating the level of carbon storage in Korean forests.
*Corresponding author
E-mail: [email protected]
674 Jour. Korean For. Soc. Vol. 99, No. 5 (2010)
However, there are few reports of this type of study.
The aim of this study were to (1) estimate the biomass carbon storage in Korean forests using the mean aboveground biomass, mean belowground biomass and root/shoot ratio values based on field surveys and forest inventories, and (2) identify the regional carbon magnitude and distribution in forest biomass of each forest type.
Data and Methods
Two data sources were used in this study, namely forest inventory data and field survey data.
1. Forest inventory data
Forest is defined as land with 30% or more crown cover in government-, community- and privately-owned forests. The forest inventory data provides detailed infor- mation on the total area, age, site quality for each forest type (coniferous, deciduous and mixed forests) at a regional level (Statistical Yearbook of Forestry, 2009). Within each region, each forest type was stratified into three site classes (low, medium and high quality). Each site was subdivided into five age classes from II to VI (younger than 20 years old for II, 30 years old for III, 40 years old for IV, 50 years for V and over 50 years old for VI). The total area of each forest type was given by the age classes for each region.
2
.Field survey data
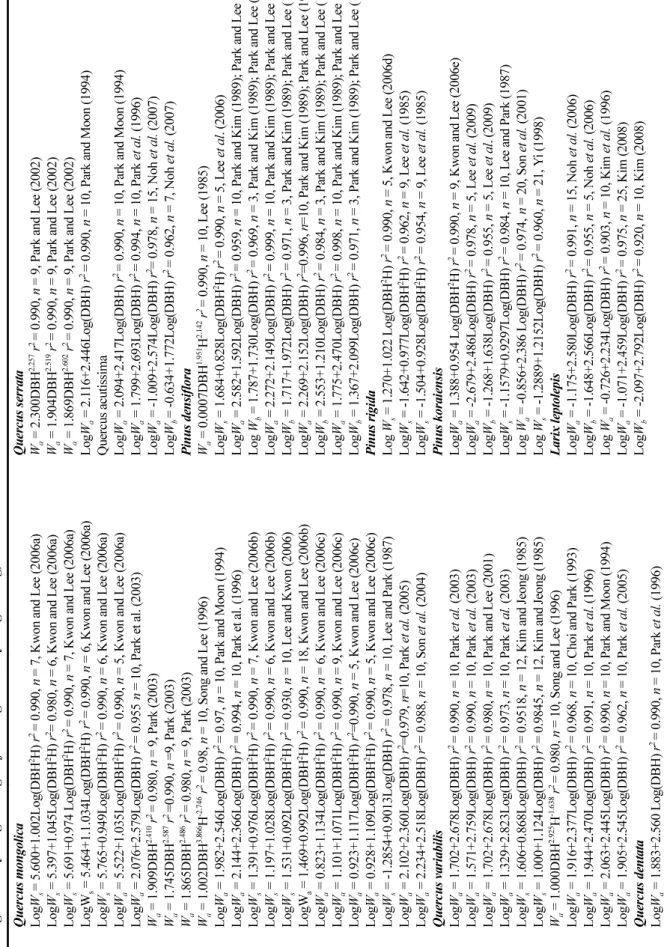
This study examined the data from publications over the past 40 years on allometric models according to the tree species and also compiled data on biomass accord- ing to the forest type in Korea. Most studies focused on the major dominate species and developed allometric equations for the aboveground components such as stem, foliage and branches. Only few studies reported the belowground portion (root) (Table 1). The major dominate species for coniferous forests are Pinus densiflora (55%), P. rigida (15.2%), P. koraiensis (8.6%), and Larix leptolepsis (17.2%), whereas the major dominate species for deciduous forests are Qercus species, particularly Q. Mongolica , Q.
acutissima , Q. variabilis , Q. serrata , and Q. dentate (Statistical Yearbook of Forestry, 2009). This study assumed that the major coniferous species represents all coniferous trees, Quercus species represents all deciduous trees, and that those coniferous species and Quercus species are representative of mixed forests because Pinus and Quercus species account for more than two-thirds of all coniferous and deciduous trees in Korea (Choi et al ., 2002; Tak et al ., 2007). It should be noted that not all original studies measured both the above- and below-ground biomass for the dominate tree species, and only few studies reported the forest floor mass, dead wood biomass and soil
carbon content. The mean aboveground biomass, mean belowground biomass and root/shoot ratio values accord- ing to the forest types and age classes were then calculated (Table 2).
2. Estimation of forest biomass
The aboveground or total biomass ( Y ) for each forest type was calculated using Eq. (1):
(1) Where, D
efgand A
efgare the aboveground or total mean biomass density (Mg ha
−1) and total area for each age class ( g = 1, 2, 3, 4, 5), site class ( f = 1, 2, 3), and region ( e = 1, 2, 3, …, 16) (Statistical Yearbook of Forestry, 2009), and R is the ratio of root to shoot.
The biomass in bamboo forests was also analyzed, and the total biomass was estimated from the average values based on few case studies. The mean biomass density (including culms, branch, leave, rhizome and root) for the different bamboo species ( Phyllostachys pubescens , P. bam- busoides , P. nigra var. henonis ) ranged from 36.8 to 103.6 Mg ha
−1(Park and Ryu, 1996; Hwang et al ., 2005), with a mean biomass density of 79.4 Mg ha
−1. The biomass of bamboo forests in each region was calculated by multiply- ing the mean biomass density by total area in the region.
Results
Table 1 lists the allometric models for the major dominate species in Korean forests. The commonly used models for estimating the biomass of different trees are W = a (DBH)
bor Log W = a + b Log(DBH) and W = a (DBH
2H)
bor Log W = a + b Log(DBH
2H). Given that biomass growth is strongly related to the trunk diameter and height, the allometric model as a nondestructive method is useful for estimating the entire or partial weight of a tree from the measurable tree dimensions including diameter at breast height (DBH) or DBH and height together (Lee, 2004; Lee et al ., 2004).
However, this allometric relationship varies according to the specific site and species (Table 1).
The biomass data from publications was analyzed, and the mean aboveground biomass, mean belowground biomass and root/shoot ratio values were calculated for each age class (from II to VI) of different forest types (Table 2).
In general, the mean aboveground biomass for all forest types increased significantly with age class, while the mean belowground biomass increased slightly with age class. The root/shoot ratio values fluctuated significantly between 0.180 and 0.344 for deciduous forests compared to that for coniferous and mixed forests, partly because of a small number of published data sources for age class II of deciduous forests.
Y (1 R+ )DefgAefg
g 1=
∑
5 f 1=∑
3 e 1=∑
16=
Ta ble 1. A llo me tric m od els fo r th e ma jor tr ee s pe cie s o f Ko rea n fo res ts ba sed on D BH or DB H
2H (DB H: dia me ter at br ea st he igh t. H: he ight.
Ws: s tem dr y wei gh t in k g.
Wa: ab ov eg rou nd d ry w eig ht i n k g.
Wb: b elowg roun d dr y we ight in kg ). Qu ercus m on go lic a Querc us se rrat a Log
Ws= 5. 600+ 1.002L og(DBH
2H)
r2= 0.99 0,
n= 7, Kwon and Lee (200 6a )
Wa= 2 .300DBH
2.257 r2= 0.9 90,
n= 9, Pa rk and Le e (2002) Log
Ws= 5. 397+ 1.04 5Log(DBH
2H)
r2= 0. 980,
n= 6, Kwon and Le e (2006a )
Wa= 1 .904DBH
2.519 r2= 0.9 90 ,
n= 9, Pa rk and Le e (2002) Log
Ws= 5. 691+ 0.97 4 L og(DBH
2H)
r2= 0. 990,
n= 7, Kwon and Le e (2006a )
Wa= 1 .869DBH
2.602 r2= 0.9 90,
n= 9, Pa rk and Le e (2002) Log W
s= 5.464 +1. 1.03 4Log(DBH
2H)
r2= 0. 990,
n= 6, Kwon and Le e (2006a ) Log
Wa= 2.1 16+2. 446L og(DBH)
r2= 0. 990,
n= 10, Pa rk a nd M oon (1 994) Log
Ws= 5. 765+ 0.94 9Log(DBH
2H)
r2= 0.990,
n= 6, Kw on and L ee (2 006a) Que rcu s ac uti ssima Log
Wa= 5.522+ 1.035Lo g(DBH
2H)
r2= 0. 990,
n= 5, Kwon and Le e (2006 a) Lo g
Wa= 2. 094+ 2.417 Log(DBH)
r2= 0.9 90,
n= 10 , Park and Moon (1994) Log
Wa= 2.076+ 2.579Lo g(DBH)
r2= 0. 955
n= 10, Pa rk e t al. (2003) Lo g
Wa= 1. 799+ 2.693 Log(DBH)
r2= 0.9 94,
n= 10 , Park
et al.(1996)
Wa= 1. 909DBH
2.410 r2= 0. 980,
n= 9, Park (200 3) Lo g
Wa= -1. 009+ 2.57 4Log(DBH)
r2= 0.978 ,
n= 15, No h
et al.(20 07)
Wa= 1. 745DBH
2.587 r2=0.990 ,
n=9, Park (2003) Lo g
Wb= -0.6 34+1. 772L og(DBH)
r2= 0 .962,
n= 7, Noh
et al.(2007)
Wa= 1. 865DBH
2.486r2= 0. 980,
n= 9, Pa rk ( 2003) Pinus de nsifl ora
Wa= 1. 002DBH
3.866H
-2.746 r2= 0. 98,
n= 10 , Song and Le e (1996)
Wa= 0 .0007DBH
1.951H
2.142 r2= 0.990,
n= 1 0, L ee (1985) Log
Wa= 1.982+ 2.546Lo g(DBH)
r2= 0. 97,
n= 1 0, Pa rk and Moon (1994) Lo g
Ws= 1.6 84 +0. 828L og(DBH
2H)
r2= 0. 990,
n= 5, Le e
et al. (20 06) Log
Wa= 2.144+ 2.366Lo g(DBH)
r2= 0. 994,
n= 10, Pa rk e t al. (1996) Lo g
Wa= 2. 582+ 1.592 Log(DBH)
r2= 0.9 59,
n= 10 , Park and Kim (1989); Park and L ee (1990) Log
Ws= 1. 391+ 0.976Log(DBH
2H)
r2= 0.990,
n= 7, Kw on and L ee (2 006b) Log
Wb= 1 .787+ 1.730Log( DB H)
r2= 0. 969,
n= 3, Park a nd Kim (1989 ); Park an d L ee (19 90) Log
Ws= 1. 197+ 1.028Log(DBH
2H)
r2= 0.990,
n= 6, Kw on and L ee (2 006b) Lo g
Wa= 2.272+ 2.149 Log(DBH)
r2= 0.9 99,
n= 10 , Park and Kim (1989); Park and L ee (1990) Log
Ws= 1. 531+ 0.09 2Log(DBH
2H)
r2= 0.930,
n= 1 0, Le e and Kwon (200 6) Lo g
Wb= 1. 717+1. 972L og(DBH)
r2= 0.971 ,
n= 3, Pa rk and Kim (1989); Pa rk and Le e ( 1990) Log W
a= 1. 469+0. 992L og(DBH
2H)
r2= 0. 990,
n= 18, Kwon and Le e (2006b) Lo g
Wa= 2.269+ 2.152 Log(DBH)
r2=0 .996,
n=10, Park and Kim (1989); Park and L ee (1990) Log
Wa= 0.823+ 1.134Lo g(DBH
2H)
r2= 0. 990,
n= 6, Kwon and Le e ( 2006c ) Log
Wb= 2. 553+1. 210L og(DBH)
r2= 0.984 ,
n= 3, Pa rk and Kim (1989); Pa rk and Le e ( 1990) Log
Wa= 1.101+ 1.071Lo g(DBH
2H)
r2= 0. 990,
n= 9, Kwon and Le e ( 2006c ) Log
Wa= 1. 775+ 2.470Log(DBH)
r2= 0.9 98,
n= 10 , Park and Kim (1989); Park and L ee (1990) Log
Wa= 0.923+ 1.1 17L og(DBH
2H)
r2=0.990 ,
n= 5, K won and L ee (20 06c) Lo g
Wb= 1. 367+2. 099L og(DBH)
r2= 0.971 ,
n= 3, Pa rk a nd Kim (1989); Pa rk a nd Le e ( 1990) Log
Wa= 0.928+ 1.109Lo g(DBH
2H)
r2= 0. 990,
n= 5, Kwon and Le e ( 2006c ) Pinus rigi da Log
Ws= -1. 2854+ 0.9013Lo g(DBH)
r2= 0. 978,
n= 10, Le e a nd Pa rk (1987 ) Log
Ws= 1. 270+ 1.0 22 L og(DBH
2H)
r2= 0. 990,
n= 5, Kwon and Le e (2006d) Log
Wa= 2.102+ 2.360Lo g(DBH)
r2=0. 979,
n=10, Par k
et al.(2 00 5) Lo g
Ws= -1. 642+0 .977L og(DBH
2H)
r2= 0. 962,
n= 9, Le e
et al.(1985) Log
Wa= 2.234+ 2.518Lo g(DBH)
r2= 0. 988,
n= 10, Son
et al.(2004) Lo g
Ws= -1. 504+0 .928L og(DBH
2H)
r2= 0. 954,
n= 9, Le e
et al.(1985) Qu ercus v ar iabil is Pinus koraie ns is Log
Wa= 1.702+ 2.678Lo g(DBH)
r2= 0. 990,
n= 10, Pa rk
et al.(20 03) Lo g
Wa= 1.388+ 0.954 Log(DBH
2H)
r2= 0. 990,
n= 9, Kwon and Le e (2006e ) Log
Wa= 1.571+ 2.759Lo g(DBH)
r2= 0. 990,
n= 10, Pa rk
et al.(20 03) Lo g
Wa= -2. 679+ 2.48 6Log(DBH)
r2= 0. 978,
n= 5, Le e
et al.(2009) Log
Wa= 1.702+ 2.678Lo g(DBH)
r2= 0. 980,
n= 10, Pa rk a nd Lee (2001 ) Log
Wb= -1. 268+1 .638L og(DBH)
r2= 0.95 5,
n= 5, Le e
et al. (2009) Log
Wa= 1.329+ 2.823Lo g(DBH)
r2= 0. 973,
n= 10, Pa rk
et al.(20 03) Lo g
Ws= -1. 1579+ 0.9297 Log(DBH)
r2= 0.9 84,
n= 10 , Le e and Park (198 7) Log
Ws= 1. 606+ 0.868Log(DBH)
r2= 0. 9518,
n= 12, Kim a nd Jeong ( 1985) Log
Wa= -0.8 56+2. 386 Log( DB H)
r2= 0. 974,
n= 20 , S on
et al.(2001) Log
Ws= 1. 000+ 1.124Log(DBH)
r2= 0. 9845,
n= 12, Kim a nd Jeong ( 1985) Log
Ws= -1 .2889+ 1.2152L og(DBH )
r2= 0. 960,
n= 21, Y i (1998)
Wa= 1. 000DBH
2.925H
-1.638r2= 0. 980,
n= 10, Song and Le e (1996) Larix le ptol epis Log
Wa= 1.916+ 2.377Lo g(DBH)
r2= 0. 968,
n= 10, Cho i a nd P ark (1993) Lo g
Wa= -1. 175+ 2.58 0Log(DBH)
r2= 0. 991,
n= 15, Noh
et al.(2006 ) Log
Wa= 1.944+ 2.470Lo g(DBH)
r2= 0. 991,
n= 10, Pa rk
et al. (19 96) Lo g
Wb= -1. 648+2 .566L og(DBH)
r2= 0.95 5,
n= 5, No h
et al.(200 6) Log
Wa= 2.063+ 2.445Lo g(DBH)
r2= 0. 990,
n= 10, Pa rk a nd M oo n (19 94) Log
Wa= -0.7 26+2. 234L og(DBH )
r2= 0 .903,
n= 10, K im
et al.(1996) Log
Wa= 1.905+ 2.545Lo g(DBH)
r2= 0. 962,
n= 10, Pa rk
et al.(20 05) Lo g
Wa= -1. 071+ 2.45 9Log(DBH)
r2= 0. 975,
n= 25, Kim (20 08) Qu ercus de ntat a Lo g
Wb= -2. 097+2 .792L og(DBH)
r2= 0.92 0,
n= 1 0, Kim (2008) Log
Wa= 1.883+ 2.560 Log(DBH)
r2= 0.9 90,
n= 10, Park
et al.(1996)
676 Jour. Korean For. Soc. Vol. 99, No. 5 (2010)
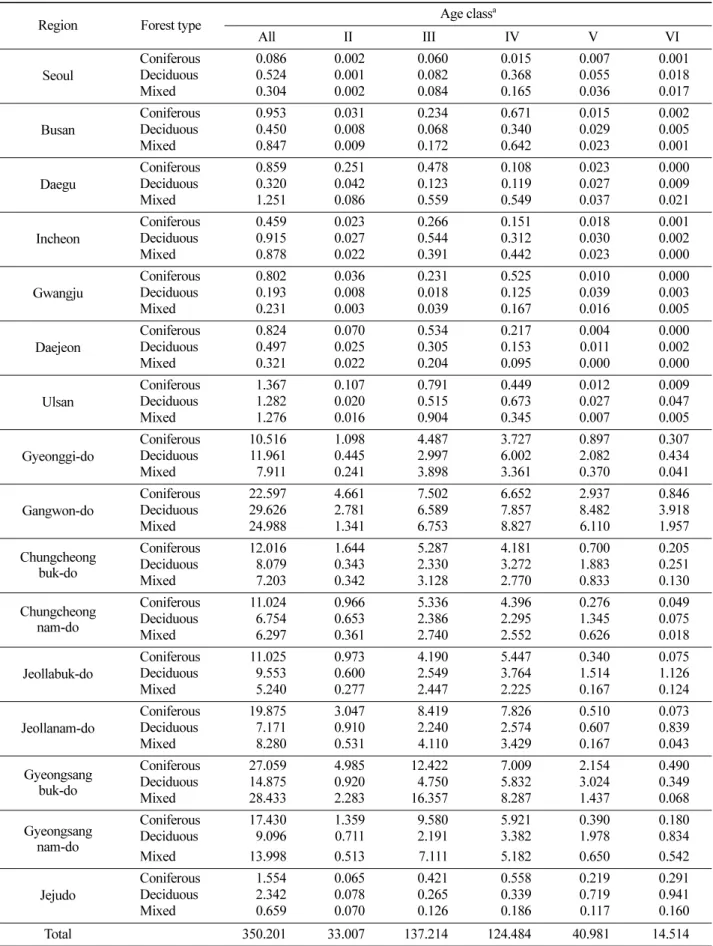
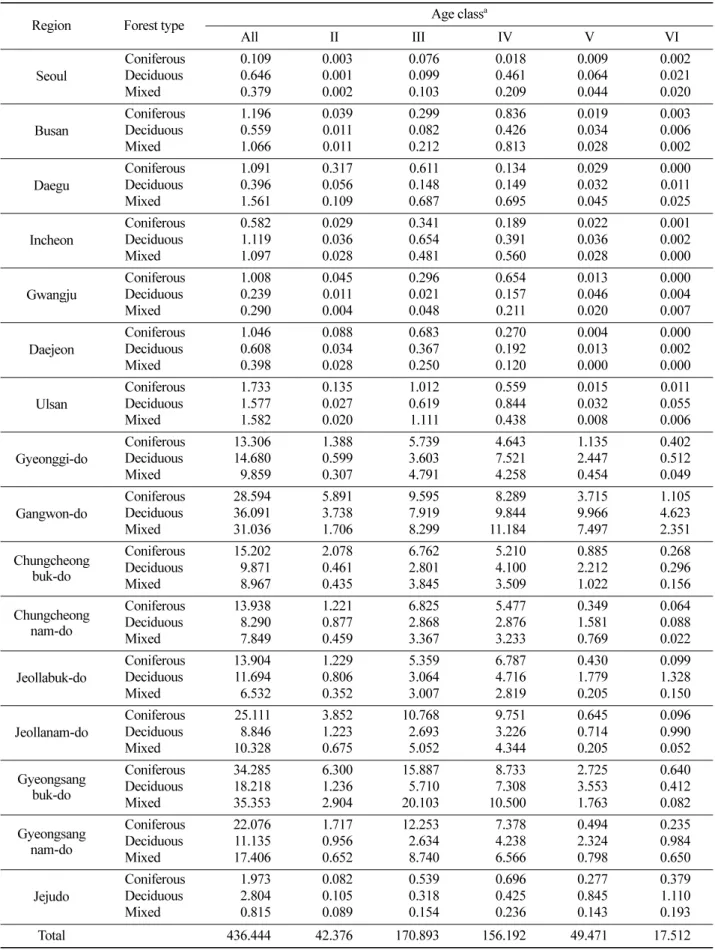
Because the forest inventories recorded detailed infor- mation on the total area and age class for each forest type according to the region, the regional aboveground and total biomass carbon storage were estimated for each age class of different forest types using equation (1) and the mean values in Table 2. Tables 3 and 4 summarize the regional aboveground and total biomass carbon stocks.
The distributions of the aboveground and total biomass carbon storage for all forest types showed regional differences. Gangwon-do and Gyeongsangbuk-do provinces markedly occupied greater aboveground (77.211 Tg C and 70.367 Tg C) and total biomass carbon storage (95.721 Tg C and 87.856 Tg C) for all forest types than the other regions, whereas Seoul city possessed the smallest aboveground and total biomass carbon storage (0.914 Tg C and 1.134 Tg C) of all forest types of all regions, mainly because Seoul city is primarily an industrial and urban hub holding the highest population density in Korea (Tak
et al., 2007). The aboveground and total biomass carbon storage of age classes III and IV for each region had higher values than those of the other age classes and also varied within each region.
Summing the aboveground and total biomass carbon storage of age classes III and IV for all regions, the ratios of the aboveground and total biomass carbon storage to the corresponding national biomass carbon storage were 74.4% and 74.9%. In other words, age classes III and IV made major contributions to carbon sequestration by Korean forests, which is also in accordance with the statistical documents. Statistical Yearbook of Forestry (2009) demonstrated that the ratios of the total area and total stem volume of age classes III and IV to that of all
age classes were 67.2% and 71.4%.
Discussion
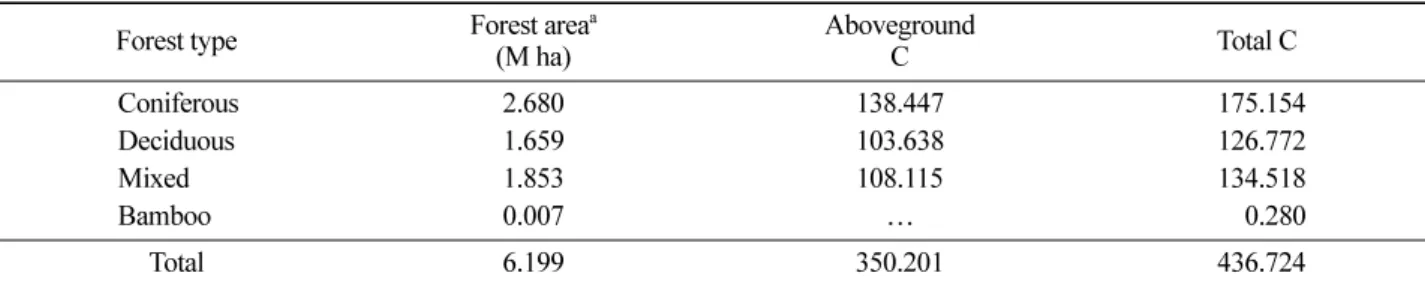
The aboveground and total biomass carbon storage for all forest types of Korea were 350.201 Tg C and 436.724 Tg C in 2009 (Table 5). Such large carbon storage in Korean forests is due mainly to the contribution of active plantation growth and management practices. Over the past four decades, plantations by nationwide reforestation have accounted for more than 70% of the observed carbon storage (261.698 Tg C for the aboveground biomass and 327.085 Tg C for the total biomass of age classes III and IV). Choi
et al. (2002) estimated a carbon content of 200 Tg C in the total Korean forest biomass during the period 1973-2000 and reported an annual uptake rate of 12 Tg C yr
−1in the late 1990s after the 30-year forest restoration programs. If this annual uptake rate is used to estimate the carbon changes in Korean forests since 2000 while the forest growth rates vary within different periods, the estimated value of 320 Tg C in 2009 was still lower than the present result (436.724 Tg C). The discrepancy between values might result from the different methods used. For example, Choi
et al. (2002) used the biomass expansion factor method to estimate the carbon content in the total Korean forest biomass based on the stem volume data.
The land-based Global Forest Resources Assessment 2005 (FRA2005), released by the UN Food and Agri- culture Organization (FAO 2006) who has been coordi- nating global forest resources assessments every five to ten years since 1946, provides available information on the forest biomass carbon storage of Democratic Peo- Table 2. Mean aboveground biomass densities (Mg ha
−1), mean belowground biomass densities and root/shoot ratio values for the different forest types in the different age classes based on the publications in Korea (n: data numbers, SD:
standard deviation).
classAge a
Coniferous forests Deciduous forests Mixed forests
Above-
ground Below-
ground R Above-
ground Below-
ground R Above-
ground Below-
ground R
II 46.221
(n = 11, SD = 19.583)
12.484 (n = 9, SD = 6.418)
0.264 (n = 9, SD = 0.078)
52.500 (n = 2, SD = 19.091)
22.700
(n = 1) 0.344 (n = 1)
47.187 (n = 13, SD = 18.855)
13.506 (n = 10, SD = 6.859)
0.272 (n = 10, SD = 0.077) III 116.340
(n = 11, SD = 48.444)
40.206 (n = 5, SD = 21.911)
0.279 (n = 5, SD = 0.063)
113.880 (n = 9, SD = 65.836)
29.408 (n = 6, SD = 8.498)
0.202 (n = 6, SD = 0.055)
115.230 (n = 20, SD = 55.333)
34.316 (n = 11, SD = 16.121)
0.229 (n = 11, SD = 0.067) IV 145.620
(n = 16, SD = 64.549)
33.303 (n = 10, SD = 20.715)
0.246 (n = 10, SD = 0.084)
136.49 (n = 23, SD = 84.580)
36.999 (n = 15, SD = 13.840)
0.253 (n = 15, SD = 0.073)
136.120 (n = 41, SD = 76.515)
34.901 (n = 27, SD = 16.119)
0.267 (n = 27, SD = 0.096)
V 137.310
(n = 8, SD = 62.386)
37.784 (n = 7, SD = 20.732)
0.265 (n = 7, SD = 0.069)
178.270 (n = 8, SD = 70.474)
36.449 (n = 5, SD = 4.154)
0.175 (n = 5, SD = 0.029)
157.790 (n = 16, SD = 67.686)
37.228 (n = 12, SD = 15.531)
0.227 (n = 12, SD = 0.071) VI 185.710
(n = 4, SD = 97.873)
42.693 (n = 2, SD = 12.959)
0.306 (n = 2, SD = 0.063)
204.750 (n = 14, SD = 88.019)
41.291 (n = 10, SD = 8.551)
0.180 (n = 10, SD = 0.024)
193.610 (n = 17, SD = 85.145)
41.525 (n = 12, SD = 8.683)
0.201 (n = 12, SD = 0.057)
a
Age class means that the forest ages are younger than 20 years old for class II, 30 years old for class III, 40 years old for class IV, 50
years for class V and over 50 years old for class VI.
Table 3. Regional distribution of aboveground biomass carbon storage (Tg C) for the different forest types in the different age classes in Korea.
Region Forest type Age class
aAll II III IV V VI
Seoul Coniferous 0.086 0.002 0.060 0.015 0.007 0.001
Deciduous 0.524 0.001 0.082 0.368 0.055 0.018
Mixed 0.304 0.002 0.084 0.165 0.036 0.017
Busan Coniferous 0.953 0.031 0.234 0.671 0.015 0.002
Deciduous 0.450 0.008 0.068 0.340 0.029 0.005
Mixed 0.847 0.009 0.172 0.642 0.023 0.001
Daegu Coniferous 0.859 0.251 0.478 0.108 0.023 0.000
Deciduous 0.320 0.042 0.123 0.119 0.027 0.009
Mixed 1.251 0.086 0.559 0.549 0.037 0.021
Incheon Coniferous 0.459 0.023 0.266 0.151 0.018 0.001
Deciduous 0.915 0.027 0.544 0.312 0.030 0.002
Mixed 0.878 0.022 0.391 0.442 0.023 0.000
Gwangju Coniferous 0.802 0.036 0.231 0.525 0.010 0.000
Deciduous 0.193 0.008 0.018 0.125 0.039 0.003
Mixed 0.231 0.003 0.039 0.167 0.016 0.005
Daejeon Coniferous 0.824 0.070 0.534 0.217 0.004 0.000
Deciduous 0.497 0.025 0.305 0.153 0.011 0.002
Mixed 0.321 0.022 0.204 0.095 0.000 0.000
Ulsan Coniferous 1.367 0.107 0.791 0.449 0.012 0.009
Deciduous 1.282 0.020 0.515 0.673 0.027 0.047
Mixed 1.276 0.016 0.904 0.345 0.007 0.005
Gyeonggi-do Coniferous 10.516 1.098 4.487 3.727 0.897 0.307
Deciduous 11.961 0.445 2.997 6.002 2.082 0.434
Mixed 7.911 0.241 3.898 3.361 0.370 0.041
Gangwon-do Coniferous 22.597 4.661 7.502 6.652 2.937 0.846
Deciduous 29.626 2.781 6.589 7.857 8.482 3.918
Mixed 24.988 1.341 6.753 8.827 6.110 1.957
Chungcheong buk-do
Coniferous 12.016 1.644 5.287 4.181 0.700 0.205
Deciduous 8.079 0.343 2.330 3.272 1.883 0.251
Mixed 7.203 0.342 3.128 2.770 0.833 0.130
Chungcheong nam-do
Coniferous 11.024 0.966 5.336 4.396 0.276 0.049
Deciduous 6.754 0.653 2.386 2.295 1.345 0.075
Mixed 6.297 0.361 2.740 2.552 0.626 0.018
Jeollabuk-do Coniferous 11.025 0.973 4.190 5.447 0.340 0.075
Deciduous 9.553 0.600 2.549 3.764 1.514 1.126
Mixed 5.240 0.277 2.447 2.225 0.167 0.124
Jeollanam-do Coniferous 19.875 3.047 8.419 7.826 0.510 0.073
Deciduous 7.171 0.910 2.240 2.574 0.607 0.839
Mixed 8.280 0.531 4.110 3.429 0.167 0.043
Gyeongsang buk-do
Coniferous 27.059 4.985 12.422 7.009 2.154 0.490
Deciduous 14.875 0.920 4.750 5.832 3.024 0.349
Mixed 28.433 2.283 16.357 8.287 1.437 0.068
Gyeongsang nam-do
Coniferous 17.430 1.359 9.580 5.921 0.390 0.180
Deciduous 9.096 0.711 2.191 3.382 1.978 0.834
Mixed 13.998 0.513 7.111 5.182 0.650 0.542
Jejudo Coniferous 1.554 0.065 0.421 0.558 0.219 0.291
Deciduous 2.342 0.078 0.265 0.339 0.719 0.941
Mixed 0.659 0.070 0.126 0.186 0.117 0.160
Total 350.201 33.007 137.214 124.484 40.981 14.514
a
Age class means that the forest ages are younger than 20 years old for class II, 30 years old for class III, 40 years old for class IV, 50
years for class V and over 50 years old for class VI. A factor of 0.5 was used to convert carbon content from biomass.
678 Jour. Korean For. Soc. Vol. 99, No. 5 (2010)
Table 4. Regional distribution of total biomass carbon storage (Tg C) for the different forest types in the different age classes in Korea.
Region Forest type Age class
aAll II III IV V VI
Seoul Coniferous 0.109 0.003 0.076 0.018 0.009 0.002
Deciduous 0.646 0.001 0.099 0.461 0.064 0.021
Mixed 0.379 0.002 0.103 0.209 0.044 0.020
Busan Coniferous 1.196 0.039 0.299 0.836 0.019 0.003
Deciduous 0.559 0.011 0.082 0.426 0.034 0.006
Mixed 1.066 0.011 0.212 0.813 0.028 0.002
Daegu Coniferous 1.091 0.317 0.611 0.134 0.029 0.000
Deciduous 0.396 0.056 0.148 0.149 0.032 0.011
Mixed 1.561 0.109 0.687 0.695 0.045 0.025
Incheon Coniferous 0.582 0.029 0.341 0.189 0.022 0.001
Deciduous 1.119 0.036 0.654 0.391 0.036 0.002
Mixed 1.097 0.028 0.481 0.560 0.028 0.000
Gwangju Coniferous 1.008 0.045 0.296 0.654 0.013 0.000
Deciduous 0.239 0.011 0.021 0.157 0.046 0.004
Mixed 0.290 0.004 0.048 0.211 0.020 0.007
Daejeon Coniferous 1.046 0.088 0.683 0.270 0.004 0.000
Deciduous 0.608 0.034 0.367 0.192 0.013 0.002
Mixed 0.398 0.028 0.250 0.120 0.000 0.000
Ulsan Coniferous 1.733 0.135 1.012 0.559 0.015 0.011
Deciduous 1.577 0.027 0.619 0.844 0.032 0.055
Mixed 1.582 0.020 1.111 0.438 0.008 0.006
Gyeonggi-do Coniferous 13.306 1.388 5.739 4.643 1.135 0.402
Deciduous 14.680 0.599 3.603 7.521 2.447 0.512
Mixed 9.859 0.307 4.791 4.258 0.454 0.049
Gangwon-do Coniferous 28.594 5.891 9.595 8.289 3.715 1.105
Deciduous 36.091 3.738 7.919 9.844 9.966 4.623
Mixed 31.036 1.706 8.299 11.184 7.497 2.351
Chungcheong buk-do
Coniferous 15.202 2.078 6.762 5.210 0.885 0.268
Deciduous 9.871 0.461 2.801 4.100 2.212 0.296
Mixed 8.967 0.435 3.845 3.509 1.022 0.156
Chungcheong nam-do
Coniferous 13.938 1.221 6.825 5.477 0.349 0.064
Deciduous 8.290 0.877 2.868 2.876 1.581 0.088
Mixed 7.849 0.459 3.367 3.233 0.769 0.022
Jeollabuk-do Coniferous 13.904 1.229 5.359 6.787 0.430 0.099
Deciduous 11.694 0.806 3.064 4.716 1.779 1.328
Mixed 6.532 0.352 3.007 2.819 0.205 0.150
Jeollanam-do Coniferous 25.111 3.852 10.768 9.751 0.645 0.096
Deciduous 8.846 1.223 2.693 3.226 0.714 0.990
Mixed 10.328 0.675 5.052 4.344 0.205 0.052
Gyeongsang buk-do
Coniferous 34.285 6.300 15.887 8.733 2.725 0.640
Deciduous 18.218 1.236 5.710 7.308 3.553 0.412
Mixed 35.353 2.904 20.103 10.500 1.763 0.082
Gyeongsang nam-do
Coniferous 22.076 1.717 12.253 7.378 0.494 0.235
Deciduous 11.135 0.956 2.634 4.238 2.324 0.984
Mixed 17.406 0.652 8.740 6.566 0.798 0.650
Jejudo Coniferous 1.973 0.082 0.539 0.696 0.277 0.379
Deciduous 2.804 0.105 0.318 0.425 0.845 1.110
Mixed 0.815 0.089 0.154 0.236 0.143 0.193
Total 436.444 42.376 170.893 156.192 49.471 17.512
a
Age class means that the forest ages are younger than 20 years old for class II, 30 years old for class III, 40 years old for class IV, 50
years for class V and over 50 years old for class VI. A factor of 0.5 was used to convert carbon content from biomass.
ple's Republic of Korea and Mongolia. This study used the data set from the FRA2005 and summarized the national total biomass carbon storage of East Asian countries to compare the size of carbon storage with Korea (Table 6). With a total forest area of 244.796 M ha for these countries, the total carbon storage was 9230.724 Tg C, and the mean carbon density was 54.193 Mg C ha
−1. With a relatively small forest area, the carbon storage in Korean forest biomass was 436.724 Tg C, comprising approximately 1/20 of the total carbon storage of East Asian countries. Although the mean carbon density of Korea did not surpass Japan, Korea had the largest carbon sequestration rate of 1.5 Mg C ha
−1yr
−1in the late 1990s due to its reforestation and forest management practices (Choi
et al., 2002). The largest carbon storage in Chinese forest biomass was also due to extensive reforestation efforts (Fang
et al., 2001). Followed by China, the large carbon storage in Japan was a result of plantation regrowth, which accounted for approximately 80% of the observed carbon sinks by forest with a typical oceanic climate for plant growth (Fang
et al., 2005). Although Mongolia has slightly greater forest biomass carbon storage than Korea, almost half of its land com- prises the Gobi desert, which has lesser < 10% forest cover. The Democratic People's Republic of Korea has higher forest cover than China and Mongolia but the lowest forest biomass C storage.
To estimate the forest sector carbon budget, the fol- lowing four carbon pools are necessary: (1) down dead wood, (2) forest floor, (3) soil organic C, and (4) forest
products (Woodbury
et al., 2007). With the exception of forest products, there is no information on the other three carbon pools at the national level in Korea. However, the ratios of carbon pools examined in the United States could be used to approximate the carbon budget in the Korean forest sector due to the similar climatic conditions compared to the eastern United States. The ratios of carbon storage in the United States for living vegetation (trees and understory), down dead wood, forest floor, soil organic carbon and forest products (wood products and landfilled wood) were 0.36, 0.03, 0.08, 0.48 and 0.05, respectively (Woodbury
et al., 2007). If this ratio is used to estimate the carbon storage in different pools, then the nonliving carbon storage may be 776.398 Tg C, and the total carbon storage for the whole forest sector in Korea could be 1213.122 Tg C, of which 436.724 Tg C is stored in forest biomass. This is substantial carbon storage considering the land area of Korea.
Acknowledgements
This work was supported in part by the Forest Science and Technology Project (No. S1107L0101) provided by Korea Forest Service and Institute of Forest Science of Kangwon National University.
Literature Cited
1. Choi, S.-D., Lee, K. and Chang, Y.-S. 2002. Large rate Table 5. Forest area, aboveground and total biomass carbon storage (Tg C) of the different forest types in Korea.
Forest type Forest area
a(M ha) Aboveground
C Total C
Coniferous 2.680 138.447 175.154
Deciduous 1.659 103.638 126.772
Mixed 1.853 108.115 134.518
Bamboo 0.007 … 0.280
Total 6.199 350.201 436.724
a
Excluding non-wooded land (Statistical Yearbook of Forestry 2009). A factor of 0.5 was used to convert carbon content from biomass.
Table 6. Estimation of forest biomass carbon storage of East Asian countries.
Country Forest area
(M ha) Ratio (%) of forest
area to land area Total carbon in forest
biomass (Tg C) Mean biomass carbon
density (Mg ha
−1) Reference
China 197.290 21.200 6096 30.899 FAO (2006)
Democratic People's
Republic of Korea 6.187 51.400 232 37.498 FAO (2006)
Japan 24.868 68.200 1892 76.082 FAO (2006)
Mongolia 10.252 6.500 574 55.989 FAO (2006)
Republic of Korea 6.199 62.096 436.724 70.451 This study
Total 244.796 9230.724
Mean 41.879 54.184
680 Jour. Korean For. Soc. Vol. 99, No. 5 (2010)
of uptake of atmospheric carbon dioxide by planted for- est biomass in Korea. Global Biogeochemical Cycles 16(4), 1089, doi: 10.1029/2002GB001914.
2. Choi, Y.C. and Park, I.H. 1993. Biomass and net production of a natural Quercus variabilis forest and a Populus alba × P . glandulosa Plantation at Mt. Mohu area in Chonnam. Journal of Korean Forest Society 82(2): 188- 3. Fang, J.Y., Chen, A.P., Peng, C., Zhao, S.Q. and Ci, L.J. 194.
2001. Changes in forest biomass carbon storage in China between 1949 and 1998. Science 292: 2320-2322.
4. Fang, J.Y., Oikawa, T., Kato, T., Mo, W. and Wang, Z.H.
2005. Biomass carbon accumulation by Japan’s forests from 1947 to 1995. Global Biogeochemical Cycles 19, GB2004, doi: 10.1029/2004GB002253.
5. FAO. 2006. Global Forest Resources Assessment 2005, Main Report. FAO Forestry Paper 147, Annex 3 Global tables, FAO, Rome.
6. Fang, J.Y., Brown, S., Tang,Y.H., Nabuurs, G.J., Wang, X.P. and Shen, H.H. 2006. Overestimated biomass car- bon pools of the northern mid- and high latitude for- ests. Climatic Change 74: 355-368.
7. Goodale, C.L., Apps, M.J., Birdsey, R.A., Field, C.B., Heath, L.S., Houghton, R.A., Jenkins, J.C., Kohlmaier, G.H., Kurz, W., Liu, S., Nabuurs, G.-J., Nilsson, S. and Shvidenko, A.Z. 2002. Forest carbon sinks in the Northern Hemisphere. Ecological Applications 12: 891- 8. Houghton, R.A. 2005. Aboveground forest biomass and 899.
the global carbon balance. Global Change Biology 11:
945-958.
9. Hwang, J.H., Lee, S.T., Kim, B.B., Shin, H.C., Lee, K.J. and Park, K.J. 2005. Estimation of aboveground biomass and belowground Nutrient contents for a Phyl- lostachys pubescens stand. Journal of Korean Forest Society 94(3): 161-167.
10. Janssens, I.A., Freibauer, A., Ciais, P., Smith, P., Nab- uurs, G.-J., Folberth, G., Schlamadinger, B., Hutjes, R.W.A., Ceulemans, R., Schulze, E.D., Valentini, R. and Dol- man, A.J. 2003. Europe’s terrestrial biosphere absorbs 7 to 12% of European anthropogenic CO
2emission.
Science 300: 1538-1542.
11. Kim, S.K. and Jeong, J.Y. 1985. A study on the pro- duction structure and biomass productivity of Quercus variabilis natural forest. Journal of Korean Forest Soci- ety 70: 91-102.
12. Kim, J.-S., Son, Y.H., Lim, J.-H. and Kim, Z.-S. 1996.
Aboveground biomass, N and P distribution, and litter- fall in Pinus rigida and Larix leptolepis plantations.
Journal of Korean Forest Society 85(3): 416-425.
13. Korea Forest Service. 2000. Forest basic statistical sur- vey guideline, Seoul, Republic of Korea.
14. Kwon, K.-C. and Lee, D.K. 2006a. Biomass and annual net production of Quercus mongolica stands in Mt.
Joongwang with respect to altitude and aspect. Journal of Korean Forest Society 95(4): 398-404.
15. Kwon, K.-C. and Lee, D.K. 2006b. Above- and below- ground biomass and energy content of Quercus mon- golica . Journal of Korean Forest Energy Society 25(1):
31-38.
16. Kwon, K.-C. and Lee, D.K. 2006c. Biomass and energy content of Quercus mongolica stands in Gwangyang and Jeju areas. Journal of Korean Wood Science Soci- ety 34(4): 54-65.
17. Kwon K-C and Lee DK (2006d) Biomass and energy content of Pinus rigida stand in Gwangju, Gyeonggi province. Journal of Korean Forest Energy Society 25(1): 39-45.
18. Kwon, K.-C. and Lee, D.K. 2006e. Biomass and energy content of Pinus koraiensis stand planted in Mt. Wolak.
Journal of Korean Wood Science Society 34(4): 66-75.
19. Kim, D.H. 2008. Biomass, carbon and nitrogen storage in an age-sequence of Larix leptolepis stands in Korea.
Dissertation, Korea University.
20. Lee, S.W. 1985. Biomass and net primary productivity of Pinus densiflora natural ecosystem in Kangwon, Korea. Journal of Korean Forest Society 71: 74-81.
21. Lee, K.J., Kim, K.D., Kim, J.S. and Park, I.H. 1985.
Distribution of biomass and production of Pinus rigida and Pinus rigida×taeda plantation in Kwangju district.
Journal of Korean Forest Society 69: 28-35.
22. Lee, K.J. and Park, I.H. 1987. Primary production and nutrients distribution in 22-year-old Pinus koraiensis and Quercus mongolica stands in Kwangju. Journal of Korean Forest Energy Society 7(1): 11-21.
23. Liski, J., Korotkov, A.V., Prins, C.F.L., Karjalainen, T., Victor, D.G. and Kauppi, P.E. 2003. Increased carbon sink in temperate and boreal forests. Climatic Change 61: 89-99.
24. Lee, D.H. 2004. Estimating above- and below-ground biomass from diameter of breast height and height for the Pinus densiflora Sieb. et Zucc. Journal of Korean Forest Society 93(3): 242-250.
25. Lee, W.K., Gadow, K.V., Chung, D.J., Lee, J.L. and Shin, M.Y. 2004. DBH growth for Pinus densiflora and Quercus variabilis mixed forests in central Korea. Eco- logical Modelling 176: 187-200.
26. Lee, D.K. and Kwon, K.-C. 2006. Biomass and net pri- mary production of Quercus mongolica stands in Pyungchang and Jecheon areas. Journal of Korean For- est Society 95(3): 309-315.
27. Lee, D.K., Kim, Y.-S. and Kwon, K.-C. 2006. Biomass and energy content of Pinus densiflora stand in Mt.
Wolak, Chungbuk province. Journal of Korean Forest Energy Society 25(1): 24-30.
28. Lee, Y.-J., Seo, Y.-O., Park, S.-M., Pyo, J.-K., Kim, R.H.,
Son, Y.M., Lee, K.-H. and Kim, H.H. 2009. Estimation
of biomass for 27 years old Korean pine ( Pinus koraiensis )
plantation in Gangneung, Gangwon province. Journal of Korean Agrculture and Life Science 43(1): 1-8.
29. Nabuurs, G.J., Goodale, C., Schelhaas, M.J., Mohren, G.M.J. and Field, C.B. 2003. Temporal evolution of the European forest sector carbon sink from 1950 to 1999.
Global Change Biology 9: 152-160.
30. Noh, N.J., Son, Y.H., Kim, J.S., Kim, R.H., Seo, K.Y., Seo, K.W., Koo, J.W., Kyung, J.H., Park, I.H., Lee, Y.J., Son, Y.M. and Lee, K.H. 2006. A study on esti- mation of biomass, stem density and biomass expan- sion factor for stand age classes of Japanese larch ( Larix leptolepis ) stands in Gapyeong area. Journal of Korean Forest Energy Society 25(1): 1-8.
31. Noh, N.J., Son, Y.H., Kim, R.H., Seo, K.W., Koo, J.W., Park, I.H., Lee, K.H. and Son, Y.M. 2007. Biomass accumulations and the distribution of nitrogen and phosphorus within three Quercus acutissima stands in central Korea. Journal of Plant Biology 50(4): 461-466.
32. Park, I.H. and Kim, J.S. 1989. Biomass regression of Pinus densiflora natural forests of four local forms in Korea. Journal of Korean Forest Society 78(3): 323- 33. Park, I.H. and Lee, S.M. 1990. Biomass and net pro- 330.
duction of Pinus densiflora natural forests of four local forms in Korea. Journal of Korean Forest Society 79(2):
196-204.
34. Park, I.H. and Moon, G.S. 1994. Biomass, net produc- tion and biomass estimation equations in some natural Quercus forests. Journal of Korean Forest Society 83(2): 246-253.
35. Park, I.H., Lee, D.K., Lee, K.J. and Moon, G.S. 1996.
Growth, biomass and net production of Quercus species (1)-With reference to natural stands of Quercus variabilis , Q. acutissima , Q. dentata , and Q. mongolica in Kwangju, Kyonggi-do. Journal of Korean Forest Society 85(1): 76-83.
36. Park, I.H. and Ryu, S.B. 1996. Biomass, net production and nutrient distribution of bamboo Phyllostachy stands in Korea. Journal of Korean Forest Society 85(3): 453- 37. Park, G.-S. and Lee, S.-W. 2001. Biomass and net pri- 461.
mary production of Quercus variabilis natural forest ecosystems in Gongju, Pohang, and Yangyang areas.
Journal of Korean Forest Society 90(6): 692-698.
38. Park, G.-S. and Lee, S.-W. 2002. Biomass and net pri- mary production of Quercus serrata natural stands in
Kwangyang, Muju, and Pohang areas. Journal of Korean Forest Society 91(6): 714-721.
39. Park, I.H., Seo, Y.K., Kim, D.Y., Son, Y.H., Yi, M.J.
and Jin, H.O. 2003. Biomass and net production of a Quercus mongolica stand and a Quercus variabilis stand in Chuncheon, Kangwon-do. Journal of Korean Forest Society 92(1): 52-57.
40. Park, G.-S. 2003. Biomass and net primary production of Quercus mongolica stands in Kwangyang, Pyungchang, and Youngdong areas. Journal of Korean Forest Society 92(6): 567-574.
41. Park, I.H., Son, Y.H., Kim, D.Y., Jin, H.O., Yi, M.J., Kim, R.H. and Hwang, J.O. 2005. Biomass and pro- duction of a naturally regenerated oak forest in south- ern Korea. Ecological Research 20: 227-231.
42. Song, C.Y. and Lee, S.W. 1996. Biomass and net pri- mary production in natural forests of Quercus mongol- ica and Quercus variabilis . Journal of Korean Forest Society 85(3): 443-452.
43. Son, Y.H., Hwang, J.W., Kim, Z.S., Lee, W.K. and Kim, J.S. 2001. Allometry and biomass of Korean pine ( Pinus koraiensis ) in central Korea. Bioresource Technology 78: 251-255.
44. Shin, J.-H. 2002. Ecosystem geography of Korea. In:
Lee DW, Jin V, Choe JC, Son YH, Lee H-Y, Hong S- K, Ihm B-S (Ed) Ecology of Korea, Bumwoo Publish- ing Company, Seoul, pp.19-46.
45. Son, Y.H., Park, I.H., Yi, M.J., Jin, H.O., Kim, D.Y., Kim, R.H. and Hwang, J.O. 2004. Biomass, production and nutrient distribution of a natural oak forest in cen- tral Korea. Ecological Research 19: 21-28.
46. Statistical Yearbook of Forestry. 2009. Korean Forest Service, Seoul, Republic of Korea.
47. Tak, K., Chun, Y. and Wood, P.M. 2007. The South Korean forest dilemma. International Forestry Review 9: 548-557.
48. Woodbury, P.B., Smith, J.E. and Heath, L.S. 2007. Car- bon sequestration in the U.S. forest sector from 1990 to 2010. Forest Ecology and Management 241: 14-27.
49. Yi, M.J. 1998. Changes in aboveground biomass and nutrient accumulation of the Korean pine ( Pinus koraien- sis ) plantation by stand age at Kangwondo province.
Journal of Korean Forest Society 87(2): 276-285.
(Received March 31, 2010; Accepted May 10, 2010)