†교신저자:Seung-Jin Kim (School of Textiles, Yeungnam University) E-mail:[email protected]
TEL:053-810-2771 FAX:053-812-5702
Fabric Weave Structural Design of the Woven Fabrics
직물의 설계 디자인
Seung-Jin Kim*†
김승진*†
School of Textiles, Yeungnam University*
영남대학교 섬유패션학부*
Abstract
This paper surveys basic research for data base system of the fabric structural design. For this purpose, the weave density coefficients of the worsted and cotton fabrics are analysed and discussed with cover factors suggested by Prof. Walz and Picanol company. And the relationship between weave density coefficients and cover factors of the worsted and cotton woven fabrics was analysed and discussed with weave pattern and yarn count. Finally, the process shrinkages of dyeing and finishing processes according to the weave density coefficients of the worsted and cotton fabrics were analysed and discussed as a preliminary study for the data base system of the fabric structural design. As a result, the density coefficients, K values of the worsted and cotton fabrics were ranged from 600 to 1000, and the weave density coefficients of those fabrics are ranged from 0.4 to 0.8 and from 0.2 to 1.0, respectively. The finishing shrinkages for the worsted fabrics are ranged from 2% to 10%, and for cotton fabrics, it was from 2% to 20%. The weave density coefficients of the worsted and cotton fabrics could be distributed according to the looms, weave pattern and weaving and finishing shrinkages as a concept of the data base for the fabric structural design.
Keywords : data base, weave density coefficient, weave factor, cover factor, process shrinkage
요 약
본 연구는 직물구조 디자인의 데이터 베이스에 대한 기초 연구를 수행한다. 이를 위해서 소모직물과 면직 물들의 직물밀도계수가 월츠 교수와 피카놀 회사에서 제안된 커버팩터와 관련시켜 분석되고 토의된다. 또한 소모직물과 면직물의 직물밀도계수와 커버팩터와의 관계가 직물조직과 실의 번수에 따라 분석․토의된다. 끝 으로 이들 천연직물들의 염색․가공공정에서의 공정수축률이 직물밀도계수와 함께 직물구조 디자인의 데이터 베이스 시스템의 예비 연구로서 분석․토의된다. 그 결과는 소모직물과 면직물의 밀도계수, K 값은 600에서 1000까지 분포하였으며 이들 직물들의 직물밀도계수는 0.4에서 0.8 그리고 0.2에서 1.0의 범위에서 각각 분포 하였다. 모직물의 가공축은 2%에서 10% 그리고 면직물의 가공축은 2%에서 20%까지 분포하였다. 그리고 모 직물과 면직물의 직물밀도계수는 직물구조디자인에 대한 데이터 베이스의 개념으로서 직기와 직물구조 그리 고 직축과 가공축에 따라서 분포됨을 보여주었다.
주제어 : 데이터베이스, 직물밀도계수, 조직팩터, 커버팩터, 공정수축
1. Introduction
There were many tries for linking with visual wearing system of garment using fabric mechanical properties, and also there are many CAD systems such as fabric design CAD and pattern design CAD using many data bases on the computer(http://www.i-designer.co.kr;
http://www.texclub.com). But there is no fabric structural design data base system linked with fabric physical properties and process conditions. This is due to too many factors considered as making such kind of data base system(Kim, 2002; Kim, 2005). As the 1st step for making data base system related to the fabric structural design, the data base between fabric structural parameters such as yarn count, fabric density, weave pattern and cover factor and process parameters such as weave and finishing shrinkages has to be constructed and analyzed using various kinds of fabric materials such as worsted, cotton, nylon and polyester fabrics.
In a previous study(Kim, 2005), weave density coefficients of synthetic fabrics were analysed and discussed with various weave patterns and fabric materials such as nylon and polyester. It makes easy application for new fabric design and also makes it possible to estimate the weavable fabric density according to the various types of looms for loom machinery maker. For getting the detail information of the fabric structural design data base, a further study as follows is needed. First is to make data accumulation such as fabric structural design parameters and dyeing and finishing process parameters according to the various weaving companies and looms they are using. Second is to make data base for measurement of the physical properties of fabrics such as drape coefficient and mechanical properties.
Therefore, in this paper, the density coefficients of the worsted and cotton fabrics were analysed and discussed with cover factors suggested by Prof. Walz and Picanol company(2005). And weaving and finishing shrinkages were analysed with weave pattern, yarn count and density coefficient as a preliminary research for making data base system of the fabric structural design.
2. Calculation of the fabric structural parameters
The fabric structural parameters such as fabric cover factor, density coefficient and weave density coefficient were calculated using following equations which were shown in the previous study(Kim, 2005).
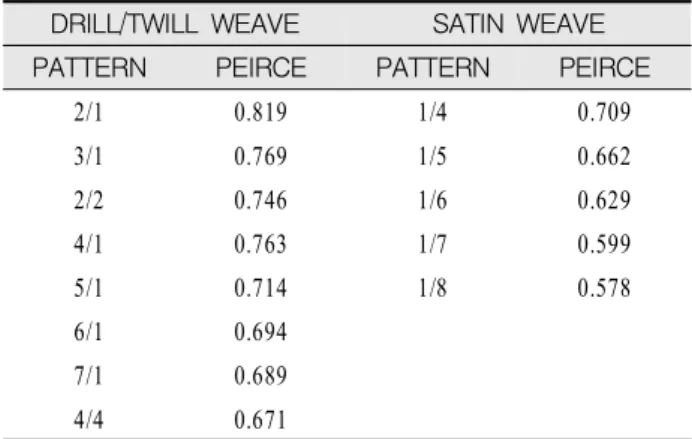
Peirce(1937) proposed equation 1 as a fabric cover factor which is recommended to weaving factories by Picanol weaving machinery company(Picanol, 2005).
In equation 1, yarn and fabric correction factors are shown in Table 1 and 2, respectively.
N e endsi n
N e picksi n
× yarn correction factor
× fabric correction factor
Table 1. Yarn correction factor
TYPE OF YARN CORRECTION FACTOR
metallic glass
0.3 0.6
Carbon 0.9
cotton, flax, jute,
viscose, polyester 1.0
acetate, wool 1.1
polyamide polypropylene
1.2 1.4
Table 2. Fabric correction factor
DRILL/TWILL WEAVE SATIN WEAVE
PATTERN PEIRCE PATTERN PEIRCE
2/1 0.819 1/4 0.709
3/1 0.769 1/5 0.662
2/2 0.746 1/6 0.629
4/1 0.763 1/7 0.599
5/1 0.714 1/8 0.578
6/1 0.694
7/1 0.689
4/4 0.671
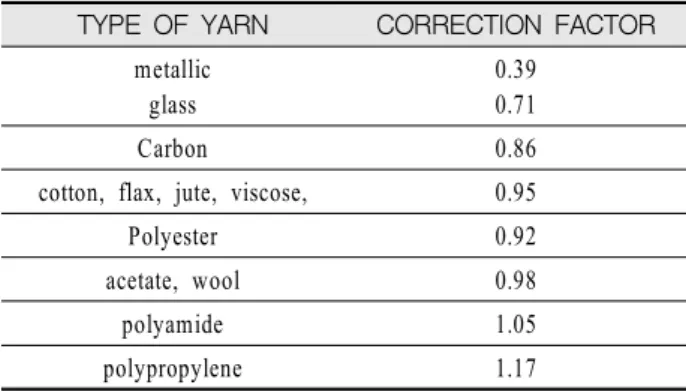
On the other hand, Prof. M. Walz(2005) proposed equation 2 as a little different equation form, but which is applicable to the various fabrics made by all kinds of textile materials. In equation 2, yarn correction factor, a and fabric correction factor, b are also shown in Table 3
and 4, respectively.
C dw df× Dw× Df× b
where d N m
a
adtex
C cover factor
Dw warp density endsi n Df weft density pi cksi n a yarn correction factor Table
b fabric correction factor Table
Table 3. Yarn correction factor by Walz
TYPE OF YARN CORRECTION FACTOR
metallic glass
0.39 0.71
Carbon 0.86
cotton, flax, jute, viscose, 0.95
Polyester 0.92
acetate, wool 0.98
polyamide 1.05
polypropylene 1.17
Table 4. Fabric correction factor by Walz
DRILL/TWILL WEAVE SATIN WEAVE
PATTERN Walz PATTERN Walz
2/1 0.69 1/4 0.50
3/1 0.58 1/5 0.45
2/2 0.56 1/6 0.42
4/1 0.49 1/7 0.39
5/1 0.43 1/8 0.38
6/1 0.41
7/1 0.40
4/4 0.39
Basilio Bona(Park et al., 2005) in Italy proposed empirical equation 3 for deciding fabric density on the worsted fabrics.
D K × N e × Cf
where D fabric densityendsm
K density coefficient Nm metric yarn count Cf weavecoef ficient Cf R Cr
R × fc× ff× fj fc cover factor ff floating factor fj jumping factor
Equation 3 is modified as equation 4 for the cotton fabrics.
D Kc× ×N e × × Cf
where N e English cott on cou n t
Kc Y arn density coef ficient cotton where : ․Comber yarns : 425~350(12~17 MICRONAIRE)
․Sea & Island cotton : 425, American cotton : 375
․Card yarns : 350~290(14~22 MICRONAIRE)
But, in synthetic filament yarn fabrics such as nylon and polyester, more effective parameter is needed. So, weave density coefficient, WC is made by equation 5.
WC
dw df
× D
W × Df× WF
where d yarn diameter WF weave factor Dw f warp weft density
In equation 5, assuming that Dw×Df is constant, it becomes as equation 6.
Dw× Df WF WC×
dw df
const
WC in equation 5 can be converted to K and Kc in equation 3 and 4, conversely K is converted to WC and also WC in equation 5 can be compared with cover factor, C given in equation 1 and 2, which is shown in the next case study.
3. Case study of worsted and cotton fabrics
3.1. Specimens
Various fabrics woven by worsted and cotton staple yarns were selected as specimens, respectively. Table 5 shows these specimens.
Table 5. Specimens of worsted and cotton fabrics Materials & Loom
Weave pattern
Worsted
fabrics Cotton
fabrics
Sulzer Air-jet
Plain Twill Others*
35 48 30
243 156 80
Total 113 479
Note : * oxford for cotton fabrics
3.2. Density coefficient of natural fabrics
For the worsted fabrics of one hundred thirteen, density coefficient, K was calculated using equation 3.
For the cotton fabrics of four hundreds seventy nine, density coefficient Kc was calculated using equation 4.
Figure 1 shows the diagram between density coefficient and yarn count for worsted and cotton fabrics.
0 200 400 600 800 1000 1200
0 20 40 60 80 100 120 140
Yarn count(Wp+Wf, Nm)
Density coefficient(Wp+Wf)
Plain Twill Others
(a) Worsted
0 200 400 600 800 1000 1200
0 20 40 60 80 100 120 140
Yarn count(Wp+Wf, Ne)
Density coefficient(Wp+Wf)
Plain Oxford Twill
(b) Cotton
Figure 1. Diagram between density coefficients and yarn counts for worsted and cotton fabrics.
It is shown that the density coefficient, K values of worsted fabrics are ranged from 600 to 1000, and for
cotton fabrics, almost same distribution is shown.
Comparing to synthetic fabrics such as polyester and nylon of which K values were ranged from 400 to 1600, as shown in the previous paper(Kim, 2005), natural fabrics such as worsted and cotton show lower values.
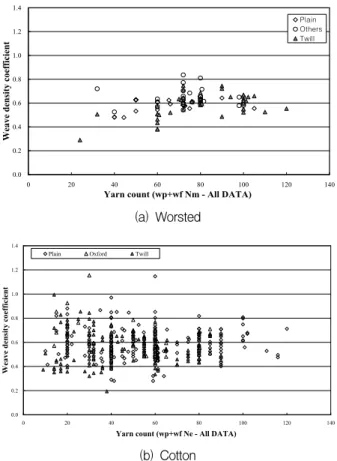
3.3. Weave density coefficient of the natural fabrics
Figure 2 shows weave density coefficients, WC calculated by equation 5, of worsted and cotton fabrics.
As shown in Figure 2, the weave density coefficients of worsted fabrics are ranged from 0.4 to 0.8, and for cotton fabrics, they are ranged from 0.2 to 1.0.
Comparing to WC values of synthetic fabrics which are ranged from 0.5 to 3.0 in the previous paper(Kim, 2005), those of the worsted and cotton fabrics are much lower as below 1.0.
0.0 0.2 0.4 0.6 0.8 1.0 1.2 1.4
0 20 40 60 80 100 120 140
Yarn count (wp+wf Nm - All DATA)
Weave density coefficient
Plain Others Twill
(a) Worsted
0.0 0.2 0.4 0.6 0.8 1.0 1.2 1.4
0 20 40 60 80 100 120 140
Yarn count (wp+wf Ne - All DATA)
Weave density coefficient
Plain Oxford Twill
(b) Cotton
Figure 2. Diagram of weave density coefficients of worsted and cotton fabrics.
Figure 3 shows weave density coefficient WC calculated by equation 5 and cover factors calculated by equation 1 and 2 for worsted fabrics. As shown in Figure 3, weave density coefficients of worsted fabrics show the values below 1.0, and cover factors also did below 100%. Especially the cover factors by Picanol show lower values than those of Prof. Walz as below 50%. These values are much lower than those of synthetic fabrics in the previous paper(Kim, 2005).
Figure 4 shows the diagram for cotton fabrics. The same phenomena are shown to the worsted fabrics.
0.0 0.3 0.6 0.9 1.2 1.5
0 200 400 600 800 1000 1200 1400 1600
Yarn count (wp+wf, denier)
Weave density coefficient
Plain Twill Others
(a) Weave density coefficient
0 30 60 90 120 150
0 200 400 600 800 1000 1200 1400 1600
Yarn count(Wp + Wf, denier)
Cover factor(%)
Plain Twill Others
(b) Cover factor by Prof. Walz
0 30 60 90 120 150
0 200 400 600 800 1000 1200 1400 1600
Yarn count(Wp + Wf, denier)
Cover factor(%)
Plain Twill Others
(c) Cover factor by Picanol
Figure 3. Diagram of weave density coefficients and cover factors for the worsted fabrics.
0.0 0.3 0.6 0.9 1.2 1.5
0 500 1000 1500 2000 2500
Yarn count (wp+wf, denier)
Weave density coefficient
PLAIN TWILL OXFORD
(a) Weave density coefficient
0 30 60 90 120 150
0 500 1000 1500 2000 2500
Yarn count(Wp + Wf, denier)
Cover factor(%)
PLAIN TWILL OXFORD
(b) Cover factor by Prof. Walz
0 30 60 90 120 150
0 500 1000 1500 2000 2500
Yarn count(Wp + Wf, denier)
Cover factor(%)
PLAIN TWILL OXFORD
(c) Cover factor by Picanol
Figure 4. Comparison among WC cover factors by Picanol and Prof. Walz for cotton fabrics
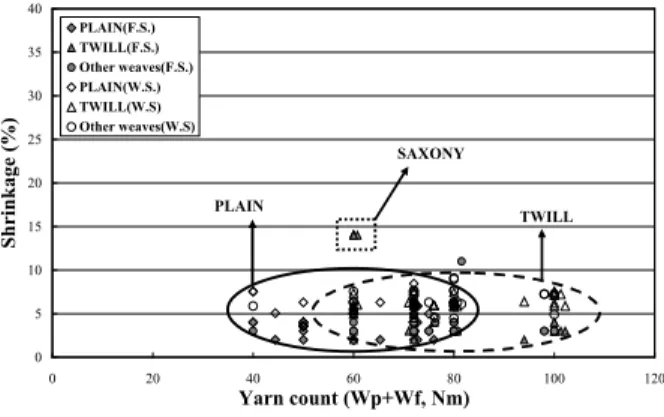
4. Case study for the weave density coefficient and shrinkages of dyeing and finishing processes
Figure 5 shows weave and finishing shrinkages of worsted fabrics shown in Table 5. As shown in Figure 5, the weave and finishing shrinkages of worsted fabrics are also distributed with weave patterns such as plain and twill, which are ranged from 2% to 10%.
0 5 10 15 20 25 30 35 40
0 20 40 60 80 100 120
Yarn count (Wp+Wf, Nm)
Shrinkage (%)
PLAIN(F.S.) TWILL(F.S.) Other weaves(F.S.) PLAIN(W.S.) TWILL(W.S) Other weaves(W.S)
TWILL PLAIN
SAXONY
Figure 5. Weave and finishing shrinkages of the worsted fabrics according to the yarn count
(F.S. : finishing shrinkage, W.S. : weave shrinkage)
Figure 6 shows finishing and weaving shrinkages of cotton fabrics shown in Table 5. As shown in Figure 6, finishing shrinkages of cotton fabrics are distributed from 2% to 20%, on the one hand, weaving shrinkages are ranged from 1% to 10%. It is shown that these shrinkages vary with weave patterns.
0 5 10 15 20 25 30 35 40
500 600 700 800 900 1000 1100 1200
Density coefficient(Wp+Wf-All DATA)
Finishing shrinkage(%)
Plain Oxford Twill Oxford
Twill
Plain
(a) Finishing shrinkage
0 5 10 15 20 25 30 35 40
500 600 700 800 900 1000 1100 1200
Density coefficient(Wp+Wf-All DATA)
Weave shrinkage(%)
Plain Oxford Twill
Oxford Plain Twill
(b) Weave shrinkage
Figure 6. Diagram between density coefficient and shrinkage of cotton fabrics
5. Summary
The analysis of the weave density coefficients of the worsted and cotton fabrics were carried out as a basic study of the fabric structural design. The density coefficients, K values of the worsted and cotton fabrics were ranged from 600 to 1000, on the other hand, the weave density coefficients of those fabrics are ranged from 0.4 to 0.8 and from 0.2 to 1.0, respectively. The finishing shrinkage for the worsted fabrics are ranged from 2% to 10%, for cotton fabrics, it was from 2% to 20%. Finally, the weave density coefficients of the worsted and cotton fabrics could be shown according to the looms, weave pattern and weaving and finishing shrinkages as a concept of the data base for the fabric structural design.
References
Kim, S. J. (2002). Data Base System and Its Application of PET Woven Fabric Design. Proceedings of 2nd International Fibre Symposium in Fukui, 10-17.
Kim, S. J. (2005). The Preliminary Study for Data-Base System of the Various Fabrics Design. Proceedings of 3rd International Conference on Advanced Fibre/
Textile Materials in Ueda, 32-33.
Park, S. H., Kim, S. J., Shin, B. J., & Lee, M. H. (2000).
Theory and Application of Woven Fabric Design For Garment, Seoul: ic Associates Co. LTD.
Peirce, F. T. (1937). The Geometry of Cloth Structure.
Journal of the Textile Institute Transactions, 28(3), 45-96.
Picanol. (2005). Instruction of Manual.
http://www.i-designer.co.kr.
http://www.texclub.com.
원고접수:10.01.13 수정접수:10.02.25 게재확정:10.03.17