http://crossmark.crossref.org/dialog/?doi=10.14474/ptrs.2019.8.4.218&domain=pdf&date_stamp=2019-12-25
Received: 4 October, 2019 Revised: 28 October, 2019 Accepted: 29 October, 2019 Corresponding author: Dae-Sung Park (ORCID https://orcid.org/0000-0003-4258-0878)
Department of Physical Therapy, College of Medical Sciences, Konyang University, 158 Gwanjeodong-ro, Seo-gu, Daejeon 35365, Republic of Korea Tel: 82-42-600-6419 Fax: 82-42-600-6565 E-mail: [email protected]
This is an Open-Access article distributed under the terms of the Creative Commons Attribution Non-Commercial License (http://creativecommons.org/licenses/
by-nc/4.0) which permits unrestricted non-commercial use, distribution, and reproduction in any medium, provided the original work is properly cited.
Copyright © 2019 Korean Academy of Physical Therapy Rehabilitation Science https://doi.org/10.14474/ptrs.2019.8.4.218
pISSN 2287-7576 eISSN 2287-7584
Phys Ther Rehabil Sci 2019, 8 (4), 218-224 www.jptrs.org
Intra- and inter-rater reliability of muscle thickness
measurement of the tibialis anterior using different inward pressures
Seong-Joo Leea, Ji Young Lima,b, Chang-Hyung Leec, Dae-Sung Parkd
aDepartment of Physical Therapy, General Graduate School of Medical Sciences, Konyang University, Daejeon, Republic of Korea
bResearch Institute for Future Medicine, Samsung Medical Center, Seoul, Republic of Korea
cRehabilitation Medicine, Pusan National University School of Medicine, Research Institute for the Convergence of Biomedical Science and Technology, Pusan National University Yangsan Hospital, Yangsan, Republic of Korea
dDepartment of Physical Therapy, College of Medical Science, Konyang University, Daejeon, Republic of Korea
Objective: This reliability study examined the effects of applying varying induced inward pressures using a transducer placed at 0° neutral ankle position (NEU) and 15° ankle dorsiflexion (DF) on tibialis anterior (TA) muscle thickness using a custom-made device with a force indicator during rehabilitative ultrasound imaging.
Design: Cross-sectional study.
Methods: Twenty-four healthy subjects were recruited in this study. Two examiners measured the muscle thickness of the TA at 0° NEU and 15° DF in 3 conditions of inward pressures (1.0 N, 2.0 N, and 4.0 N) using a custom-made holder. The muscle thick- ness was measured three times for each of the conditions arranged in random order. For intra- and inter-rater reliability, the intra- class correlation coefficients (ICCs) with 95% confidence intervals, standard error of measurement, minimal detectable change, and coefficient of variation were analyzed. One-way repeated measures analysis of variance was conducted for investigating changes of TA muscle thickness according to the inward pressures of the transducers.
Results: The intra-rater reliability of TA muscle thickness measurement was excellent (ICC3,1: 0.92-0.96) for all conditions (at both ankle joint angles per varying inward pressure). Likewise, the inter-rater reliability of TA muscle thickness measurement was excellent (ICC2,1: 0.89-0.97) under same conditions. The mean of TA thickness showed the trend of decreasing significantly with increased inward pressures at all ankle joint angles (p<0.05).
Conclusions: Use of this custom-made device with a force indicator is useful to accomplish the high intra- and inter-rater reli- ability of TA muscle thickness measurement at both ankle joint angles in reducing the measurement error.
Key Words: Anterior tibial muscle, Lower extremity, Reproducibility of results, Ultrasonography
Introduction
Muscle thickness is the most common parameter among the muscle architecture parameters and is commonly ob- tained as an ultrasound image [1], and it can also be used to predict muscle size obtained from magnetic resonance imaging [2]. Moreover, muscle thickness partially contrib- utes to muscle strength and the degree of functional impair-
ment in neurological disorder [3]. Muscle thickness have been measured using real-time ultrasound imaging, which is a noninvasive and safe method [4]. In obtaining the skeletal muscle architecture of diverse muscles such as the core, up- per limb, and lower limb muscles, its reliability and validity have been demonstrated [5-8].
Muscle imaging is considered to be a quantitative evalua- tion tool and a anticipated follow-up tool [9]. Notwithstand-
ing, it is generally accepted that muscle imaging is depend- ent upon the skill of the operator, and measurement errors may occur [10]. For this reason, measurement errors should be reduced and an examination for the reliability of measur- ing muscle architecture parameters is needed. In terms of its operator dependency, one of the primary factors that can af- fect the imaging process is the inward pressure of the trans- ducer [11]. A previous study [12] clarified that inward-pres- sures did have an effect on the thickness of the transversus abdominis, internal oblique, and external oblique muscles in various four conditions (0.5 N, 1.0 N, 2.0 N, and 4.0 N) on.
Likewise, muscle thickness of the lumbar multifidus and ex- ternal oblique muscles showed similar results in two inward pressure conditions (0.1 N and 2.0 N) [13].
Therefore, in order to reduce the influence of these inward pressures on muscle thickness measurements, some studies [12,13] have developed a custom-made holder that is hands-free, and have examined its reliability and the influ- ence of different inward pressures of the transducer for imaging of the lateral abdominal and lumbar multifidus muscles. On the other hand, a recent study [14] on patients with chronic back pain used the transducer force device and real-time on-screen display of transducer force (N), in- clination and roll (°) via a LabVIEW on a laptop. Some de- vices are not only impractical in real clinical settings oper- ated by health care professionals but most studies have also focused on mainly the abdominal muscles. There are a lack of studies that have investigated the use of a custom- made holder and inward pressure indicator on the tibialis anterior (TA) muscle, which contributes to walking function.
In this regard, the TA muscle plays an important role in an- kle dorsiflexion (DF) where sufficient activation prevents the appearance of foot drop during the swing phase of gait.
TA muscle dysfunction has been mainly shown in patients with neurological injury, such as stroke [15] and cerebral palsy [16]. For functional ambulation, the ankle joint has to have at least 10° to a maximum of 20° of DF. A previous study reported that in the swing phase of gait, the greater the maximum DF range, the larger the TA muscle thickness [16]. When performing maximum voluntary isometric con- traction at 15° of DF, the pennation angle of the TA muscle dramatically increased as well as the maximal torque [17].
TA muscle thickness during maximal DF was greater than that during the resting position in stroke survivors with im- paired muscle properties of the lower extremity. Also, TA muscle thickness of the paretic side in persons with stroke showed a significant difference compared to the non-paretic
side in 0° neutral ankle position (NEU) and 15° DF [6].
Comprehensively, this may indicate that it is clinically cru- cial to measure TA muscle thickness in 15° DF, which infers on functional properties such as gait.
Therefore, a hand-held transducer device connected with an indicator showing inward pressure in real-time was uti- lized with consideration of the effect of inward pressure on TA muscle thickness and usability in clinical settings. The purposes of this study were (1) to examine the usability of a novel hand-held method in healthy subjects, (2) to apply this method for obtaining thickness images of the TA muscles in 0° NEU and 15° DF positions at varying inward pressures of the transducer, (3) to analyze the intra- and inter-rater reli- ability of the measurements using the hand-held transducer with an indicator to adjust the inward pressures of the trans- ducer, and (4) to compare changes in TA muscle thickness according to the inward pressures of transducers.
Methods
Inclusion and exclusion criteria
Subjects were recruited from Konyang University student population from Daejeon. Subjects who had a history of fracture, operation, inflammatory disease, or neurological injury in the ankle and knee joints were excluded. All partic- ipants submitted their informed consent after understanding the entire procedure of the study, which was approved by the Institutional Review Board of Konyang University (IRB No. KYU 2016-079).
Experimental equipment and procedure
For accurate measurements of ankle joint angles, an iso- kinetic dynamometer (HUMAC Norm; CSMi, Stoughton, MA, USA) was set at two different ranges in resting position (i.e. 0° NEU and 15° DF). Subjects were instructed to sit up- right in the assessment chair and to fully extend the knee.
After the ankle joint angles of the subjects were properly es- tablished, the primary examiner marked the position of the ultrasound transducer according to the reference of the scan- ning site that was located at 20% of the distance from the head of the fibula to the tip of the lateral malleolus. Once an appropriate transducer position was confirmed, both exam- iners obtained images of the right TA using real-time B- mode ultrasound imaging (MicrUS-EXT-1H; Telemed, Vilnius, Lithuania) with a 7.5 MHz linear transducer. For obtaining images in different inward pressure of the transducer (1.0 N, 2.0 N, and 4.0 N, respectively), a custom-made device with
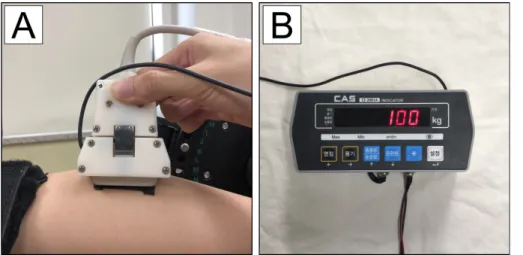
Figure 1. (A) The custom-made device with one-axis digital load cell sensor (CSBA-10LS; Curiotech Inc., Seoul, Korea) embedded in the socket. (B) The indicator (CI-2001A; CAS Korea, Seoul, Korea) that checks the measured in- ward pressure in real time.
a one-axis digital load cell sensor (CSBA-10LS; Curiotech Inc., Seoul, Korea) (Figure 1A) was utilized and enabled the ability to check the inward pressure of the transducer in re- al-time with an indicator (CI-2001A; CAS Korea, Seoul, Korea) (Figure 1B). Although the two physical therapists had more than three years of experience in measuring mus- cles thickness using rehabilitative ultrasound imaging, they were additionally trained by a specialist (PhD) in rehabi- litative ultrasound imaging for two days on collecting an ex- act image of the TA.
To check for intra-rater reliability, examiner A conducted measurements on one day and then again on the following day. To find out the inter-rater reliability, primary examiner A captured an image first, and then examiner B conducted an in an equal manner, one hour later on the same day. The sub- jects participated in a total of three sessions. The examiner measured the muscle thickness three times under each con- dition (three inward pressures [1.0 N, 2.0 N, and 4.0 N] * two ankle positions [0° NEU and 15° DF]), and eighteen images were produced per session. In total, fifty-four images were obtained per participant. The order of conditions was randomized to decrease measurement bias.
To minimize the measurement bias, another examiner who had not participated in image collection had analyzed the TA muscle thickness using the Image J software (Bethesda, MD, USA). The TA muscle thickness was defined as the lin- er distance between the superficial aponeurosis and the deep aponeurosis upon the center longitudinal line of the captured images.
Sample size calculation and data analysis
Based on a priori power analysis (G*Power Software, version 3.1.9.2; Heinrich-Heine-Universität, Düsseldorf, Ger-
many), the number of group (single-group), number of mea- surements, and 90% of statistical power at an α level of 0.05 for the TA muscle thickness value was determined. A sample size of 24 was sufficient to optimize for repeated measures within factors.
Descriptive statistics were used for the general character- istics of the subjects. For primary analyses, based on the studies [12,13] related to inward pressure, three values of TA muscle thickness per each condition was averaged. The reliabilities of each TA thickness variable (0° NEU and 15°
DF in different inward pressures of 1.0 N, 2.0 N, and 4.0 N, respectively) was estimated using intraclass correlation co- efficients (ICCs) values of relative reliability with 95% con- fidence intervals. Intra-rater reliability was calculated based on the single-rater, absolute-agreement, 2-way mixed-ef- fects model (ICC3,1). Inter-rater reliability was calculated based on single-rating, absolute-agreement, 2-way random effects model (ICC2,1) [18].
For investigating absolute-agreement of the measure- ments, the standard error of the measurement (SEM) and minimal detectable change (MDC) values were estimated by using the formula: SEM; SD× and MDC; SEM×
1.96× [19]. Additionally, the coefficient of variation (CV) was computed to examine the relative measurement error. The Bland and Altman plot [20] was used to express the agreement according to each inward pressure between session 1 and session 2 of intra-rater reliability at 0° NEU and 15° DF.
To analyze for statistically significant changes of TA mus- cle thickness according to the inward pressures of the trans- ducer in each ankle joint angle, a one-way repeated meas- ures analysis of variance was conducted for within subjects’
design. Significance level of 0.05 was chosen for testing
Table 1. Intra-rater reliability for TA muscle thickness in two ankle joint angles at different inward pressures (N=24)
Ankle angle Conditions Session 1 Session 2 ICC3,3 (95% CI) SEM (mm) MDC (mm) CV (%)
0° NEU 1.0 N 14.76 (1.56) 14.76 (1.61) 0.92 (0.82-0.97) 0.45 1.26 0.13
2.0 N 15.05 (1.59) 14.05 (1.69) 0.92 (0.83-0.97) 0.47 1.29 0.14
4.0 N 12.86 (1.68) 12.92 (1.76) 0.93 (0.83-0.97) 0.48 1.34 0.16
15° DF 1.0 N 15.69 (1.38) 15.70 (1.37) 0.92 (0.82-0.96) 0.40 1.11 0.11
2.0 N 15.38 (1.39) 15.40 (1.43) 0.94 (0.86-0.97) 0.37 1.01 0.10
4.0 N 14.82 (1.43) 14.87 (1.49) 0.96 (0.90-0.98) 0.31 0.86 0.09
Values are presented as mean (SD) or number only.
TA: tibialis anterior, ICC: intraclass correlation coefficient, CI: confidence interval, SEM: standard error of measurement, MDC: minimal detectable change, CV: coefficient of variation, NEU: neutral ankle position, DF: ankle dorsiflexion.
Figure 2. Bland-Altman plots to assess intra-rater reliability of muscle thickness of tibialis anterior. (A) A 0° neutral ankle position (NEU) applied with 1.0 N, (B) 0° NEU applied with 2.0 N, (C) 0° NEU applied with 4.0 N, (D) 15° ankle dorsiflexion (DF) applied with 1.0 N, (E) 15° DF applied with 2.0 N, (F) 15° DF applied with 4.0 N.
statistical significance. All statistical analyses were con- ducted using PASW Statistics for Windows, Version 18.0 (SPSS Inc., Chicago, IL, USA).
Results
Participant characteristics
For this single-group repeated-measures reliability study, a total of twenty-four healthy subjects (16 women and 8 men) were enrolled. Mean (SD) values of their general char- acteristics were 21.4 (1.4) years for age, 164.8 (8.3) cm for height, and 59.9 (11.6) kg for weight, respectively.
Reliability
The intra-rater ICC values ranged from 0.92 to 0.96 for each of the three conditions at both ankle joint angles (Table 1).
ICC values at 15° DF for the three conditions were the same or greater than at the 0° NEU position. In absolute reliability of measurements, ranges of SEM and MDC were from 0.31 to 0.48 and from 0.86 to 1.26 respectively with lower SEM and MDC for 15° DF than 0° NEU. Moreover, range of CV was from 0.09 to 0.16 between session 1 and session 2. The Bland and Altman plots [20] for intra-rater reliability showed good agreement at both ankle joint angles as shown
Table 2. Inter-rater reliability for TA muscle thickness in two ankle joint angles at different inward pressures (N=24) Ankle angle Conditions Examiner A Examiner B ICC2,3 (95% CI) SEM (mm) MDC (mm) CV (%)
0° NEU 1.0 N 14.76 (1.56) 14.75 (1.72) 0.89 (0.77-0.95) 0.56 1.56 0.17
2.0 N 15.05 (1.59) 14.08 (1.71) 0.90 (0.79-0.96) 0.51 1.42 0.15
4.0 N 12.86 (1.68) 12.91 (1.77) 0.91 (0.80-0.96) 0.52 1.45 0.17
15° DF 1.0 N 15.69 (1.38) 15.71 (1.41) 0.97 (0.92-0.99) 0.26 0.71 0.07
2.0 N 15.38 (1.39) 15.41 (1.39) 0.97 (0.94-0.99) 0.23 0.64 0.06
4.0 N 14.82 (1.43) 14.84 (1.44) 0.97 (0.93-0.99) 0.25 0.69 0.07
Values are presented as mean (SD) or number only.
TA: tibialis anterior, ICC: intraclass correlation coefficient, CI: confidence interval, SEM: standard error of measurement, MDC: minimal detectable change, CV: coefficient of variation, NEU: neutral ankle position; DF: ankle dorsiflexion.
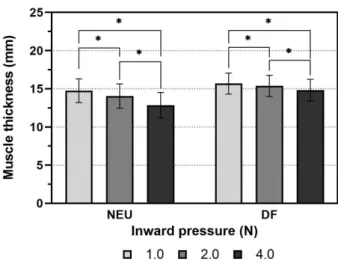
Figure 3. Significant differences of mean values between inward pressures at each ankle position (*p<0.05). NEU: neutral ankle po- sition; DF: ankle dorsiflexion.
in Figure 2.
For inter-rater reliability, ICCs were shown to be at least 0.89 to maximum 0.97 for each of the three conditions at all ankle joint angles (Table 2). The ICCs values for 15° of DF (0.97) showed high levels of consistency compared to 0°
NEU (ICCs: 0.89-0.91). In absolute reliability of measure- ments, ranges of SEM and MDC were from 0.23 to 0.56 and from 0.64 to 1.56 respectively with lower SEM and MDC for 15° DF than 0° NEU, along with the intra-rater reli- ability. Also, the results ranged from 0.06 to 0.17, which was within 10 % of the measures values.
Difference of TA muscle thickness at the three inward pressures
There were significant differences in mean values be- tween inward pressures at both ankle joint positions (p<0.05). The mean TA muscle thickness decreased as in- ward pressures increased. The significant mean differences between the 1.0 N and 2.0 N, 1.0 N and 4.0 N, 2.0 N and 4.0 N were 0.71, 1.90, and 1.19 respectively at 0° NEU (p<0.05, Figure 3). The significant mean differences between the 1.0 N and 2.0 N, 1.0 N and 4.0 N, 2.0 N and 4.0 N were 0.31, 0.87, and 0.56 respectively at 15° DF (p<0.05, Figure 3).
Discussion
To our knowledge, this is first study to investigate the con- sistency of TA muscle thickness according to different in- ward pressures of the transducer at two ankle joint positions for intra- and inter-rater reliability, and the changes of TA muscle thickness according to the inward pressures using the customized probe force holder. Comprehensively, our findings showed that there were high-agreements in all an- kle positions per 1.0 N, 2.0 N, and 4.0 N within the examiner
and between examiners. Also, with greater inward pressures of the transducer, there were significant decreases in TA muscle thickness.
A previous study [21] including stroke survivors reported that in 0° NEU of the non-paretic side, the ICC values of TA muscle thickness (0.64-0.88) showed lower intra-rater reli- ability compared to this study (ICCs: 0.92-0.93 and CV:
0.9%-0.18%). The inward pressure of the transducer was ad- justed in real-time with a pressure indicator. In contrast to our experimental setting, a study by Cho et al. [21] applied minimal inward pressure of the transducer for reducing the soft area compression. The two divergent methods may have resulted in differences in intra-examiner reliability, and the inward pressure of the transducer within the examiner ap- plied onto stroke survivors might not have been controlled consistently.
Recently, there was an interesting study [22] using a probe
force device, which was used to examine the intra-rater reli- ability of the transverse abdominis by a novice examiner in comparison to the freehand method. This study [22] sug- gested that use of the device and view of real-time force, in- clination or roll would be helpful in obtaining reliable values of abdominal muscle parameters during ultrasound imaging than the freehand method. In the same context, the current study showed a higher intra-rater reliability of obtaining TA muscle thickness using a custom-made holder with a one- axis loadcell through real-time feedback compared to the freehand method. Therefore, it could be interpreted that us- ing a real-time probe force to maintain consistently im- proved the reliability of TA muscle thickness measurements and diminished the measurement errors.
In the viewpoint on the effect of pressure, as the inward pressure of the transducer increased, there were significant differences in TA muscle thickness. Likewise, a previous study [12] reported the influence of inward pressures of the transducer (0.5 N, 1.0 N, 2.0 N, and 4.0 N) on lateral ab- dominal muscle thickness. The current study showed a sim- ilar trend with the results of a study by Ishida and Watanabe [12]. In regards to the findings of this study, the mean differ- ence (1.90 mm) between 1.0 N and 4.0 N in 0° NEU was greater than MDC in 1.0 N at 0° NEU (1.26 mm). In other words, this indicated that influence of inward pressure of the transducer could interfere with investigating a meaningful change in real TA muscle thickness after dorsiflexor muscle strength training.
However, unlike the results of 0° NEU, the mean differ- ence (0.87 mm) between 1.0 N and 4.0 N in 15° of DF showed lower values than MDC in the condition of 1.0 N at 15° DF (1.11 mm). Namely, in 15° of DF position, it might be permissible for examiners to apply the TA muscle imag- ing within inward pressure ranges from 1.0 N to 4.0 N. Also, the intra- and inter-rater reliability in 15° DF position were higher than 0° NEU. This may be explained based on a pre- vious mechanical study [23] that TA muscle stiffness may have been accountable for the result when positioned pas- sively at an ankle joint angle. Previous results [23] reported the compression of the crural fascia might stiffen the super- ficial layer of the TA muscle of some participants as the an- kle joint angle was getting approximating into dorsiflexion.
This characteristic of the TA muscle could attribute to the easy fixation of the transducer by the examiner. It may ex- plain why the ICCs of TA muscle measurement at 15° DF showed very good reliability and why influence of inward pressure was less than 0° NEU.
The remarkable finding was that as the inward pressure increased, the ICC values of muscle thickness improved. To obtain a stable position, orientation, and consistent inward pressure of the transducer, delicate attention is required dur- ing rehabilitative ultrasound imaging [24]. When specific inward pressure is applied, vibration and the gap between the gel and skin might be minimized. It could be interpreted that specific inward pressure is helpful to steadying the posi- tion comparatively. However, since the objective of this study was not to determine the optimal inward pressure for measuring the TA muscle thickness using rehabilitative ul- trasound imaging, it may be difficult to make general- izations of its use with certain pressures.
The meaningful findings of this study support that when using a custom-made holder with a one-axis load cell and in- dicator of pressures in real time, TA muscle thickness meas- urements showed high intra- and inter-rater reliability in dif- ferent inward pressures at both ankle joint angle. However, there are some limitations in this research. The TA muscle thickness of healthy individuals at passive resting position was assessed, not during contraction. For clinical applica- tion, future studies should examine the reliability of TA muscle parameters, such as muscle thickness, pennation an- gle, and cross-sectional area in persons with stroke or cere- bral palsy in regards to impairment of the dorsiflexors utiliz- ing a force indicator in real-time when the TA muscle was contracted. Also, we only measured in limited condition of 1.0 N, 2.0 N, and 4.0 N) in dorsiflexion condition. In the next study, the application of a lower inward pressure (e.g. 0.5 N) is suggested.
The current study highlights the need for trying to view the inward pressure of transducer in real time when measur- ing TA muscle thickness during rehabilitative ultrasound imaging, particularly at 0° NEU than 15° DF. The muscle has personal characteristics and is likely to be impacted from multivariate factors such as age [25] and sex differences. For this reason, in order to acquire exact change of muscle thick- ness, the assessor should take initiative to reduce the varia- bility in inward pressures applied through the transducer within the patient into account.
Conflict of Interest
The authors declared no potential conflicts of interest with respect to the authorship and/or publication of this article.
References
1. Abe T, Loenneke JP, Thiebaud RS. Ultrasound assessment of hamstring muscle size using posterior thigh muscle thickness.
Clin Physiol Funct Imaging 2016;36:206-10.
2. Miyatani M, Kanehisa H, Ito M, Kawakami Y, Fukunaga T. The accuracy of volume estimates using ultrasound muscle thickness measurements in different muscle groups. Eur J Appl Physiol 2004;91:264-72.
3. Ohata K, Tsuboyama T, Ichihashi N, Minami S. Measurement of muscle thickness as quantitative muscle evaluation for adults with severe cerebral palsy. Phys Ther 2006;86:1231-9.
4. Thoirs K, English C. Ultrasound measures of muscle thickness:
intra-examiner reliability and influence of body position. Clin Physiol Funct Imaging 2009;29:440-6.
5. Bentman S, O'Sullivan C, Stokes M. Thickness of the middle tra- pezius muscle measured by rehabilitative ultrasound imaging:
description of the technique and reliability study. Clin Physiol Funct Imaging 2010;30:426-31.
6. Cho KH, Lee HJ, Lee WH. Reliability of rehabilitative ultra- sound imaging for the medial gastrocnemius muscle in post- stroke patients. Clin Physiol Funct Imaging 2014;34:26-31.
7. Koppenhaver SL, Hebert JJ, Fritz JM, Parent EC, Teyhen DS, Magel JS. Reliability of rehabilitative ultrasound imaging of the transversus abdominis and lumbar multifidus muscles. Arch Phys Med Rehabil 2009;90:87-94.
8. O'Sullivan C, Bentman S, Bennett K, Stokes M. Rehabilitative ultrasound imaging of the lower trapezius muscle: technical de- scription and reliability. J Orthop Sports Phys Ther 2007;37:
620-6.
9. Jansen M, van Alfen N, Nijhuis van der Sanden MW, van Dijk JP, Pillen S, de Groot IJ. Quantitative muscle ultrasound is a promis- ing longitudinal follow-up tool in Duchenne muscular dystro- phy. Neuromuscul Disord 2012;22:306-17.
10. Crofts G, Angin S, Mickle KJ, Hill S, Nester CJ. Reliability of ul- trasound for measurement of selected foot structures. Gait Posture 2014;39:35-9.
11. Kristjansson E. Reliability of ultrasonography for the cervical multifidus muscle in asymptomatic and symptomatic subjects.
Man Ther 2004;9:83-8.
12. Ishida H, Watanabe S. Influence of inward pressure of the trans- ducer on lateral abdominal muscle thickness during ultrasound
imaging. J Orthop Sports Phys Ther 2012;42:815-8.
13. Ishida H, Watanabe S. Influence of inward pressure applied by the transducer on trunk muscle thickness during ultrasound imaging. Kawasaki J Med Welf 2014;19:32-7.
14. Flavell CA, Marshman LG, Gordon SJ. Measurement of trans- versus abdominis activation in chronic low back pain patients us- ing a novel standardized real-time ultrasound imaging method.
Ultrasound 2019;27:31-7.
15. English C, McLennan H, Thoirs K, Coates A, Bernhardt J. Loss of skeletal muscle mass after stroke: a systematic review. Int J Stroke 2010;5:395-402.
16. Bland DC, Prosser LA, Bellini LA, Alter KE, Damiano DL.
Tibialis anterior architecture, strength, and gait in individuals with cerebral palsy. Muscle Nerve 2011;44:509-17.
17. Kim S, Son J, Yi C, Kim D, Kim Y. Pennation angles of ankle dorsiflexor and plantarflexors depending on muscle contraction intensity. Int J Precis Eng Manuf 2013;14:855-8.
18. Koo TK, Li MY. A guideline of selecting and reporting intraclass correlation coefficients for reliability research. J Chiropr Med 2016;15:155-63.
19. Portney LG, Watkins MP. Foundations of clinical research: ap- plications to practice. New Jersey: Pearson/Prentice Hall; 2009.
20. Bland JM, Altman DG. Statistical methods for assessing agree- ment between two methods of clinical measurement. Lancet 1986;327:307-10.
21. Cho KH, Lee HJ, Lee WH. Intra- and inter-rater reliabilities of measurement of ultrasound imaging for muscle thickness and pennation angle of tibialis anterior muscle in stroke patients. Top Stroke Rehabil 2017;24:368-73.
22. Kennedy VL, Flavell CA, Doma K. Intra-rater reliability of transversus abdominis measurement by a novice examiner: com- parison of “freehand” to “probe force device” method of re- al-time ultrasound imaging. Ultrasound 2019;27:156-66.
23. Koo TK, Guo JY, Cohen JH, Parker KJ. Quantifying the passive stretching response of human tibialis anterior muscle using shear wave elastography. Clin Biomech (Bristol, Avon) 2014;29:33-9.
24. Ishida H, Suehiro T, Kurozumi C, Ono K, Watanabe S. Correla- tion between abdominal muscle thickness and maximal ex- piratory pressure. J Ultrasound Med 2015;34:2001-5.
25. Kim MK, Ko YJ, Lee HJ, Ha HG, Lee WH. Ultrasound imaging for age-related differences of lower extremity muscle architec- ture. Phys Ther Rehabil Sci 2015;4:38-43.