INTRODUCTION
Rapid urbanization, dense population, and indu- strialization caused water contamination and eutrophication in aquatic ecosystems of urban streams and rivers, resulting in exceeding of self- purification capacity of streams and rivers (Eom
et al., 2004; Kim et al., 2005). One of the mostimportant factors in the pollution is closely asso- ciated with effluent water from wastewater treat-
ment plants (WWTPs) near the stream and urban stream pollution is directly influenced by the point source of WWTPs (An et al., 2007; Kim et al., 2008). Such evidence is shown in previous stream studies in Han-River (Lee and Byun, 2001), Keum- River (Bae et al., 2007), Nakdong-River (Lee et
al., 2008c), and Yongsan-River (Choe and Lee,2005) watersheds. In these streams and rivers, organic matters and nutrients like phosphorus and nitrogen inflowing to the lotic environments from the WWTPs caused nutrient enrichments,
─
─ 465 ──
* Corresponding author: Tel: +82-42-821-6408, Fax: +82-42-822-9690, E-mail: [email protected]
Effects of Wastewater Treatment Plants (WWTPs) on Downstream Water Quality and Their Comparisons with
Upstream Water Quality in Major Korean Watersheds
Jang, Seong-hui, Hyun-Mac Kim and Kwang-Guk An*
(Department of Biology, College of Biosciences and Biotechnology, Chungnam National University, Daejeon 305-764, Korea)
The purpose of the study was to evaluate spatial and temporal effects of wastewater treatment plants (WWTPs) on the water quality of downstreams (Tan Stream, TS; Dae- myeong Stream, DS; Gwangju Stream, GS, and Kap Stream, KS) located in four major watersheds along with impact analysis of nutrient enrichments on the WWTPs dur- ing 2004~~2008. In the four streams, seasonal means of BOD, COD, TN, and TP were significantly (p⁄⁄0.01) greater in the downstreams (Ds) than the upstreams (Us). The removal effect of nutrients (nitrogen, and phosphorus) from the WWTPs was much less than the BOD, indicating a greater nutrient impact on the downstreams. Sea- sonal dilution of organic matter, based on BOD, during the summer monsoon of July~~ September was most pronounced in the downstreams of all four watersheds. How- ever, mean TN in the downstreams during the monsoon varied little in all four streams.
Regression analysis of TN in the downstreams against TN from the WWTPs showed that in the TS, and DS regression slopes in the upstreams were similar to the slopes of downstream but there was a significant difference in the GS (p⁄⁄0.001) and KS (p⁄⁄ 0.01). Tan-Stream WWTP showed low removal efficiency of BOD and COD concentra- tions, compared to the nutrients, whereas, two WWTPs of Gwangju and Kap Stream had low removal effects in TN and TP. Regression analysis of TN and BOD in the down- streams showed that they was closely related (p⁄⁄0.01) with stream water volume only in the GS. Our data analysis suggests that greater treatment efficiencies of phospho- rus and nitrogen from the WWTPs may improve the downstream water quality.
Key words : wastewater treatment plant, downstream, water quality, nitrogen, phos- phorus
low dissolved oxygen, high ionic concentrations, and hazard chemicals (Kim et al., 2005; Bae and An, 2006; Bae et al., 2007; Lee et al., 2008d), re- sulting in frequent algal blooms, decreases of spe- cies diversity (fish, macroinvertebrate) and habi- tat degradations (Kim et al., 2008; Kim et al., 2009). In general, the WWTPs in the urban region collect sewage through the pipe from the house- holds, purify it, and then discharge the effluents to the downstream. For this reason, the WWTPs effectively cut down pollutant loadings, but con- tinuous large amounts of effluents evidently re- sulted in sediment pollutions and fish kills attri- buted to increased inputs of nutrients and organic pollutants (Choe and Lee, 2005).
The types of sewage treatments in wastewater treatment plants (WWTPs) influenced degree of nutrient pollution near the downstreams. The WWTPs have different sewage treatments systems depending on the regions (watersheds) and the facility supported by the government. The WWTPs influencing Tan-Stream has sewage-treat system by Standard Activated Sludge Process (SASP), which has low treatment efficiency at removing phosphorus and nitrogen. Seobu WWTPs, which is located in Nakdong-River watershed (Daemyoung Stream), Daegu city, has a system of anaerobic/
anoxic and oxidation (A
2/O), which manages phos- phorus and nitrogen well at the same time. In the mean time, Gwangju WWTPs influencing Gwangju Stream and Daejeon WWTP influencing Kap-Stream handle sewage by Nitrogen & Phos- phorus Removal Process (NPR). Recent studies (MEK, 2007b) pointed out that 46 sites of total WWTPs in Korea exceeded their capacity of the sewage treatments and that the effluents from the WWTPs of Gwangju (BOD: 16.5 mg L
-1) and Dae- jeon (BOD: 10.3 mg L
-1) exceeded annual water quality values.
Korea has set maximum permissible values for effluents of WWTPs since 2008 that BOD is below than 20 mg L
-1in the normal site. Compare with normal site, in the specific site BOD is below than 10 mg L
-1. In comparison, Germany applies permissible values for effluents of WWTPs dif- ferently depending WWTPs’ scale. Small scale WWTPs have higher values (BOD: 40 mg L
-1) than large WWTPs (BOD: 15 mg L
-1). Also, Unit- ed States sets permissible values for effluents of WWTPs that BOD
5is below than 30 mg L
-1, but each state has different values with site, process- ing technique (MEK, 2002). Such differences in
the regulatory criteria resulted in the variation of downstream water quality. In Korea, Lee (2008) showed that influx volume from the WWTPs is potentially associated with the downstream water quality. Also, Huh et al. (2005) showed that Geann Stream WWTPs, one of the Han River watersheds, deteriorated the dowstream of Han River, and Wonju WWTPs increased downstream phosphorus of Seom River. Also, Choe and Lee (2005) suggest- ed that when the discharge of the stream water (Seobang Stream, Gwangju) was reduced 5%, BOD loading was decreased by 2.8%.
In spite of these researches, little is known about how the effluents from the WWTPs influence the downstream water quality. The WWTPs which is a point-source of nutrients, is influx site of pollu- tant into the stream river, and it is easier to con- trol than non-point pollution source (Kwak et al., 2008; Lee et al., 2008b; Park et al., 2008). In this study, we evaluated the spatial and temporal variations of TN, TP, BOD, and COD in the efflu- ents of four WWTPs (Tan-Stream WWTP, Seobu WWTP, Gwangju WWTP and Daejeon WWTP) influencing the downstream water quality, and compared the effects of upstreams versus down- streams along with impact analysis of effluents from the WWTPs.
MATERIALS AND METHODS
1. Sampling sites and periods
Our preliminary results of the study sites show- ed that there were 38 sites of wastewater treat- ment plants (WWTPs) in the major cities in Korea.
The WWTPs which do not discharge their efflu-
ents into the stream were excluded for the analy-
sis, and then sites were divided distinctly into
downstream versus upstream locations from the
WWTPs. Based on these results, sampling sites
(name of WWTPs, stream name) were selected
are as follows: Tan-Stream WWTP of Tan-Stream
(TS, Han-River watershed), Seobu WWTP of Dae-
myeong-Stream (DS, Nakdong-River watershed),
Gwangju WWTP of Gwangju-Stream (GS, Young-
san-River watershed), and Daejeon WWTP of Kap-
Stream (KS, Geum-River watershed) in four major
Korean watersheds (Fig. 1). Also, upstream and
downstream was defined on the basis of each
WWTPs site. Tan-Stream WWTP’s up and down-
stream was located on Tan-Stream 3, 4. Seobu
WWTP’s up and downstream was located on Dal-
seong, Hwawonnaru. Gwangju WWTP was located on Gwangju 1, Gwangju industrial complex 1.
Daejeon WWTP’s up and downstream was located on Kap-Stream 3, 4. Each of them is located in the upstream and downstream of Tan-Stream (TS
U, TS
D), upstream and downstream of Daemyeong- Stream (DS
U, DS
D), upstream and downstream of Gwangju-Stream (GS
U, GS
D), upstream and down- stream of Kap-Stream (KS
U, KS
D). The sites are
as follows:
TS: Tan-Stream, Irwon-dong, Gangnam-gu, Seoul
TS
U: Tan-Stream 3, TS
D: Tan-Stream 4
DS: Daemyeong-Stream, Daecheon-dong, Dal- seo-gu, Daegu
DS
U: Dalseong, DS
D: Hwawonnaru
Fig. 1. Sampling sites in four streams, influenced by wastewater treatment plants (WWTPs) within four Korean major watersheds. The sampling sites are as follows: Daejeon WWTP of Kap-Stream (KU, KD, Geum-River watershed), Tan-Stream WWTP of Tan-Stream (TU, TD, Han-River watershed), Gwangju WWTP of Gwangju-Stream (GU, GD, Youngsan-River watershed), and Seobu WWTP of Daemyeong-Stream (DU, DD, Nakdong-River watershed).
Geum River
Yeongsan River
Nakdong River Han River
WWTP
WWTP
TSU
TSD
N
0 4 km
0 4 km
0 4 km
0 5 km
KSD
KSU
GSU
DSU
DSD
GSD
WWTP
WWTP
GS: Gwangju Stream, Chipyeong-dong, Seo-gu, Gwangju
GS
U: Gwangju 1, GS
D: Gwangju industrial com- plex 1
KS: Kap-Stream, Wonchon-dong, Yuseong-gu, Daejeon
KS
U: Kap-Stream 3, KS
D: Kap-Stream 4 Water quality at the stream was compared with water quality of the effluents from the WWTPs along with stream water volume and precipitation data. To investigate seasonal trends, 3 periods of premonsoon (pre, April~June), monsoon (mon, July~September), and postmonsoon (pos, Octo- ber~December) were compared in 2007.
2. Methods
Water quality data, obtained from the Ministry of Environment, Korea (MEK, 2007a) were ana-
lyzed and the dataset during 2004~2008’s data (http://water.nier.go.kr/weis) were used for the analysis. The data of precipitation (rainfall) and stream water volume was obtained from regional weather repots station (http://daejeon.kma.go.kr) and national environmental research institute (http://smat.nier.go.kr) to compare them with stre- am water quality data and data from the effluents of wastewater treatment plants (WWTPs). Using the dataset, we conducted correlation analysis and regression analysis using SPSS software package.
In this study, we determined the significance in 95% confidence interval (p = =0.05).
RESULTS AND DISCUSSION 1. Organic matter inputs and nurient
enrichments in the downstreams
Water quality, based on organic matter and
Sampling sites Sampling sites
TS DS GS KS
BOD(mg L-1)TN(mg L-1) COD(mg L-1)TP(μg L-1)
0 5 10 15 20
20 25
TS DS GS KS
0 2 4 6 8 10 12 14 16
TS DS GS KS
0 200 400 600 800 1000 1200 1400 1600
Sampling sites Sampling sites
TS DS GS KS
0 2 4 6 8 10 12 14 16 18
BODus BODds
TNus TNds
TPus TPds CODus CODds
(a) (b)
(c) (d)
Fig. 2. Comparisons of biological oxygen demand (BOD), chemical oxygen demand (COD), total nitrogen (TN), and total phosphorus (TP) in the four streams of Tan Stream (TS), Daemyeong Stream (DS), Gwangju Stream (GS), and Kap Stream (KS).
BOD (mg L-1) BOD (mg L-1) 0 10 20 30 40 50 60
(a) TS
Us WWTP Ds
Us WWTP Ds
Us WWTP Ds
Us WWTP Ds
Us WWTP Ds
Us WWTP Ds Us WWTP Ds Us WWTP Ds Us WWTP Ds
Us WWTP Ds Us WWTP Ds Us WWTP Ds
Us WWTP Ds Us WWTP Ds Us WWTP Ds
Us WWTP Ds Us WWTP Ds Us WWTP Ds
Us WWTP Ds Us WWTP Ds Us WWTP Ds
Us WWTP Ds Us WWTP Ds Us WWTP Ds
0 10 20 30 40 50 60
BOD (mg L-1) TN(mg L-1) TN(mg L-1) TN(mg L-1) 0 10 20 30 40 50 60
0 1 2 3 4 5 6 7
(b) DS
0 1 2 3 4 5 6 7
0 1 2 3 4 5 6 7
0 5 10 15 20 25 30
(c) GS
0 5 10 15 20 25 30
0 5 10 15 20 25 30
0 2 4 6 8 10 12
(d) KS
(a) TS (b) DS (c) GS (d) KS
0 2 4 6 8 10 12
0 2 4 6 8 10 12 Pre-monsoon
Pre-monsoon Monsoon
Monsoon Post-monsoon
Post-monsoon 0
5 10 15 20 25 30
0 5 10 15 20 25 30
0 5 10 15 20 25 30
0 2 4 6 8 10 12 14
0 2 4 6 8 10 12 14
0 2 4 6 8 10 12 14
0 5 10 15 20 25
0 5 10 15 20 25
0 5 10 15 20 25
0 5 10 15 20
0 5 10 15 20
0 5 10 15 20
Fig. 3. Seasonal (Pre==premonsoon, Mon==monsoon, and Pos==postmonsoon) BOD, TN, and TP concentrations in the upstreams (Us), downstreams (Ds), and wastewater treatment plants (WWTPs) in 2007. The stream names are as follows: Tan Stream (TS), Daemyeong Stream (DS), Gwangju Stream (GS), and Kap Stream (KS).
nutrients concentrations, varied largely between the upstream and downstream, influenced by wastewater treatment plants (WWTPs) depend- ing on the location of the watershed. In the four streams of Tan Stream (TS), Daemyeong Stream (DS), Gwangju Stream (GS), and Kap Stream (KS), seasonal means of biological oxygen demand (BOD) were significantly (p⁄0.01) greater in the downstreams (D
s) than the upstreams (U
s). BOD in the upstream of four watersheds averaged 3.88 mg L
-1while BOD in the downstreams averaged 9.76 mg L
-1(Fig. 2a) indicating that the discharg- ing effect of effluents from the WWTPs was evi- dent. The largest difference of BOD between the D
sand U
soccurred in the stream of TS; Mean BOD in the stream of U
swas 7.0 mg L
-1, but the value increased up to 22.1 mg L
-1(Fig. 2a), result- ing in ¤3-fold difference of BOD in the down- stream. Thus, the water quality, based on the BOD, in the downstream was judged as a “very bad condition” (or VI rank) based on the criteria of stream water quality, the Ministry of Environ- ment, Korea (MEK, 2003). In contrast, BOD val- ues in the remaining downstreams of DS, GS, and KS were lower than 2-fold, compared to the
upstream BODs. (Fig. 2a). Therefore, the removal efficiency of organic matter from the WWTPs may be lower in the TS than in any other locations (DS, GS, and KS). Also, organic matter pollutions, based on chemical oxygen demand (COD), showed a similar patterns with BODs in the four streams (Fig. 2b).
As shown in Fig. 2, the removal effect of nutri- ents (nitrogen and phosphorus) from the WWTPs was much less than the BOD. Concentrations of total nitrogen (TN) were ⁄4 mg L
-1in the up- streams of DS, GS, and KS, whereas TN was 8.14 mg L
-1in the upstream of TS (Fig. 2c). The data of nitrogen indicates that the water quality was worse in the upstream of TS than any other up- streams. However, after the effluent discharge from the WWTPs, TN was increased up to 15.2 mg L
-1in the GS and 9.7 mg L
-1in the KS (Fig.
2c), resulting in 7 times and 4 times greater in the downstreams, respectively. This result indi- cates that the removal efficiency of nitrogen from the WWTPs may be low, especially in GS and KS and the difference of TN between the upstreams and downstreams were most pronounced in the streams of GS and KS. Compared to the BOD in
0.0 0.5 1.0 1.5 2.0
0.0 0.5 1.0 1.5 2.0
0.0 0.5 1.0 1.5 2.0
0.0 0.5 1.0 1.5 2.0
0.0 0.5 1.0 1.5 2.0
0.0 0.5 1.0 1.5 2.0
0.0 0.5 1.0 1.5 2.0 2.5 3.0
0.0 0.5 1.0 1.5 2.0 2.5 3.0
0.0 0.5 1.0 1.5 2.0 2.5 3.0
0.0 0.5 1.0 1.5 2.0 2.5
0.0 0.5 1.0 1.5 2.0 2.5
0.0 0.5 1.0 1.5 2.0 2.5
Us WWTP Ds
Us WWTP Ds
Us WWTP Ds Us WWTP Ds Us WWTP Ds Us WWTP Ds
Us WWTP Ds Us WWTP Ds Us WWTP Ds
Us WWTP Ds Us WWTP Ds Us WWTP Ds
TP(mg L-1) TP(mg L-1) TP(mg L-1)
(a) TS (b) DS (c) GS (d) KS
Pre-monsoon
Monsoon
Post-monsoon
Fig. 3. Continued.
the streams, the mean removal efficiency of N from the WWTPs was much lower than the re- moval of BOD. Our data suggest that removal efficiency of nitrogen from the WWTPs should be improved for the stream conservations.
Similarly, total phosphorus (TP) in the upstre-
ams of four watersheds averaged 230 μg L
-1while TP in the downstreams averaged 893 μg L
-1(Fig.
2d) indicating that the discharging effect of phos- phorus from the WWTPs was evident. The largest difference of TP between the Ds and Us occurred in the streams of GS and KS; In the downstreams
14 16 18 20 22 24
2 4 6 8 10 12 14 16 18
14 16 18 20 22 24
0 2 4 6 8 10 12
7 8 9 10 11 12 7 8 9 10 11 12
1 2 3 4 5 6 7 8
,
0 1 2 3 4 5
0 5 10 15 20 25 30
6 8 10 12 14 16 18 20 22 24 26
0 2 4 6 8 10 12 14 16 18 20
2 4 6 8 10 12 14 16 TN(mg L-1)TN(mg L-1)TN(mg L-1)TN(mg L-1)
TN (mg L-1) from the WDPs TN (mg L-1) from the WDPs TN(mg L-1)TN(mg L-1)TN(mg L-1)TN(mg L-1)
(a) TS
(b) DS
(c) GS
(d) KS
DS US
DS US
DS US
DS
US
8 10 12 14 16 18 20
8 10 12 14 16 18 20 8 10 12 14 16 18 20
22 24 26 8 10 12 14 16 18 20 22 24 26
DS-US
DS-US
DS-US
DS-US
Fig. 4. Relations of stream water TN to the TN from the wastewater treatment plants (WWTPs) in the four streams of Tan Stream (TS), Daemyeong Stream (DS), Gwangju Stream (GS), and Kap Stream (KS).
p==0.0018, r
2==0.6397
p==0.3414, r
2==0.0907
p==0.0003, r
2==0.7428
p==0.0013, r
2==0.6634
of GS and KS, mean TP was increased by 7-fold and 4-fold, respectively (Fig. 2d). Data of nitrogen and phosphorus in the downstreams suggest that nutrient enrichment is much higher than the or- ganic input and the N and P effluents from the WWTPs in the GS and KS was most pronounced in this study.
2. Seasonal effects of BOD, COD, and nutrients by effluents of WWTPs
Seasonal dilution means stream river usually contains abundant stream river volume in sum- mer than other seasons because of much precipi- tation (Lee et al., 2008a). Seasonal dilution which is caused by much precipitation of organic matter, based on BOD, during the summer monsoon of July~September was most pronounced in the downstreams of all four watersheds. Mean BOD in the effluents from wastewater treatment plant (WWTPs) was 8.04 mg L
-1, 7.04 mg L
-1and 6.92 mg L
-1, respectively (Fig. 3) in the premonsoon (P
r), monsoon (M
o), and postmonsoon (P
o), indica- ting almost same concentrations regardless of the season. In the downstream of TS, maximum BOD in the M
owas 32.9 mg L
-1, which is 2-fold lower than the BOD values of the P
rand P
o(Fig. 3).
Thus, BOD in the downstream was judged as
“very bad condition (VI rank)” of criteria of MEK regardless of the season. Severe pollution by high BOD in the downstream may be a results of long- term accumulations of organic matters, even if
the current BOD level of the effluents was 11.7 mg L
-1and was not so much different from the upstream in the premonsoon (10.7 mg L
-1). Such phenomenon were also found in the upstream during the monsoon, indicating that organic mat- ter in the downstream is largely diluted by the rain water, which results in water quality impro- vement. But there was still nearly 2~3 fold dif- ferences of BOD between the upstream and down- stream during the three seasons (Fig. 3a of BOD).
In the mean time, mean BOD values in the stream of TS were nearly same regardless of the season, indicating a large dilution of BOD by the rain or upstream waters. However, as the precipitation decreased, BOD increased to previous level of 5.6 mg L
-1(Fig. 3).
Similar dilutions of BOD by the monsoon rain were shown in the downstreams of GS and Ks.
However, mean TN in the downstreams during the monsoon varied little in the all four streams;
In the downstream of TS, mean TN was 11.74 and 15.03 mg L
-1in the premonsoon and postmon- soon, respectively, while in the downstream of DS, TN was 5.44 and 6.94 mg L
-1in the premonsoon and postmonsoon. Also, there were no significant (p¤0.05) differences of TN between premonsoon and the monsoon in the downstreams of GS and KS. These results in the four downstreams influ- enced by the WWTPs suggest that nitrogen con- tents may not have a large seasonal dilution of downstream water by summer monsoon. The dy- namics of N seemed like a different pattern, com-
2 4 6 8 10 12
0 5 10 15 20 25 30 TS
DS GS KS
8 10 12 14 16 18 20 0
5 10 15 20
1.0 1.1 1.2 1.3 1.4 1.5 1.6 0.0
0.5 1.0 1.5
7 8 9 10 11 12
0 5 10 15 20
5.5 5.6 5.7 5.8 5.9 6.0 0
5 10 15 20
5.5 5.6 5.7 5.8 5.9 6.0 0.0
0.5 1.0 1.5 5.5 5.6 5.7 5.8 5.9 6.0 0
5 10 15 20 25 30
5.5 5.6 5.7 5.8 5.9 6.0 0
5 10 15 20
BODds(mg L-1)TNds(mg L-1) TPds(mg L-1) TPds(mg L-1)
TNds(mg L-1)BODds(mg L-1)
CODds(mg L-1) CODds(mg L-1)
BOD (mg L-1) from the WDPs
TN (mg L-1) from the WDPs TP (mg L-1) from the WDPs
COD (mg L-1) from the WDPs Log10(SV)
Log10(SV) Log10(SV)
Log10(SV)
(a) (b)
Fig. 5. (a) Relations of water quality (BOD, COD, TN, TP) in the downstreams to water quality (BOD, COD, TN, TP) of WWTPs and stream water volume (SV).
pared to variables of BOD, COD and total phos- phorus.
3. Relations of downstream TN to effluent’s TN from WWTPs
Regression analysis of TN in the downstreams against the TN from the WWTPs showed that in the TS, DS streams, regression slopes in the upstreams were similar slopes to the downstre-
am’s; The slope in the TS was 0.5342 and 0.8399 in the upstream versus downstream, respectively and the slope in the DS were 0.2982 and 0.3255 in the upstream versus downstream, respectively.
However, the slope between the upstream and downstream was significantly different in the GS (p⁄0.001) and KS (p⁄0.01). The data indicate that the upstream nitrogen in the GS and KS was mainly influenced by effluents from the waste- water treatment plants, but not by the nitrogen
Precip.(mm)Precip.(mm)SV(m3 sec-1)SV(m3 sec-1)BOD(mg L-1)BOD(mg L-1)TN(mg L-1)TN(mg L-1) 0 50 100 150 200 250 300
(1) TS
0 100 200 300 400
(2) DS
0 2 4 6 8 10
0 2 4 6 8 10
J F M A M J J A S O N D
0 5 10 15 20 0 5 10 15 20 25 30
J F M A M J J A S O N D
0 5 10 15 20 25 30 0
100 200 300 400 500 600
(3) GS
0 5 10 15 20 25
0 10 20 30 40 50 60
J F M A M J J A S O N D
0 5 10 15 20
0 200 400 600 800 1000 1200
J F M A M J J A S O N D
0 2 4 6 8 0 12 34 5 67
0 100 200 300 400 500 600
(4) KS
0 10 20 30 40 50 60
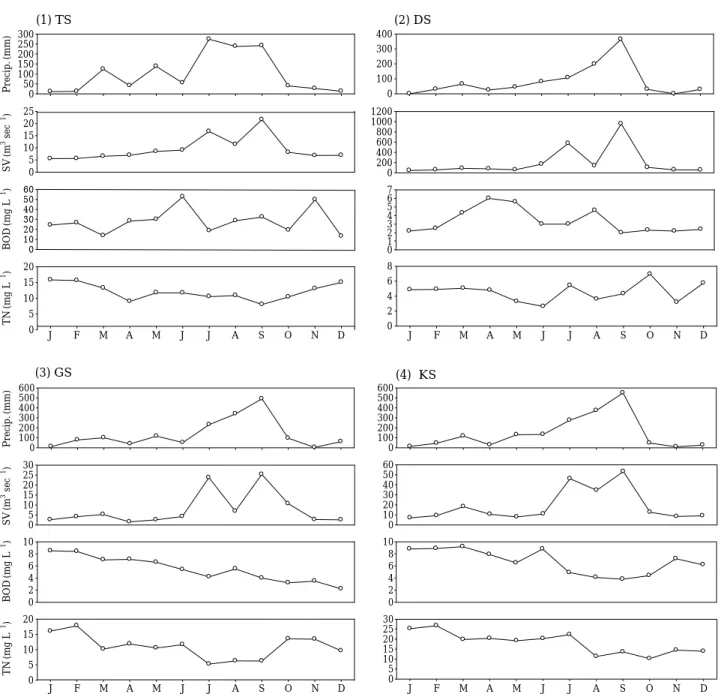
Fig. 6. Monthly variations of precipitation (Precipi.), stream water volume (SV), downstream BOD and TN in the four streams of Tan Stream (TS), Daemyeong Stream (DS), Gwangju Stream (GS), and Kap Stream (KS).
input from the upstreams, and that in other stre- ams of TS, DS, the nitrogen in the downstreams is influenced by both of N from the WWTPs and N from the upstreams. Under this circumstance, nitrogen should be controlled by decreases of N from the upstreams as well as the decreases of nitrogen from the WWTPs.
Influences of WWTPs effluents in the downstre- am with all sampling sites indicate that TS is the most influenced site in BOD value (Fig. 5a). The relation between WWTPs effluents and stream river volume (SV) of all sampling site (Fig. 5b) shows that TS has the most abundant SV, but pol- lutant level doesn’t follow it. It is considered that other factors have more effect than SV’s effects.
4. Seasonal influence of precipitation and stream discharge on the water quality According to analysis of seasonal organic matter and nitrogen dynamics in the streams, rainfall (precipitation) within the watershed influenced directly stream discharge, even if the absolute values in the stream inflow varied depending on the size of streams (Fig. 6). Especially, in July, there is rapid change in precipitation, stream river volume, BOD and TN in the four watersheds.
Precipitation of TS in June is 54.5 mm and that in July is 274.1 mm. And BOD of TS in June is 52.9 mm and that in July is 19.1 mm. SV and TN is showed a similar patterns with precipitation and BODs in the four streams.
ACKNOWLEDGEMENTS
This research is supported by the grant “Assess- ment model developments of biological, chemical, and physical habitat in the level of fish individual and community in aquatic ecosystems and their optimum stressor analysis”, the Ministry of Envi- ronment, Korea in 2009.
LITERLATURE CITED
An, K.G., K.I. Kim and J.H. Kim. 2007. Biological water quality assessments in wastewater-impacted and non-impacted streams. Korean J. Limnol. 40 (1): 82-92.
Bae, D.Y. and K.G. An. 2006. Stream ecosystem assess- ments, based on a biological multimetric parame- ter model and water chemistry analysis. Korean J. Limnol. 39(2): 198-208.
Bae, D.Y., E.C. Yang, S.H. Jung, J.H. Lee and K.G.
An. 2007. Nutrients and chlorophyll dynamics along the longitudinal gradients of Daechung Re- servoir. Korean J. Limnol. 40(2): 285-293.
Choe, J.W. and Y.H. Lee. 2005. Influence of Gwangju stream on the waste water disposal plants influx water quality. 2005 Collaboration autumn scienti- fic anouncement p. 111-121.
Eom, M.C., K.Y. Lee, G.H. Jo and J.W. Lim. 2004.
Characteristics of pollutant runoff from the Sae- mangeum Basin. KCID J. 11(1): 77-87.
Huh, I.R., J.Y. Choi, Y.J. Kim and U.H. Jeong. 2005.
Effect of municipal sewage treatment plant on water quality in western kangwon area. Kor. J.
Env. Hlth. 31(4): 235-240.
Kim, H.M., J.H. Lee and K.G. An. 2008. Water quality and ecosystem health assessments in urban stream ecosystems. Korean J. Environ. Biol. 26(4): 311- 321.
Kim, Y.C., D.R. Lee and G.S. Hwang. 2005. Determi- nation of representative long-term water quality parameters of the streams in estuarine lake. Envi- ronmental Engineering Research 27(3): 262-272.
Kim, Y.P., E.H. Lee and K.G. An. 2009. Ecological health assessment of Dongjin river based on che- mical measurement and fish assemblage analysis.
Korean J. Limnol. 42(2): 183-191.
Kwak, D.H., S.J. Yoo, J.H. Kim, I.H. Lim, J.Y. Kwon and P.G. Chung. 2008. Characteristics of non-point pollutant discharge from upper watershed of Seom- jin Dam during rainy season. J. of Kor. Society of Wastewater 22(1): 39-48
Lee, C.S. 2008. Influence of the point source inflow on the water quality variation in the downstream of Hyeongsan river. Journal of the Environmental Sciences 17(10): 1075-1080.
Lee, J.K., W.H. Jeong, S.B. Yim and H.D. Jong. 2008a.
Variation of quality and quantity of river basin by the distribution of wastewater treatment plants.
Collaboration spring scientific anouncement 381- 382.
Lee, J.Y., S.H. Jang and J.S. Park. 2008b. Analyzing runoff pollutant roading characteristics of non- point source during rainfall in urban area-focuss- ing of Pohang region. J. of Kor. Society of Water Science and Technology 16(1): 35-44.
Lee, K.J., K.S. Kee, T.H. Park and J.S. Kim. 2008c. A study on monitoring method of ecological restora- tion land and unused land management for im- provement of water quality, Nakdong-river. Korean J. Environ. Ecol. 2008(1): 110-112.
Lee, S.C., J.H. Han and K.G. An. 2008d. Functional modifications of Daechung Reservoir eutrophica- tion by upper dam construction. Korean J. Limnol.
41(3): 348-359.
Lee, T.G. and H.S. Byun. 2001. The Management for the water quality of Jung-rang River. J. of Kor.
Technological Society of Water and Waste Water
Treatment 9(1): 45-52.
Ministry of Environment, Korea (MEK). 2002. Deve- lopment of sewage purifying process system &
characteristic analaysis in the inside and outside of the country.
Ministry of Environment, Korea (MEK). 2003. Regio- nal effluents water quality of wastewater disposal plants.
Ministry of Environment, Korea (MEK). 2007a. Sewa- ge statistics. 11-1480000-000159-10.
Ministry of Environment, Korea (MEK). 2007b. Analy- sis of wastewater disposal plants operation mana- gement in 2006.
Park, J.D., J.H. Park, D.H. Rhew and D.I. Jeong.
2008. Estimation of nonpoint discharge coefficient for the management of total maximum daily load.
J. of Kor. Society on Water Quality 24(4): 452-457.
(Manuscript received 1 November 2009, Revision accepted 17 December 2009)