*Corresponding Author : Kun Chang Lee([email protected])
Received January 2, 2019 Revised January 30, 2020
Accepted February 20, 2020 Published February 28, 2020
Exploring the Sentiment Analysis of Electric Vehicles Social Media Data by Using Feature Selection Methods
Francis Joseph Costello
1, Kun Chang Lee
2*1
PhD Student, SKK Business School, Sungkyunkwan University
2
Professor, Global Business Administration/Dept of Health Sciences & Technology, SAIHST (Samsung Advanced Institute for Health Sciences & Technology)
Sungkyunkwan University
속성선택방법을 이용한 전기자동차 소셜미디어 데이터의 감성분석 연구
프란시스 조셉 코스텔로
1, 이건창
2*1
성균관대학교 경영대학 박사과정
2
성균관대학교 글로벌경영학과/삼성융합의과학원 융합의과학과 교수
Abstract This study presents a recently obtained social media data set based upon the case study of Electric Vehicles (EV) and looks to implement a sentiment analysis (SA) in order to gain insights. This study uses two methods in order to fully analyze the public’s sentiment on EVs. First, we implement a SA tool in which we used to extract the sentiment of comments. Next we labeled the data with these sentiments obtained and classified them. While performing classification we found the problem of dimensionality and also explored the use of feature selection (FS) models in order to reduce the data set’s dimensionality. We found that the use of three FS models (Chi Squared, Information Gain and ReliefF) showed the most promising results when used alongside a logistic and support vector machines classification algorithm. the contributions of this paper are in providing an real-world example of social media text analytics which can be adopted in many other areas of research and business. Moving forward researchers can use the methodological approach in this paper to further refine and improve their own case uses in text analytics.
Key Words : Text Mining, Sentiment Analysis, Classification, Feature Selection, Electric Vehicles
요 약 본 연구는 전기자동차(EV)에 대한 소셜미디어 데이터를 기반으로 감성분석 (SA)과 속성선택 (FS)방법을 적용하 여 전기자동차에 대한 일반 사람들의 의견을 보다 효과적이고 정확히 예측할 수 있는 새로운 방법론을 제안한다. 구체 적인 방법은 다음과 같다. 첫째, 유튜브에 있는 전기자동차에 대한 일반 사람들의 의견을 추출하였다. 둘째, 분석의 효과성을 증대하기 위하여 카이 스퀘어, 정보획득량, 릴리프에프 등 세가지 속성선택 방법을 적용하였다. 그 결과 로지 스틱 회귀분석 및 서포트 벡터 머신 분류 기법에서 가장 의미있는 결과를 얻을 수 있다는 것이 확인되었다.
주제어 : 텍스트 마이닝, 감성분석, 분류, 속성선택, 전기자동차
1. Introduction
Electronic Vehicles (EV) have seen a rise in worldwide interest in recent years and thus have grabbed the attention of the public, investors and incumbent players within the automotive industry. Additionally, with environmental concern increasing, academia has started to take a keen interest in EVs, which are now the most studied area of transport regarding the reduction of future transportation emissions [1]. In response, the automotive sector has started to produce their own concepts and visions for the future of EVs in an attempt to adopt to this trend. With this challenge, decision makers rely on tools to help aid their decisions in order to make sense of the ecosystem in which one actor may be positioned. Intuition and experience are relevant human qualities that can aid the decision-making process, but to truly capture deep and meaningful insights, business analytics should also be explored [2]. Previous attempts have been made in order to capture meaningful insights using sentiment analysis (SA) on EVs.
Carpenter [3] examined EVs through online web texts to great effect, however, a study on EV social media texts has yet to be fully explored.
Therefore, the aim of this study is to explore the potential of text analytics based on a social media data set and attempt to find viable solutions in which can act as a starting point for other researchers to further develop more precise models based on their own case needs.
This research thus differs from previous research attempts which have not used social media texts regarding the EV technology.
SA, a sub-section of text mining (TM), has started to become a fundamental method with which is being used extensively in various fields to extract value from texts [4]. As a tool SA has great power in providing detail on the polarity of overall texts through sentiment scores. However, it lacks the ability of being able to quickly
capture the sentiment of text through classification. Hence when applying text analytics to a data set one must be open to the use of many classification models in order to find one that fits the purpose of the task. One problem however is the dimensionality of the data, also known as the dimensionality curse [5].
Reducing this ‘curse’ is the role of feature selection (FS) and also explored within this study.
Overall, this study looks to explore these three important area of machine learning within a social media dataset (in this paper electric vehicles is the chosen case study) in order to provide useful implications to future researchers interested analyzing public sentiment of a target technology.
In order to explore the potential of SA within the case of EV’s social media data, the paper will be organized as follows. Related work will be identified in order to show recent problems and trends in TM and feature selection. Lastly, the case of EVs and why their study is an important and growing field will be examined. Then we will present the methodology of this paper, before finally proposing our results, with discussion, limitations and future recommendations all following.
2. Related Work
2.1 Text Mining in Social Media
The rise in unstructured data sources can be attributed to the rise of platforms such as YouTube, Twitter and Facebook. Injadat et al. [6]
found that from all the TM studies they identified
within their analysis, 62 percent had been
performed with data from social media. Thus,
social media analytics has emerged as a tool
which can create value. Additionally, comments
on social media are increasingly taken into
account by the end customer and therefore
business decisions from social media are now an ever more timely and valuable information source [2]. With this, text mining in social media has become an increasing research area, with examples seen in stock price analysis [7], Tweet dataset predictions [8], marketing insights [2], and crowdfunding [9].
2.2 Sentiment Analysis Within Text Mining Selecting the right approach for SA social media is crucial for achieving high accuracy. At present there exists two main approaches: the lexicon-based approach and the machine learning approach to SA. Each approach differs in methodology, however, produces the same result of a positive, negative, and neutral sentiment of the text [10].
The machine learning approach uses classifiers to learn by examples. Turney used an unsupervised approach whereby the mutual information between document phrases and two chosen words “excellent” and “poor” were implemented. Mutual information was compared using statistics by a search engine in order to train the classifier. Despite showing good accuracy, machine-learning techniques have remained fairly domain specific to the task in which they were created for [11].
The lexicon-based approach is where words have been given a sentiment which is then organized into a sentiment dictionary or sentiment lexicon [10]. Up till now, popular lexicon-based approaches have been seen in SentiWordNet, SentiWords and SenticNet.
However, these SA methods run into problems when social media texts are present. Therefore, sentiment lexicons have started to adapt to deal with the deliberate nature of misspelled words and emoticons seen in social media [12]. In this study we implemented the use of SentimentR for our analysis. This package was selected due to its ability to give a text polarity score based on the
use of lexicons as well as its ability to identify valence in sentences. Furthermore, this SA package has worked well with social media texts [12].
2.3 Classification & Dimensionality
Specifically, in the field of text classification, academic theories on FS have become very popular with many areas of text classification.
Upon classification within social media texts, high dimensionality is common. This increases the overall computing time and power needed in order to perform some of the most basic machine learning algorithms [5]. Through the removal of redundant and irrelevant features, feature selection in classification can help to increase the accuracy while speeding up the training process [13]. Specific to social media data sets, there is a lack of research on using data from YouTube in order to analyze the performance of the various FS models and classification models. Previously social media data sets have been used based on Yahoo and Twitter [14], however not YouTube and thus an exploration of YouTube data sets should help to explore classification and FS in this given domain.
2.4 Case Study: Electric Vehicles (EV)
Recently there has been a downward trend in
CO
2emissions [15]. With the Paris Declaration on
Electro-Mobility and Climate Change stating they
want to see deployment of one hundred million
EVs by 2030, EVs are seen as the transportation
of the future [16]. This has increased the need
for actors to have the ability to analyze the
marketplace effectively and create value from
online data such as social media [2]. It is
common knowledge that problems in the size and
durability of the current battery technology used
in EVs are a problem [17]. Also, uncertainty in the
battery recharge infrastructure as well as
recharge times are all key problems that keep EVs
from rapid penetration into the marketplace [18].
Increasingly through the effective usage of data mining, users can acquire the power to understand the public view on certain aspects of EVs. With this onset of interest worldwide, the use of SA in order to quickly analyze trends in this technology can help to give actors engaging in business analytics a reliable tool in which to extract valuable information effectively and efficiently.
3. Methodology
3.1 Stage 1: Sentiment Analysis
In stage one, the search term “electric car” and
“electric vehicle” was entered into YouTube’s search bar, with a timescale set from June 2018 to December 2018. This provided videos on EVs, which were then selected based on the criteria of relevance, comment themes, and comment size (total number of comments). Our reasoning for using YouTube comments was for the following:
(1) Compared with Twitter which is limited to 240 characters, YouTube has no limitation on comment length. This allows for people to express opinions in greater detail. (2) There is a plethora of videos on EVs, as well as great numbers of views. Additionally, if someone is willing to watch an EV video and comment on the matter, they a more likely to show more passion in their posted comments.
Next, data cleaning was performed in order to remove any irrelevant or unfamiliar text. SA was then performed using the SentimentR algorithm, available on R through CRAN [12]. The analysis gave each comment from YouTube a score.
Positively sentences were given a positive number with negative sentences receiving a negative score. Scores were created into an overall sentiment level. After performing SA, comments were labelled manually to match the
scores that were created from the SA. Once this process was complete stage two was implemented.
3.2 Stage 2: Classification and FS
In stage two, the WEKA software package [26]
was utilized in order to transform the data.
Nominal data was transformed to a word vector data set using the stringtowordvector filter.
Term-Frequency Inverted Document Frequency algorithm was also applied to the text as well as the snowball stemmer and N-gram tokenizer. The final data set included 19,000 instances and 1508 attributes.
Next the FS was implemented with four common FS methods, namely ReliefF [20], Correlation-based FS [21], Information Gain [22]
and Chi-squared [22] implemented for analysis.
Furthermore, based on research undertook by da Silva, Hruschka and Hruschka Jr. [8] we also used K-Fold Cross Validation alongside a comparison of single classification algorithms Naïve Bayes (NB), Decision Tree (DT), Support Vector Machines (SVM), Logistic Regression (LR) and ensemble classification models Random Forrest (RF), Bagging (BA), Random Subspace (RS), AdaBoost (ADA). Specifically, in this study 10-Fold Cross Validation was implemented in each classification task in order to maximize the use of all the training set data. K-Fold Cross Validation is where data is partitioned into test and training sets. This way, the whole data set is used and is portioned into the amount of folds that is required from the user. Once the tests have run for the number specified by the user, it then gives an average result of the combined fold’s results [19].
3.3 Methods of Analysis
Next, to compare and contrast the chosen
models we used accuracy, precision, recall,
f-measure, and area under the curve (AUC) [23].
Firstly, accuracy can be measured by calculating the confusion matrix in the following way:
[a]
Accuracy is used in this study as it the way to show the true performance of each given model.
Given this, accuracy allows for an easy to understand and quick representation of the performance of each individual result allowing for an easy comparison. Next, precision results are given as it allows for the user to make an assessment on how much repeatability a model has. This can allow the user to know if the measurements were used with unchanged conditions, the same outcome would appear. It is represented in the following way:
[b]
The next metric we have used is recall. This looks to give information on the total number of items selected that were relevant, and therefore is also known as sensitivity. It shows the total number of relevant instances retrieved over the
total number of possibly selected relevant instances, it can be represented in the following way:
[c]
Next, we have included the f-measure metric.
This is because it gives the results of the harmonic mean of precision and recall, with precision being the result of all the correct positives and recall being the number of correct positive results divided by the relevant samples.
Its best value is seen at 1 and can be measured in the following way:
× Pr
Pr ×
[d]
The last metric we have used in our analysis is AUC. The AUC uses two distinct metrics and plots them in order to find out how well a model can classify true results. The curve plots two parameters; recall or true positive rate and the false positive rate. These can be represented in the following way:
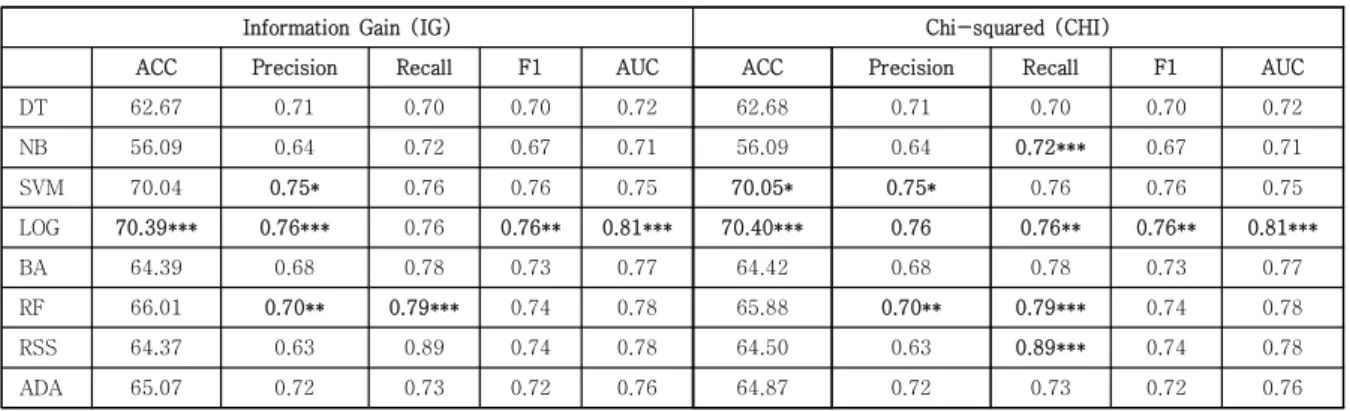
Fig. 1. Sentiment of electric vehicles in 2018 based on the YouTube data set. Blue represents the negative
comments, orange the neutral, and green the positive.
[e]
The AUC curve plots TPR against FPR at different classification thresholds and aggregates a measure of performance across all possible classification thresholds. In other words, the model looks to interpret the probability the model ranks a random positive instance more highly than a random negative instance.
3.4 Justification of Research Methodology Our justification for the use of SentimentR as our main SA tool is for the following reasons.
Traditional tools such as SentiWord and SentiStrength use lexicon that has been given a prior “positive,” “negative,” or “neutral”
sentiment. This approach is too reductive.
English is syntactically complex, lexically rich and thus more complicated. Naturally humans listen to an entire sentence and derive meaning from a total sentence, or greater than the individual sum of words that are used to build up a given sentence. This is where the SentimentR package looks at SA with a lexicon of words that tend to slide sentiment to one direction or the other and makes a decision based on the sum of the sentence.
Next, all feature selection models seen in this paper were selected based on their effective implementation in prior research. These include RFF [24]; IG [25]; CHI [26]; PSO [27], and CFS as a baseline based on recommendations from Witten, Frank & Eibe [19].
4. Results
In this section we will present the results from our SA results. To begin with, we performed the SA by analyzing each comment as if it was a sentence. Therefore, in the SA results the overall scores can be viewed through the sentiment
score on the X-axis and the number of sentences that have this sentiment score on the Y-axis.
Overall for our data set we produced a graph which allows for a quick visualization of our obtained results as seen in Figure 1.
First, our SA showed that positive sentiment towards EVs was greater than negative sentiment.
In this result it is clear to see that slightly positive comments are far greater than negative comments. Furthermore, the negative sentiment plateaus at around -0.5 with very little comments outside this range. In contrast, positive comments between 0.5 and 1 show slightly more concentration compared to negative sentiment.
Figure 1 shows that positive sentiment has a greater strength in numbers based on the 2018 data set and therefore at a quick glance the public’s sentiment towards EV are currently more in favor of EV technology.
Next we used the sentiment as a way to class the comments into their correct sentiment label to be analyzed through machine learning techniques. This lead to the second stage of our study we applied the FS methods and classification. FS was performed resulting in a reduction of the dimensionality of the dataset as can be seen in see Table 1. CFS and PSO FS showed the greatest reduction of the dataset with CFS selecting less than 10% of the original features. IG and CHI selected the same number of features with 840 chosen and RFF selected 825 total features. The original dataset consisted of 1508 attributes and as can be seen was significantly reduced by the all the FS techniques.
Feature Selection of the YouTube Data Set
Before FS ReliefF CFS IG CHI
FS (
n
) 1508 825 60 900 902Table 1. This Table presents the original number of features of the data set and the number of features after each FS method was implemented.
In order to test the ability of these FS models
within an EV social media setting we will next employ a classification task based on the three classes obtained from the SA. In this study we will implement four single classifiers: Decision Tree (DT), Naïve Bayes (NB), Support Vector Machines (SVM), and Logistic (Log). Also we implemented four ensemble classifiers: Bagging (BA), Random Forrest (RF), Random SubSpace (RSS), and Boosting (ADA), (see Table 2).
Definitions of Classification Models
DT
Decision Tree - A tree like model whereby a test is made on a node and then each branch represents a test and each leaf node represents a class label.
NB Naive Bayes –simple probabilistic classifier that uses Bayes’ Theorem.
SVM Support Vector Machine – Creates an optimized hyperplane based on the classes given in the data.
LOG Logistic – A simple algorithm that uses the logistic function to classifier data.
BA Bagging – A bootstrap ensemble that can imrove accuracy and stability of the sample by reducing the variance.
RF Random Forest – A model that impliments many DT models into one enseble learner.
RSS
Random SubSpace – An ensemble learner that combines many base learning models into one superieor learning model.
ADA Ada Boost – Combines multiple weak learners into one model representing a boosted algorithm.
Table 2. Definition of the classifications models seen within this study [19].
Before Feature Selection
ACC Precision Recall
F1
AUCDT 62.74 0.71 0.70 0.71 0.72
NB 56.31 0.64 0.72 0.68 0.71
SVM 69.15 0.74 0.76 0.75 0.74
LOG 68.48 0.74 0.75 0.75 0.79
BA 64.46 0.68 0.78 0.73 0.77
RF 65.94 0.68 0.82 0.75 0.78
RSS 64.09 0.63 0.89 0.74 0.78
ADA 65.15 0.72 0.74 0.73 0.77
Table 3. Result of classification task whereby no feature selection was used on the data set.
These results act as the null hypothesis in which we use to benchmark the selected feature selection.
We will test the performance of the classification models as well as the FS performed.
Including the analytical tools already discussed, we also implemented a t-test on all the K=10 folds of data. Before FS is given as the null hypothesis providing a statistical analysis of the significance of the experimental results with the given p value.
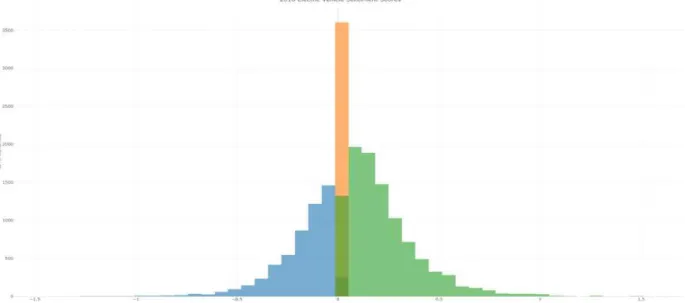
To begin with, it is clear to see that compared to the baseline of no FS, CFS performs considerably worse. This is probably because the model overfit by selecting so few features from the original data set. RFF when used alongside the SVM and LOG showed the most promising results. Both models achieved an accuracy of over 70% and we can reject the null hypothesis for all metrics when used with the LOG algorithm. For IG and CHI, similar results were seen whereby SVM and LOG showed the most promising results, however, no model was found to be completely significant in terms of all the metrics analyzed. Interestingly, single classifiers (SVM and LOG) outperformed the ensemble techniques seen within this study. This goes against recent trends whereby ensemble techniques have been shown to outperform single classifiers in machine learning tasks (all result are seen in Table 4, 5) [28].
In summary, the results show that the use of RFF within a social media text analytical study is statistically viable when used alongside an SVM or LOG classifier to classify the public’s sentiment on EV technology. The use of IG and CHI too when used with SVM and LOG were also found to be reliable models for analyzing the EV social media data set.
5. Conclusion
In this study, we proposed the use of a newly
acquired data set based on Electric Vehicle (EV)
YouTube comments in a way to study the
viability of sentiment analysis (SA) for an
informal social media data set. Compared to
prior research i.e. Carpenter [3] this paper looks to study EV social media data. In this paper we implemented the use of SentimentR [12]. After we implemented SA, we used this data to then classify the data based on the obtained SA results whereby positive, negative and neutral scores were produced. In doing so we realized the problem of dimensionality within the dataset.
Prior academia has shown that when there is high dimensionality, feature selection (FS) is a much needed tool and thus we looked to previous academia for trends in FS as a solution.
Lastly, we looked to implement well-known classification models that had been previously shown to have good results in various machine learning tasks [8].
5.1 Key Findings
Overall, we have shown in this study that sentiment on EVs is currently more positive than negative. We have found that EVs are a trending technology which is gaining positive feedback from the public based on the results obtained from the SA. Additionally, when it comes to predicting this sentiment through classification techniques, we found that ReliefF, Information Gain and Chi-squared feature selection used alongside a logistic and support vector machines algorithm has the best accuracy in predicting the social media sentiment EVs . These results were further examined through a t -Test which showed these models to be significantly more accurate against the data set whereby no feature selection was implemented. With these results we have
Correlated-based Feature Selection (CFS) ReliefF (RFF)
ACC Precision Recall F1 AUC ACC Precision Recall F1 AUC
DT 56.11 0.64 0.69 0.67 0.69 62.81 0.71 0.70 0.70 0.73
NB 53.55 0.65 0.64 0.65 0.68 56.32 0.64 0.72 0.68 0.71
SVM 54.55 0.54 0.95 0.69 0.52 70.03*** 0.75** 0.76 0.76** 0.75*
LOG 56.66 0.64 0.72 0.68 0.71 70.61*** 0.76*** 0.76*** 0.76*** 0.81***
BA 56.11 0.65 0.69 0.67 0.70 64.62 0.69 0.78 0.73 0.77
RF 55.48 0.64 0.67 0.66 0.69 66.58 0.70*** 0.80*** 0.75 0.79
RSS 54.55 0.54 0.98 0.69 0.70 64.39 0.63 0.89 0.74 0.78
ADA 56.11 0.64 0.69 0.67 0.67 65.22 0.72 0.73 0.73 0.77
p
-value *0.05 **0.01 ***0.001Table 4. In this table we show the results from implementing the single and ensemble classification models for both the CFS and RFF FS. t-Test is performed for both models against the original data set’s results seen in Table 3.
Information Gain (IG) Chi-squared (CHI)
ACC Precision Recall F1 AUC ACC Precision Recall F1 AUC
DT 62.67 0.71 0.70 0.70 0.72 62.68 0.71 0.70 0.70 0.72
NB 56.09 0.64 0.72 0.67 0.71 56.09 0.64 0.72*** 0.67 0.71
SVM 70.04 0.75* 0.76 0.76 0.75 70.05* 0.75* 0.76 0.76 0.75
LOG 70.39*** 0.76*** 0.76 0.76** 0.81*** 70.40*** 0.76 0.76** 0.76** 0.81***
BA 64.39 0.68 0.78 0.73 0.77 64.42 0.68 0.78 0.73 0.77
RF 66.01 0.70** 0.79*** 0.74 0.78 65.88 0.70** 0.79*** 0.74 0.78
RSS 64.37 0.63 0.89 0.74 0.78 64.50 0.63 0.89*** 0.74 0.78
ADA 65.07 0.72 0.73 0.72 0.76 64.87 0.72 0.73 0.72 0.76
![Table 2. Definition of the classifications models seen within this study [19]](https://thumb-ap.123doks.com/thumbv2/123dokinfo/5561583.474438/7.892.94.432.401.717/table-definition-classifications-models-seen-study.webp)